
 ?Mathematical formulae have been encoded as MathML and are displayed in this HTML version using MathJax in order to improve their display. Uncheck the box to turn MathJax off. This feature requires Javascript. Click on a formula to zoom.
Abstract
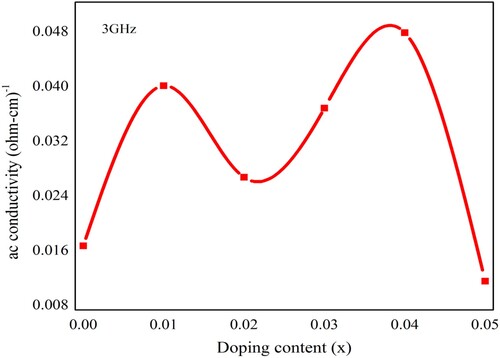
Pb1−4.75xNd0.5xNi4xZrO3 (where x = 0.00, 0.01, 0.02, 0.03, 0.04 and 0.05) nanocrystals were synthesized through the micro-emulsion, a wet chemical route. The prepared samples were annealed at 700°C for 3 h. Nanocrystalline samples were characterized by various techniques like XRD (X-rays diffraction), FTIR (Fourier transform infrared spectroscopy), SEM (Scanning electron microscopy), dielectric properties, and dc-electrical resistivity. XRD analysis of synthesized nanocrystals confirmed the phase development of orthorhombic perovskite structure. The average measured size of nanocrystals was about 21 nm. Some other parameters like densities (bulk and X-rays) and porosity of the nanomaterials were also calculated from obtained XRD data. The obtained results showed the effect of dopant materials (Nd3+ and Ni2+ metal ions) incorporation. The FTIR spectra elucidated the intrinsic cations vibrations in the characteristic perovskite orthorhombic structure. The SEM results revealed that nano-grains were synthesized successfully and their average observed size was 60 nm. It was observed that with the addition of dopant material, the dielectric parameters like dielectric constant, loss factor, and conductivity were showed an overall decreasing trend. The average calculated value of the ac conductivity at the frequency of 3 GHz was observed as 1.45 × 10⁻² (Ω-cm)−1. By using the current–voltage (I–V) characteristics, the dc-electrical resistivity was calculated in the range between 2.68 × 10¹⁰ and 4.82 × 10¹⁰ Ω-cm. The dc-electrical resistivity was increased with the increase of doping contents.
1. Introduction
With the rapid development in the field of sustainable electricity, in recent decades, dielectric materials have been extensively studied for energy storage purposes. The dielectric materials are being used due to their high charging and discharging rate. Presently, the energy storage characteristics of dielectric materials can be steadily improved by enhancing the electric breakdown strength, polarization intensity, etc. Thus these materials can be applied for energy storage purposes [Citation1]. The electric field-dependent dielectric properties of ferroelectric materials have also been studied widely [Citation2]. The dielectric characteristics of the anti-ferroelectric materials can be considerably improved at a high field due to the electric field-induced transition from an anti-ferroelectric state to a ferroelectric one [Citation3]. Lead zirconate (PbZrO3) PZ is a typical anti-ferroelectric material and recently it has been extensively studied for high-density energy storage purposes [Citation1,Citation4,Citation5]. The PbZrO3, a perovskite compound, has been discovered more than half a century ago [Citation6]. The perovskite compounds have a general formula like ABO3 (where A = Pb, Ba, Ca, or Sr, and B = Zr or Ti). Such materials are extensively utilized due to their significant characteristics like dielectric, ferroelectric, optical, and electronic properties. A perovskite material lead zirconate (PbZrO3) has great importance in advanced technology [Citation7]. The characteristics of PbZrO3 can be tailored by different strategies such as the judicial choice of dopants, the synthesis method, and the particle’s size. The literature survey reports that the lead zirconate has already been doped with various elements such as La, Dy, Sm, Eu, Sr, Ba, Ca, Mn, Mg, and Nb to attain the desired results, based on its technological importance [Citation1,Citation6,Citation8,Citation9]. The technological importance of PZ is due to the application in the field of high-energy density capacitors, high-energy storage devices, bolometers for thermonuclear reactors, and large strain actuators due to the phase transformation from anti-ferroelectric to ferroelectric behaviour [Citation10,Citation11]. The PbZrO3 can exist in different phases like the anti-ferroelectric phase or para-electric phase depending upon the temperature. Lead zirconate has a perovskite orthorhombic structure with an anti-ferroelectric phase, at a temperature below 220°C. Such behaviour at the temperature above 230°C (Curi temperature, Tc of PZ) exhibited a para-electric phase with a cubic perovskite structure. In the fine range 220–230°C temperature, PbZrO3 is found as an intermediate ferroelectric phase with the occurrence of defects [Citation10,Citation11].
Several synthesis methods have been reported in the literature for the synthesis of dielectric nanocrystals [Citation12,Citation13]. To attain the preferred characteristics and particular stoichiometry, the choice of synthesis method is very important. For example, the strategy of processing, temperature, starting materials with high purity level, nature, rate of the stirring process, etc. are the factors that control the stoichiometry and the morphology of the prepared oxide. Various chemistry-based synthetic techniques frequently reported in the literature are (i) micro-emulsion, (ii) co-precipitation, (iii) sol–gel method, (iv) conventional solid-state reaction route, and (v) hydrothermal method. All these methods are facile and can be used depending upon the morphology and level of crystallinity required. For example, the morphology of the final product can be tailored by tailoring the synthetic conditions [Citation7,Citation14].
In the present study, a more economic and facile micro-emulsion, a wet chemical route was used to fabricate the Nd3+ and Ni2+ substituted lead zirconate nanocrystals. The aim of such dopants incorporation in PbZrO3 nanocrystals by the facile micro-emulsion synthesis method was to improve the dielectric and electrical characteristics. The choice of dopant materials such as Nd3+ (rare earth metal ions) and Ni2+ (transition metal ions) in PbZrO3 was to observe the favourable variation in the dielectric and magnetic characteristics. The coordination numbers (CN) with ionic radii of different ions that were used in the present study are given as Nd3+, Ni2+, Pb2+, Zr4+, and O2− having ionic radii 0.983, 0.55, 0.98, 0.59, and 1.35 Å, respectively, and coordination numbers (CN) of these ions as VI, IV, IV, IV and II, respectively [Citation15]. The use of the micro-emulsion synthesis method showed the best research tool to control the particle size, geometry or shape, particle morphology, homogeneity, and surface area. One of the advantages of this route over other synthetic routes is the development of nano-reactors, which leads the monodisperse nanocrystals [Citation16–18]. The micro-emulsion growing technique requires a low temperature for the growth of nanocrystals rather than other growing techniques that were performed mostly at a high temperature. The reduced temperature (60°C) in this technique was used. The size of nanocrystals can be tailored due to the control of different factors like stirring time, stirring rate, pH, and the stoichiometric ratios of the precursors [Citation7,Citation14,Citation19–21].
2. Experimental work
Various compositions of lead zirconate with the general formula Pb1−4.75xNd0.5xNi4xZrO3 were synthesized through the micro-emulsion technique. This route is adopted because it is more economic, cheap, and easy to handle the wet chemical route. The chemicals used for the aforementioned compositions are: Zirconyl chloride octahydrate Cl2OZr·8H2O (Sigma Aldrich, 98% pure), Neodymium (III) nitrate hexahydrate Nd(NO3)3·6H2O (Sigma Aldrich 99.9% pure), Lead (II) Nitrate Pb(NO3)2 (Anala R, BDH 99% pure), Nickel nitrate hexahydrate Ni (NO3)2·6H2O (99.99% pure, Sigma Aldrich), Ammonium hydroxide solution NH4OH, and Cetyl trimethyl ammonium bromide (CTAB) C19H42NBr (Bio Basic Canada, 99% pure). The CTAB aqueous solution of 0.3 M concentration was freshly prepared and then utilized immediately for the synthesis of all compositions. The required volume of each salt solution was prepared in different beakers by dissolving the stoichiometric amount of required salt. The metal salt solutions were mixed in the required ratio and then each reaction mixture was placed on the magnetic stirrer. Heating was switched on and when the reaction mixture temperature reached about 55°C, then CTAB solution was added to each separate reaction mixture. The stirring was continued and meanwhile, the pH of the reaction mixture was maintained at about 10 or 11 with the help of freshly prepared aqueous ammonia (3.0 M). All reaction mixtures were stirred at room temperature for a further five hours. After completion of stirring, the solutions were placed on bench static to allow the precipitates to settle down completely overnight. The precipitates were then washed with deionized water several times to get back the pH to a neutral level (i.e. 7.0). The dried precipitates were then grinded and then annealed at 700°C for 3 h using Nabertherm Lilienthal (Germany Mdl. LHT 02/17 Nr.16408) muffle furnace. After the annealing process, the prepared samples were characterized through different characterization techniques.
3. Results and discussion
3.1. Structural analysis
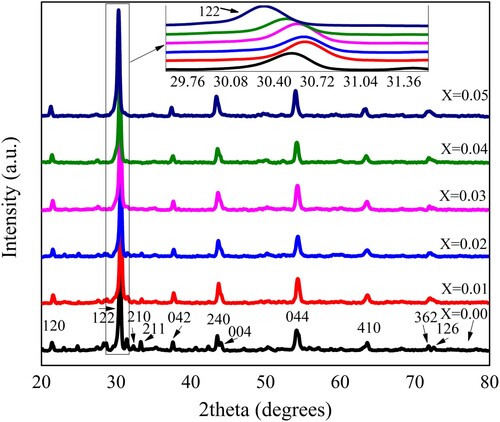
XRD patterns for each powder sample of Pb1−4.75xNd0.5xNi4xZrO3 composition was observed through an X-ray diffractometer (Bruker D-8 Advance). The radiation source (CuKα) was used at 1.4 kW to produce the X-rays. The wavelength of X-rays used was 1.5406 Å. The data was recorded between two theta ranges 20° and 80°. All obtained XRD patterns are shown in Figure . The diffracted planes were identified at various angle values and indexed as (122), (120), (210), (212), (042), (240), (004), (044), (233), (410), (126) and (362). The identified planes were satisfied with the formation of the perovskite orthorhombic body-centered structure of prepared PbZrO3 nanocrystals with the Pba2 32 space group. Furthermore, these identified planes were exactly matched with the previous literature published by the other researchers and also a standard pattern of X-ray diffraction (ICSD 01-075-1607) for PbZrO3 [Citation7,Citation14,Citation22–28].
Figure 1. XRD pattern of pure and doped Pb1−4.75xNd0.5xNi4xZrO3 nanocrystals.
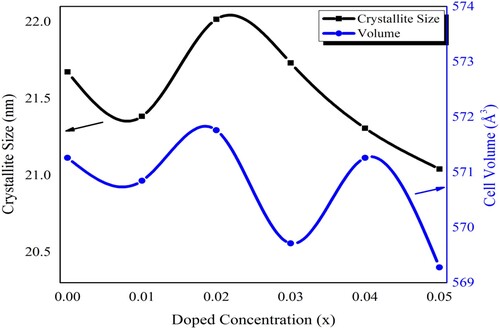
The several physical parameters such as crystallite size, cell volume, lattice parameters (a, b and c), X-ray and bulk densities, and the porosity of Pb1−4.75xNd0.5xNi4xZrO3 nanocrystalline samples were measured by using the XRD results and are given in Table .
Table 1. Physical parameters of Pb1−4.75xNd0.5xNi4xZrO3 nanocrystals determined from XRD data.
The size of nanocrystals (Dm) was calculated by using Debye Scherrer’s formula and given as [Citation29–31]:
(1)
(1) In this equation, the “λ” represented the wavelength of X-ray and in the present study, its value is equal to 1.54 Å, “K” is called a constant and contains a value of about 0.9, “β” represents the full width at half maxima (FWHM) and angle “θ” revealed the Bragg’s angle for selected peak. The measured lattice constant values demonstrated a nonlinear behaviour due to Nd3+ and Ni2+ inclusion in lead zirconate (PbZrO3) and given as in Table . Moreover, “ρx” the X-ray density was also calculated by applying an equation given below:
(2)
(2) In this equation, the “Z” represents the constant factor and it has the value of 8 for the structure of an orthorhombic body-centered crystal, “NA” represents the Avogadro’s number (6.02 × 10²³), the “M” indicates the molecular weight of each composition and “Vcell” indicates the crystal cell’s volume. The cell volume was determined by the following equation:
(3)
(3) Here a, b, and c are represented as lattice constants.
Bulk density (ρm) was also measured with the help of the following given relation:
(4)
(4) Here in this relation, “m” represents the mass, “h” indicates the thickness and “r” represents the radius of the circular pellet. In addition, the porosity was calculated through the following relation:
(5)
(5) In this relation, ρx and ρm are the X-ray and the bulk densities, respectively [Citation31–35].
The lattice constants a, b & c were calculated with the average values of 5.8948, 11.6730, and 8.2937 (Å), respectively. These values showed a nonlinear behaviour with the increased value of dopant concentrations [Citation36]. The zoom view of highly intense peak 122 from Figure has also depicted the nonlinear trend within the fine range of 2theta and the lattice parameters are dependent on such variation. The cell volume of the crystalline structure was calculated with an average value of 570.6918 Å3. The average measured crystallite size of samples was about 21 nm. It was observed that the size of nanocrystals initially increased and then decreased with the increase of dopant incorporation. Figure illustrated the relationship between crystallite size and cell volume with the dopant incorporation. The nonlinear trend in the lattice parameters and the size of crystals may be attributed to the conditions of reaction that favoured the synthesis of nanocrystals. Therefore, the efficient doping of neodymium Nd3+ and nickel Ni2+ in lead zirconate may provide an excellent means for the control of crystallite size. The size of the crystal is important and may affect various characteristics of the materials.
Figure 2. The variation in the crystallite size and crystal cell volume of Pb1−4.75xNd0.5xNi4xZrO3 nanocrystals with respect to doping concentration.
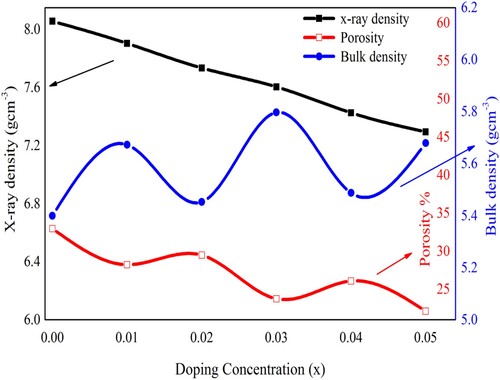
The porosity, the X-ray density and the bulk density were also calculated by using the XRD results and are given in Table . The X-ray density was found in the range of 7.2938–8.056 g cm−3. On the other hand, the bulk density of the prepared samples was measured in the range of 5.40–5.80 g cm−3. It was observed that the bulk density has a lower value as compared with the X-ray density and such lower values may be due to the inhibition of grain formation with the incorporation of the dopant in the perovskite structure. It may also be due to the presence of pores in such synthesized samples. The porosity measurement confirmed the presence of pores in these samples [Citation7,Citation37]. Figure represented the relationship of porosity, X-ray, and bulk densities with respect to doping content. The X-ray density has a decreasing trend, bulk density has an overall increasing behaviour, and finally, porosity has decreasing trend with the dopant incorporation in PbZrO3.
Figure 3. Variation in the X-ray density, bulk density, and porosity of Pb1−4.75xNd0.5xNi4xZrO3 nanocrystals with the doping contents.
3.2. Fourier transforms infrared spectroscopy (FTIR)
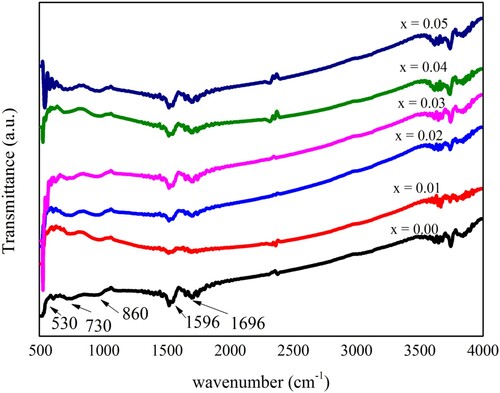
FTIR measurements of all prepared compositions of PbZrO3 nanocrystals were carried out in the range of 500–4000 cm−1 wavenumbers. These measurements were carried out at room temperature by Tensor 27 Bruker FTIR Spectrometer. Transmittance mode was used to record the spectra of all the samples. The obtained FTIR spectra are shown in Figure . Two major bands were identified at 1596 and 1696 cm−1. These bands revealed that Pb2+ ions have a direct link with the zirconium complex, which represents the effect on carboxyl. In the recorded spectra, the bands occurred at 750 cm−1 and between the ranges of 1500–1700 cm−1 represented the possible occurrence of lead nitrate and zirconium polymerization. The bands present in the spectra at about 530 and 860 cm−1 depicted the Zr–O bonds. These bands further confirmed the octahedral ZrO6 development [Citation38,Citation39]. The characteristic vibrations were observed at the band near 730 cm−1 in FTIR spectra. It may occur by the resonance phenomenon with the optic phonon modes that happened to sharper and narrower and shift somewhat to wave numbers at higher values. These FTIR results depicted that the network stiffening and the structural rearrangement in Ni2+ and Nd3+ ions substituted lead zirconate (PbZrO3) nanocrystals that represented the improvement and the development of the perovskite phase in the crystal structure [Citation40].
Figure 4. Fourier transforms infrared (FTIR) spectroscopy of pure and doped Pb14.75xNd0.5xNi4xZrO3 nanocrystals.
3.3. Scanning electron microscopy (SEM)
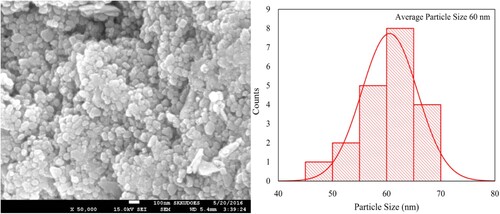
The morphology of Nd3+ and Ni2+ doped PbZrO3 nanocrystals that were annealed for 3 h at 700°C, was recorded through scanning electron microscopy. The typical SEM image of lead zirconate nanocrystals is depicted in Figure . The SEM indicated the relatively spherical nanoparticles of lead zirconate. Almost all particles have been found well rounded i.e. spherical. Further, no aggregation has been observed. From the scale bar of the SEM image, the particles size was estimated. This size was found in the range of 50–70 nm and the histogram of such particle size distribution was also depicted in Figure . This size of oxide-based materials has been found excellent for advanced technological applications.
Figure 5. SEM image and histogram of particle size distribution of Nd3+ and Ni2+ ions substituted Pb14.75xNd0.5xNi4xZrO3 nanocrystals synthesized by the micro-emulsion method.
3.4. Dielectric characteristics
The synthesized samples of Pb1−4.75xNd0.5xNi4xZrO3 nanocrystals were also subjected to measurements of dielectric characteristics. All the dielectric measurements were recorded at room temperature. The LCR meter (Wayneker (WK6500B)) was employed for these measurements. The measurements were recorded in the frequency range of 1 MHz–3 GHz. The frequency-dependent various dielectric parameters like the dielectric constant, the loss factor, the tangent loss, and the conductivity have been measured and depicted in Figures . The dielectric characteristics of the neodymium (Nd3+) and nickel (Ni2+) incorporated PbZrO3 nanocrystals might be dependent on the chemical composition, fabrication process, the crystallite size, and the cation’s distribution. At the lower frequency ranges, the figure depicted the higher value of dielectric constant, and such a high value may happen because of the existence of different kinds of polarizations like ionic, electronic, space charge, and orientation polarizations. Each polarization type has a particular frequency limit. When the frequency reached the higher range, the only electronic polarization existed. Therefore, the dielectric constant has decreased value for the higher frequency range. The observed results revealed that for the lower value of frequency, the dielectric constant has a higher value and it was due to the heterogeneity like grain structure, pores, impurities, etc exist in the synthesized samples [Citation41–44].
Figure 6. The dielectric constant of Pb1−4.75xNd0.5xNi4xZrO3 nanocrystals with respect to frequency.
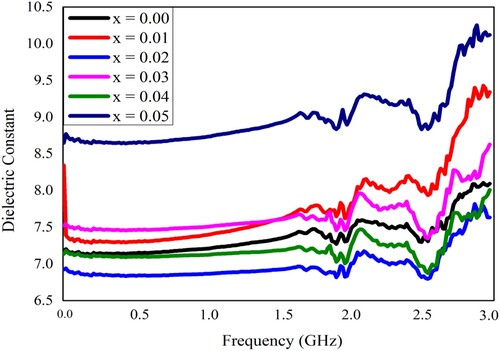
Figure 7. The frequency-dependent dielectric loss factor of Pb1−4.75xNd0.5xNi4xZrO3 nanocrystals.
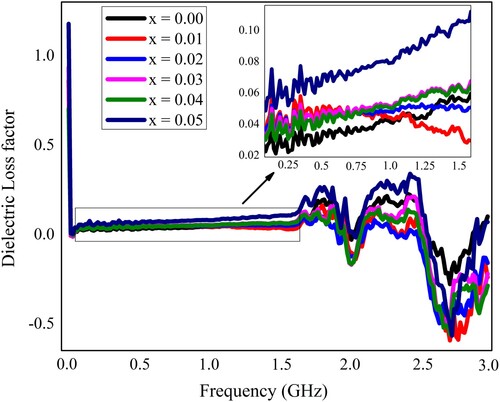
Figure 8. The frequency-dependent tangent loss of Pb1−4.75xNd0.5xNi4xZrO3 nanocrystals.
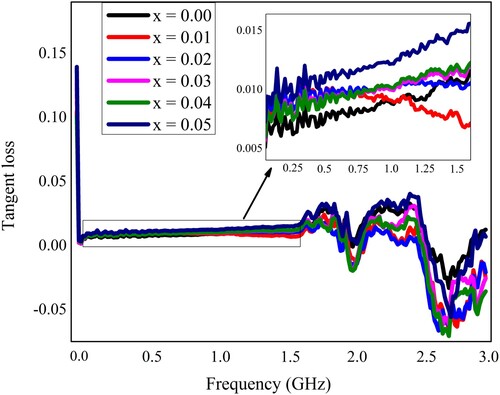
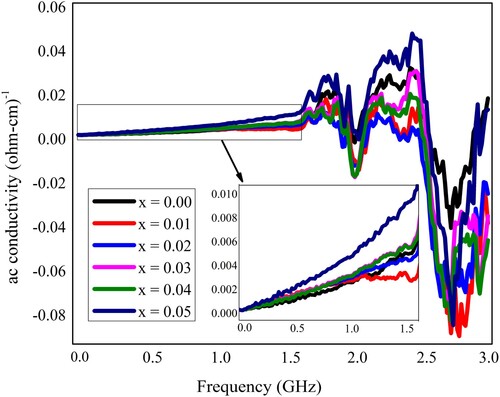
Figure 9. The frequency-dependent ac conductivity of Pb1−4.75xNd0.5xNi4xZrO3 nanocrystals.
Moreover, the dielectric constant is a quantification of the polarization within the prepared samples that depends upon the growth technique, the composition of the synthesized nanocrystals, and the crystal structure. It can be defined in other words as the stored quantity of the energy of electrostatic in a unit volume per unit potential gradient. The dielectric loss factor represents the energy loss by the movement of the charges when the polarization exchanges its direction within the electromagnetic field (alternating) and also the tangent loss is the value of energy that is lost within the dielectric materials [Citation45].
Different parameters have been observed from the measured results of Pb1−4.75xNd0.5xNi4xZrO3 nanocrystals by using the equations given as [Citation34,Citation46]:
(6)
(6) Here ε′, C,
, A, and d represent the dielectric constant, the capacitance, the permittivity of free space, the cross-sectional area, and the thickness of a pellet, respectively.
(7)
(7) where Rp, Cp, and f indicate the parallel equivalent resistance, the parallel equivalent capacitance, and the frequency, respectively.
(8)
(8) where ε″ represents the dielectric loss factor, ε′ indicates the dielectric constant and tanδ is the loss angle. At the frequency of 15 MHz, the measured range of the dielectric constant, the dielectric loss, and the tangent loss was given as 6.9390–8.77, 0.0028–0.0135, and 0.0021–0.0051, respectively. Moreover, ε′ is also represented as the real part of the dielectric constant and ε″ is known as the imaginary part of the dielectric constant, and such parameters can be used to calculate the absorbed energy due to the alternating field in the dielectric material [Citation47]. At some selected frequencies, the dielectric results were depicted in Table . Figure indicates that the dielectric constant for composition x = 0.05 is the highest and for x = 0.02 is the lowest. Such composition-dependent variation in the dielectric constant may be due to the variation in the surface area of the nanocrystals. The surface area might be increased by increasing the doping concentration, so the number of electric dipoles increases on the surface, as a result, the polarizability and hence the dielectric constant of the material increases [Citation28].
Table 2. Various dielectric parameters and ac conductivity for “Pb1−4.75xNd0.5xNi4xZrO3” nanocrystals at some selected frequencies.
The variation in frequency-dependent dielectric parameters might be associated with the Maxwell–Wagner interfacial model, which indicates that a dielectric medium is considered to be composed of double layers and good conducting particles, which are separated by resistive or poorly conducting grain boundaries. The charge carriers can migrate the grains and accumulated at the grain boundaries by applying the external electric field that might be attributed to the increased polarization and enhanced dielectric constant. The improved dielectric constant may also be elucidated on the basis of space charge or interfacial polarization due to the inhomogeneous dielectric structure. The linear behaviour of the dielectric parameters at the initial frequency range up to 1.5 GHz (Figures ) may be due to the inability of electric dipoles to follow up the fast variation of the alternating applied electric field [Citation28]. The nonlinear behaviour in the higher frequency region may be due to the resonance phenomenon. Two peaks at about 1.9 and 2.5 GHz were observed and identified as the resonance peaks. Such resonance peaks were appeared due to the matching of the vibrational frequency of charge carriers and the frequency of the applied field [Citation19].
The ac conductivity (σac) regarding neodymium and nickel incorporated PbZrO3 nanomaterials was calculated by using the above results and depicted in Figure . The observed value of ac conductivity was measured through the given relation as [Citation35,Citation48]
(9)
(9) Here f is the frequency,
indicates the permittivity of free space and ε″ is the dielectric loss. The frequency-dependent ac conductivity of the fabricated material has been observed by the electrical characteristics. Overall, the decreasing trend in the dielectric parameters was observed due to Nd3+ and Ni2+ dopants incorporation in PbZrO3 nanocrystals. The process of conduction in the material samples might be effectuated by the universal power-law presented by Jonscher [Citation49]. Such law tells us that σac = σdc + A·ωn, here “A” indicates a constant of thermal activation which finds out the value of polarizability and superscript “n” reveals the interaction’s level within lattices and mobile ions. If n is less than 1, then it reveals a translational motion due to the mechanism of sudden hopping, and if n is greater than 1 then it denotes a localized hopping beyond the exiting of the species from local surroundings. The hopping frequency (ωp) is the frequency where the change takes place in the curve’s slope [Citation50]. The frequency-dependent variation in the ac conductivity (σac) is shown in Figure . The ac conductivity has a decreasing trend with the incorporation of dopant material (Nd3+ and Ni2+ ions) in PbZrO3 nanocrystals as represented in Figure .
Figure 10. The ac conductivity of Pb1−4.75xNd0.5xNi4xZrO3 nanocrystals with respect to doping concentration.
The measured value of ac conductivity at 15 MHz frequency has the range of 1.2 × 10⁻⁵–0.25 × 10⁻⁵ (Ω-cm)−1. Under the limit of solubility, the impurities can create oxygen sites or A-site vacancies in PbZrO3 (lead zirconate) nanomaterials that was depending upon the size occupied by the impurity ions. When a vacancy is created from the A-site then such vacancy behaves like the donor, contributes to the electrons in the phenomenon of conduction, and decreases conductivity within the ceramic materials, due to the p-type electrical conduction in the un-doped ceramic materials. Conversely, the vacancy in the oxygen site behaves like the acceptor that contains holes for the process of conduction, therefore conductivity increases [Citation44]. As explained by Jonscher’s study, the frequency-dependent conductivity basis had been established in the relaxation phenomena, which happened because of the mobile charge carriers. Although, the mobile charge carrier hops to a new site, leaving the original position. It happened among the state of displacement, within a minima of the two potential energies [Citation49].
3.5. Electrical characteristics
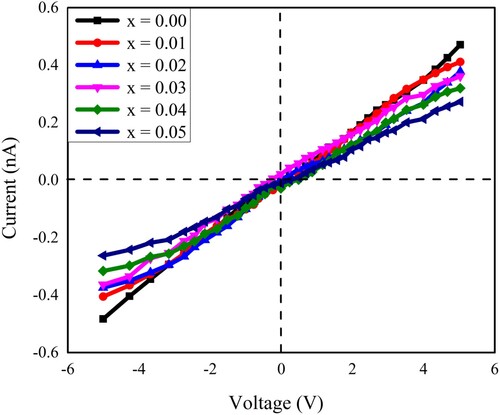
At room temperature, the dc electrical resistivity was measured by using the characteristics of current–voltage (I–V). These measurements were carried out via a 6487 Picoammeter/Voltage source (Keithley). A two-probe route was used to get the electrical response of pelletized samples. The current–voltage (I–V) response of the neodymium and nickel incorporated PbZrO3 nanocrystals revealed an ohmic trend. This ohmic trend is shown in Figure . The measurements have been recorded between the voltage ranges of −5 to +5 V. The resistance (R) of the prepared lead zirconate samples was calculated with the help of Ohm’s law and by using the slope of the I–V curve and measured between the ranges of 1.13 × 10¹⁰ and 1.93 × 10¹⁰ Ω. In the current study, the measured range of dc resistivity (ρdc) of all the compositions has been found between 2.6799 × 10¹⁰ and 4.8192 × 10¹⁰ Ω-cm. To measure the dc resistivity (ρdc), the following equation was used as given below [Citation51]:
(10)
(10) Here “R” shows the resistance, “ρdc” indicates the dc electrical resistivity, “
” represents the area of cross-section and “L” is the thickness of prepared pellets.
Figure 11. The current–voltage (I–V) characteristics of all the samples of Pb1−4.75xNd0.5xNi4xZrO3 nanocrystals.
The variation in the value of dc-resistivity concerned with doping concentration is given in Table . It was observed that the resistivity might be dependent upon the crystallite size, the structure of crystals, and the chemical composition [Citation52–54]. The results depicted that as the doping content increases, the electrical resistivity also increase and such variation is shown in Figure . Due to Nd3+ and Ni2+ metal ions incorporation in PbZrO3 nanocrystals, about a two-fold increase in the resistivity was observed. This suggested the utilization of prepared lead zirconate materials for the manufacturing of high-frequency devices. By comparing the dc electrical resistivity (ρdc) with the ac conductivity (σac), an inverse relation was observed between the electrical resistivity and the conductivity.
Figure 12. The variation in the dc-electrical resistivity of Pb1−4.75xNd0.5xNi4xZrO3 nanocrystals due to doping concentration.
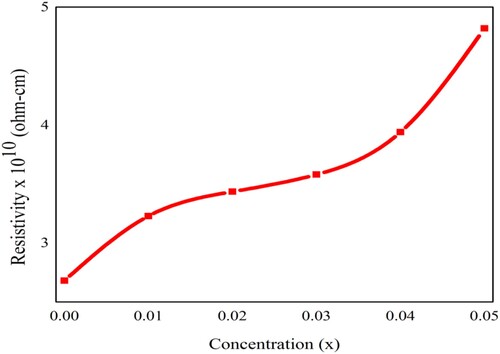
Table 3. Different values of the DC-electrical resistivity and other related results of lead zirconate Pb1−4.75xNd0.5xNi4xZrO3 nanocrystals due to different doping concentrations.
4. Conclusion
Nd3+ (neodymium) and Ni2+ (nickel) metal ions incorporated in lead zirconate Pb1−4.75xNd0.5xNi4xZrO3 nanocrystals have been successfully synthesized through a more economic and facile micro-emulsion growth route and finally annealed at 700°C for 3 h. With accurately controlling every parameter during the fabrication procedure, the shape and size of the synthesized nano-grains are highly refined. The X-ray diffraction study confirmed the development of a perovskite orthorhombic body-centered structure. The calculated average value of the size of nanocrystals was obtained as 21 nm. The lattice parameters and the size of nanocrystals have a decreasing trend with the incorporation of doping contents. The X-ray density, bulk density, and porosity of the synthesized samples were also determined. The single-phase perovskite orthorhombic structure was also verified through obtained FTIR spectral bands. SEM findings revealed the growth of nano-grains. The observed value of grain size was 50–70 nm. The dielectric parameters (the dielectric constant, the dielectric loss, and the tan loss) and ac conductivity generally have a decreasing trend but the dc electrical resistivity illustrated an increasing behaviour due to the doping contents in lead zirconate nanocrystals. The dc electrical resistivity was determined in the range between 2.680 × 10¹⁰ and 4.819 × 10¹⁰ Ω-cm. The obtained results from the electrical properties and the dielectric parameters suggested the possible utilization of these materials in the fabrication of advanced technological devices that are required to operate at high frequencies.
Disclosure statement
No potential conflict of interest was reported by the author(s).
Correction Statement
This article has been republished with minor changes. These changes do not impact the academic content of the article.
Additional information
Funding
References
- Li YZ, Wang ZJ, Bai Y, et al. High energy storage performance in Ca-doped PbZrO3 antiferroelectric films. J Eur Ceram Soc. 2020;40:1285–1292.
- Feng Y, Wei X, Wang D, et al. Dielectric behaviors of antiferroelectric–ferroelectric transition under electric field. Ceram Int. 2004;30:1389–1392.
- Chu B, Zhou Y, Zhang S. 10 – Charging and discharging characteristics of dielectric polymer materials. In: Dang Z-M, editor. Dielectric polymer materials for high-density energy storage. William Andrew, Beijing, China; 2018. p. 351–382.
- Anna Zielińska-Jurek JR, Grabowska E, Zaleska A. Nanoparticles preparation using microemulsion systems, microemulsions – an introduction to properties and applications. InTech; 2012.
- Ganguli AK, Ahmad T, Vaidya S, et al. Microemulsion route to the synthesis of nanoparticles. Pure Appl Chem. 2008;80(11):2451–2477.
- Thatikonda SK, Huang W, Du X, et al. Sm-doping induced large enhancement of antiferroelectric and energy storage performances of (111) oriented PbZrO3 thin films. Ceram Int. 2019;45:23586–23591.
- Shahzad MA, Shahid M, Bibi I, et al. The effect of rare earth Dy3+ ions on structural, dielectric and electrical behavior of new nanocrystalline PbZrO3 perovskites. Ceram Int. 2017;43:1073–1079.
- Bharadwaja SSN, Krupanidhi SB. Study of La-modified antiferroelectric PbZrO3 thin films. Thin Solid Films. 2003;423:88–96.
- Yao Y, Gallego M, Bassiri-Gharb N. Effects of Nb and Mg doping on the dielectric and electromechanical properties of PbZrO3 thin films. J Eur Ceram Soc. 2021;41:3363–3368.
- Charoonsuk P, Vittayakorn W, Muanghlua R, et al. Aqueous Co-precipitated spherical shape PbZrO3 nanopowders: perovskite phase formation. Ceram Int. 2013;39(Supplement 1):S107–S111.
- Chotsawat M, Sarasamak K, Thanomngam P, et al. First-principles study of Bi and Al in orthorhombic PbZrO3. Comput Mater Sci. 2016;115:99–103.
- Hemeda OM, Salem BI, Abdelfatah H, et al. Dielectric and ferroelectric properties of barium zirconate titanate ceramics prepared by ceramic method. Phys B. 2019;574:411680.
- Khirade PP, Raut AV, Alange RC, et al. Structural, electrical and dielectric investigations of cerium doped barium zirconate (BaZrO3) nano-ceramics produced via green synthesis: probable candidate for solid oxide fuel cells and microwave applications. Phys B. 2021;613:412948.
- Shahzad MA, Warsi MF, Khan MA, et al. New Nd-doped lead zirconate Pb1-1.5xNdxZrO3 nanocrystals: fabrication via wet chemical route for electrical and dielectric parameters evaluation. J Alloys Compd, 2015;647:693–698.
- Shannon RD. Revised effective ionic radii and systematic studies of interatomic distances in halides and chalcogenides. Acta Crystallogr A. 1976;32:751–767.
- Baig MM, Yousuf MA, Agboola PO, et al. Optimization of different wet chemical routes and phase evolution studies of MnFe2O4 nanoparticles. Ceram Int. 2019;45:12682–12690.
- Yousuf MA, Baig MM, Waseem M, et al. Low cost micro-emulsion route synthesis of Cr-substituted MnFe2O4 nanoparticles. Ceram Int. 2019;45:22316–22323.
- Malik MA, Wani MY, Hashim MA. Microemulsion method: a novel route to synthesize organic and inorganic nanomaterials: 1st nano update. Arab J Chem 2012;5:397–417.
- Junaid M, Khan MA, Hashmi ZM, et al. Structural, spectral, magnetic and dielectric properties of Bi substituted Li-Co spinel ferrites. J Mol Struct. 2020;1221:128859.
- Vaidya S, Ganguli AK. 2.01 – Microemulsion methods for synthesis of nanostructured materials. In: Andrews DL, Lipson RH, Nann T, editors. Comprehensive nanoscience and nanotechnology. 2nd ed. Oxford: Academic Press; 2019. p. 1–12.
- Khosa T, Faiz A, Hayder A, et al. Synthesis and characterization of newly synthesized neodymium zirconate zinc sulfide nanocomposite and its effect on selected aspects of albino mice behavior. Naunyn-Schmiedeb Arch Pharmacol. 2020;393:717–725.
- Sukkha U, Vittayakorn W, Muanghlua R, et al. Effect of A-site and B-site ion replaced with small ions on the intermediate phase in PbZrO3 ceramic. Mater Chem Phys. 2014;143:1517–1521.
- Vittayakorn N, Bongkarn T, Rujijanagul G. Phase transition, mechanical, dielectric and piezoelectric properties of perovskite (Pb1−xBax)ZrO3 ceramics. Phys B. 2007;387:415–420.
- Charoonsuk P, Vittayakorn N. Perovskite phase formation of monosized lead zirconate (PbZrO3) nanoparticles prepared by the sono-assisted Co-precipitation method. J Nanosci Nanotechnol. 2013;13:3529–3534.
- Deshpande AS, Khollam YB, Patil AJ, et al. Improved chemical route for quantitative precipitation of lead zirconyl oxalate (PZO) leading to lead zirconate (PZ) powders. Mater Lett. 2001;51:161–171.
- Moure C, Peña O. Recent advances in perovskites: processing and properties. Prog Solid State Chem. 2015;43:123–148.
- Sigwadi R, Mokrani T, Dhlamini M. The synthesis, characterization and electrochemical study of zirconia oxide nanoparticles for fuel cell application. Phys B. 2020;581:411842.
- Ahmad T, Ubaidullah M, Lone IH, et al. Microemulsion synthesis, structural characterization and dielectric properties of Ba1-xPbxZrO3 (0.05 ≤ x ≤ 0.20) nanoparticles. Mater Res Bull. 2017;89:185–192.
- Gilani ZA, Warsi MF, Anjum MN, et al. Structural and electromagnetic behavior evaluation of Nd-doped lithium–cobalt nanocrystals for recording media applications. J Alloys Compd. 2015;639:268–273.
- Malik H, Mahmood A, Mahmood K, et al. Influence of cobalt substitution on the magnetic properties of zinc nanocrystals synthesized via micro-emulsion route. Ceram Int. 2014;40:9439–9444.
- Javed H, Iqbal F, Agboola PO, et al. Structural, electrical and magnetic parameters evaluation of nanocrystalline rare earth Nd3+-substituted nickel-zinc spinel ferrite particles. Ceram Int. 2019;45:11125–11130.
- Lodhi MY, Mahmood K, Mahmood A, et al. New Mg0.5CoxZn0.5−xFe2O4 nano-ferrites: structural elucidation and electromagnetic behavior evaluation. Curr Appl Phys. 2014;14:716–720.
- Rafiq MA, Khan MA, Asghar M, et al. Influence of Co2+ on structural and electromagnetic properties of Mg–Zn nanocrystals synthesized via co-precipitation route. Ceram Int. 2015;41:10501–10505.
- Kousar T, Ahmad I, Khan MA, et al. Structural, electrical, dielectric and magnetic behavior of Gd1−xBixFe1−yZryO3 nanoparticles for advanced technological applications. Ceram Int. 2015;41:8578–8583.
- Gilani ZA, Warsi MF, Khan MA, et al. Impacts of neodymium on structural, spectral and dielectric properties of LiNi0.5Fe2O4 nanocrystalline ferrites fabricated via micro-emulsion technique. Physica E. 2015;73:169–174.
- Liu H. Universal dielectric relaxation induced giant dielectric permittivity in Mn-doped PbZrO3 ceramics. Ceram Int. 2019;45:10380–10384.
- Shahzad MA, Warsi MF, Khan MA, et al. New Nd-doped lead zirconate Pb1−1.5xNdxZrO3 nanocrystals: fabrication via wet chemical route for electrical and dielectric parameters evaluation. J Alloys Compd. 2015;647:693–698.
- Nunes JMA, Espinosa JWM, Gurgel MFC, et al. Photoluminescent properties of lead zirconate powders obtained by the polymeric precursor method. Ceram Int. 2012;38:4593–4599.
- Wang Y, Santiago-Avilés JJ. Synthesis of lead zirconate titanate nanofibres and the Fourier-transform infrared characterization of their metallo-organic decomposition process. Nanotechnology. 2004;15:32.
- Fernández-Osorio AL, Vázquez-Olmos A, Mata-Zamora E, et al. Preparation of free-standing Pb(Zr0.52Ti0.48)O3 nanoparticles by sol–gel method. J Sol-Gel Sci Technol. 2007;42:145–149.
- Dipti, Juneja JK, Singh S, et al. Study on structural, dielectric, ferroelectric and piezoelectric properties of Ba doped lead zirconate titanate ceramics. Phys B. 2013;431:109–114.
- Azhar Khan M, Sabir M, Mahmood A, et al. High frequency dielectric response and magnetic studies of Zn1−xTbxFe2O4 nanocrystalline ferrites synthesized via micro-emulsion technique. J Magn Magn Mater. 2014;360:188–192.
- Basu T, Sen S, Seal A, et al. Temperature dependent electrical properties of PZT wafer. J Electron Mater. 2016;45:2252 –2257.
- Panigrahi SC, Das PR, Parida BN, et al. Dielectric and electrical properties of gadolinium-modified lead-zirconate-titanate system. J Alloys Compd. 2014;604:73–82.
- Yousuf MA, Hussain S, Kousar T, et al. The impact of pH on structural and electrical properties of Er-substituted ZnFe2O4 nanoparticles synthesized via wet chemical route. J Supercond Novel Magn. 2021;42:1823–1831.
- Shah AA, Ahmad S, Azam A. Investigation of structural, optical, dielectric and magnetic properties of LaNiO3 and LaNi1−xMxO3 (M = Fe, Cr & Co; x = 5%) nanoparticles. J Magn Magn Mater. 2020;494:165812.
- Ali R, Khan MA, Mahmood A, et al. Structural, magnetic and dielectric behavior of Mg1−xCaxNiyFe2−yO4 nano-ferrites synthesized by the micro-emulsion method. Ceram Int. 2014;40:3841–3846.
- Anwar Z. Investigation of dielectric behavior of new Tb3+ doped BiFeO3 nanocrystals synthesized via micro-emulsion route. J Ovonic Res. 2014;10:265–273.
- Jonscher AK. The ‘universal’ dielectric response. Nature. 1977;267:673–679.
- Parashar SKS, Choudhary RNP, Murty BS. Electrical properties of Gd-doped PZT nanoceramic synthesized by high-energy ball milling. Mater Sci Eng B. 2004;110:58–63.
- Yousuf MA, Jabeen S, Shahi MN, et al. Magnetic and electrical properties of yttrium substituted manganese ferrite nanoparticles prepared via micro-emulsion route. Results Phys. 2020;16:102973.
- Balke N, Granzow T, Rödel J. Current-voltage characteristics for lead zirconate titanate bulk ceramics. J Appl Phys. 2008;104:054120.
- Kumar H, Singh JP, Srivastava R, et al. FTIR and electrical study of dysprosium doped cobalt ferrite nanoparticles. J Nanosci. 2014;4:10.
- Hassan A, Azhar Khan M, Shahid M, et al. Nanocrystalline Zn1−xCo0.5xNi0.5xFe2O4 ferrites: fabrication via co-precipitation route with enhanced magnetic and electrical properties. J Magn Magn Mater. 2015;393:56–61.