
Abstract
Rivers and reservoirs around the world are becoming dumping sites for liquid and solid wastes which are toxic to the fish. The physicochemical parameters and ecotoxicological potential of fish species in Ilorin's major rivers and reservoirs were investigated. Water and fish samples were collected from five sites: Unilorin Reservoir (A), Apodu Reservoir (B), Asa Reservoir (C), Asa River (Harmony) (D), and Asa River (Unity) (E). Excluding rivers (D and E) with low dissolved oxygen (DO) and a slight increase in lead (Pb), all physicochemical parameters were within the NSDWQ and WHO criteria for drinking water. Fish samples at D and E showed changes in the serum biochemical and haematological profiles and induction of micronuclei (MN), nuclear abnormalities (NA) and DNA single-strand break. Antioxidant enzymes were also increased in the fish. Our findings show that water from D and E can cause cytogenotoxic in fish due to hypoxic conditions triggered by Pb. This study will provide valuable health risks and future river water treatment strategies.
1. Introduction
Water is a universal solvent that can dissolve a wide range of compounds to varying degrees. It is a priceless resource since it provides vital support to all organisms (plants and animals). In addition to being used for drinking and cooking, water is also used in the home, on the farm, and in the industrial sector. However, the majority of waste generated as a result of its uses is dumped into bodies of water without any regard for its toxicity. In recent years, the amount of these wastes has risen dramatically worldwide, posing a major health risk to humans. Genetics alone cannot explain two-thirds of human long-term illness risk; it may be influenced by environmental factors or gene-environment interactions [Citation1]. Virus, bacterial, and parasitic diseases can all be spread through contaminated water. In aquatic and terrestrial animals, polluted water has been shown to cause neurological and respiratory disorders as well as kidney and liver damage, endocrine disruption, DNA damage and reproductive defects such as infertility in many studies. It can also weaken the immune system, reducing fertility, inducing developmental defects and even increasing the risk of some cancers [Citation2–7] Effects of plant grown and/or aquatic organisms residing in polluted rivers have been shown to bioaccumulate different pollutants present in the water in their tissues and transfer these through the food chain to animals [Citation8].
Reservoirs and rivers are valuable biological resources that serve a variety of human requirements, including water conservation, flood management, and hydroelectric power generation [Citation9]. Water conservation has become a challenge due to pollution. This could be due to the daily input of contaminants from home, agricultural, and/or industrial wastes which could harm fish [Citation10–13].
Fish are ecologically important and commercially valuable in Nigeria's and other countries’ fishing industries. For example, Clarias gariepinus (The African sharptooth catfish, which belongs to the Clariidae family of airbreathing catfishes) and Tilapia zillii (an African native fish species is one of the dominant cichlids in reservoirs of Nigeria) are regularly and widely grown in ponds, and they also exist naturally in Nigerian freshwater. As a result, changes in the aquatic environment, as well as physicochemical alterations, have a significant impact on fish physiology [Citation14]. Because fish absorb pollutants directly from contaminated water, their physiological stress responses are extremely comparable to those of mammals [Citation13,Citation15]. With the ability to digest and store toxins in water in their numerous organs, fish have also been shown to be an excellent organism for evaluating the hazardous potential of contaminants [Citation16]. They also respond quickly to low concentrations of toxicants, and their responses are similar to those of vertebrates. As fish have antioxidant enzymes that are similar to those found in vertebrates and are utilized to counteract the detrimental effects of reactive oxygen species (ROS) [Citation17,Citation18].
There are various factors that influence water quality, but most past studies on the subject have focused on heavy metals. These factors such as Biochemical Oxygen Demand (BOD), Chemical Oxygen Demand (COD), Dissolved Oxygen (DO), precipitation, climate, soil type, vegetation, geology, flow conditions, groundwater, and human activities, all have an impact on water quality. Variations in BOD, COD and DO in rivers, as well as the harmful consequences they may have on aquatic life, are underreported, particularly in Nigeria. BOD is the quantity of oxygen taken up by microorganisms living on organic compounds present in the sample (e.g. water or sludge) when incubated at a specific temperature (typically 20°C) for a set period of time (usually 5 days, BOD5) [Citation19]. It acts as an indicator of water pollution since it offers information about the readily biodegradable percentage of the organic load in the water. If BOD5 is greater than 5 mg/L, the water is considered contaminated. The amount of oxygen equivalent to the organic matter in a water sample is referred to as COD. It is a common metric for determining the susceptibility of organic and inorganic components in municipal, agricultural, and/or industrial wastes to oxidation. Higher COD values indicate that there is more oxidizable organic material in the sample, lowering DO levels. Anaerobic conditions can result from a decrease in DO, which is harmful to higher aquatic life forms. Hypoxia in water bodies has been shown to enhance ROS production and block the intracellular antioxidant system in aquatic animals, leading to physiological abnormalities and mortality [Citation20]. Thus, because of the ability of fish to react to changes in dissolved oxygen levels when BOD and COD increase and their inclination to accumulate metals in their muscles [Citation21], fish have been used as a biological indicator of water quality [Citation22]. Alteration in water quality parameters could cause changes in physiological, biochemical, and genetic factors in the body of aquatic organisms [Citation23], which have not been fully elucidated in most Nigerian water bodies.
In Nigeria, Asa, Oyun, and Apodu reservoirs, as well as associated water bodies, support a diverse range of fish species especially T. zillii and C. gariepinus (which are abundance/common) and provide the majority of water consumed in Ilorin city, University of Ilorin community, and Malete town in Kwara state [Citation9, Citation24–26]. Fresh fish and fish items were also provided to the public via its resources. Industrial, agricultural, and domestic waste discharge and practices, on the other hand, are carried out along the river's bank. These discharges pollute the water and have a negative impact on the recipient environment's biological equilibrium [Citation12,Citation13, Citation27–29]. Most studies on the water bodies are always on their quality, there is a limited study on the toxicity impact posed by the polluted water in these regions.
The purpose of this study is to provide current information on the genotoxic status of major water bodies in Kwara State, Nigeria, by investigating the physicochemical parameters of the waterbodies, oxidative stress, and antioxidant response in selected fish species, and assessing the level of genotoxic damage induced in selected fish (T. zillii and C. gariepinus) collected from five different water bodies. Fish such as T. zillii and C. gariepinus is a suitable bioindicators to monitor water quality. The build-up of pollutants in these fish may affect their physiological processes due to their ability to generate ROS/free radicals that could result in DNA damage [Citation23]. We observed that river water samples, in particular, triggered the generation of reactive oxygen species (ROS), altering the haematological profiles and inducing micronuclei (MN), nuclear abnormalities (NA), and DNA single-strand breaks in T. zillii and/or C. gariepinus in this study.
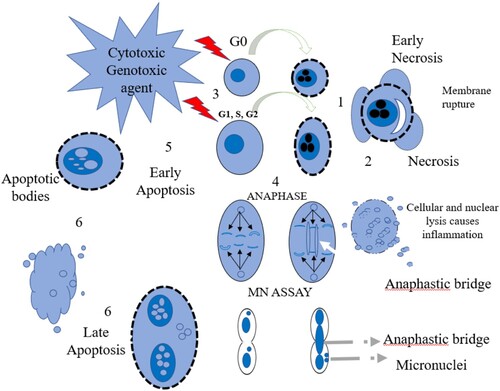
This research is essential for freshwater pollution prevention as well as maintaining and increasing freshwater health [Citation30,Citation31]. As shown in Figure , when chromosomal breakage or chromosome loss occurs during anaphase damage, the micronucleus (MN) assay can be used to identify micronuclei [Citation32,Citation33]. In order to analyse cells’ genotoxic response to complicated combinations of environmental pollutants, the frequency of MN can be used. To complement the MN assay, the comet assay is routinely used in a wide range of fish species and cell types for in situ genotoxicity assessments in freshwater environments [Citation32,Citation34]. Breakage of DNA strands is a highly sensitive sign of exposure to a wide range of genotoxic substances that may alter DNA in a number of different ways [Citation35]. An important technique for detecting strand breakage in aquatic species is the single-cell gel electrophoresis (SCGE) or comet assay. This is the primary test in environmental biomonitoring investigations [Citation36]. There are several advantages to using a comet assay, including the ability to detect early and nonspecific DNA damage in tissues, the ability to detect genotoxic damage at the single-cell level, and compatibility for most eukaryotic cell types [Citation37]. The comet assay's greatest advantage is in detecting initial and/or acute DNA damage to target tissues without clinical signs of toxicity and helping to comprehend the significance of genotoxic pollution's influence on biota in local communities around it [Citation34, Citation38]. This current study could potentially aid in assessing and identifying the ecotoxicological risk posed by pollutants present in these water bodies.
Figure 1. Mechanism of micronucleus (MN) assay.
2. Materials and methods
2.1 Study location
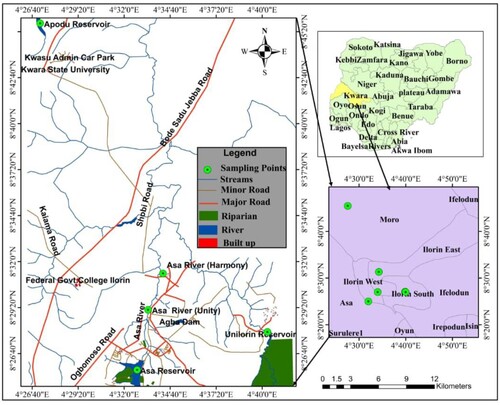
We collected water and fish from five different locations in this study, including Unilorin reservoir (A), Apodu reservoir (B), Asa reservoir (C), Asa river (Unity) (D), and Asa river (Harmony) (E), as shown in Figure .
Figure 2. Map of the Study Area showing the Sampling points (Green circle).
2.1.1 University of Ilorin reservoir (A)
The University of Ilorin reservoir is located in the western portion of Central Nigeria, bounded by longitudes 4o 40'52” to 4o 41'0"E and latitudes 8o 27'5” to 8o 28'5"N in the Ilorin south local government of Kwara state. It was founded in 1975, and the physical construction of the structures began in 1979. Between 2015 and 2016, it was restored to a depth of around 5 m and a submerged area of roughly 650 km2. The dam's principal aim is to provide water to the university villages for drinking and irrigation. Because no industry is located along its path, the water rarely receives waste. Due to the result of the physicochemical parameters, this site was used as our control site.
2.1.2 Apodu reservoir (B)
Apodu reservoir is located in Apodu hamlet, some 7 kilometres from Malete Town in Kwara State's Moro local government region. The dam was built in 1980, and the re-impoundment was completed in 2016. It is located between longitudes 8°45'25.9” N and 45'27.7” N, and latitudes 4°27'41.4”E and 4°27'35.5”E, with a length of 560 metres and a width of 400 metres, and a depth of 8.2 metres, with a surface area of around 15 hectares. It has two seasons: a dry season during which the water flow rate declines and a rainy season during which the water flow rate remains constant. It is located in Nigeria's Guinea Savannah region. The reservoir's principal purpose is to supply water for drinking and agriculture to the surrounding villages [Citation12,Citation25,Citation39].
2.1.3 Asa reservoir (C)
The Asa reservoir is located 5 kilometres south of Ilorin, across the Asa River, between latitudes 8o25’ and 8o 27'N and longitudes 4o32’ and 4o34'E. The reservoir was built between May 1975 and January 1977 with the goal of addressing the ever-increasing need for drinking water, agriculture, and a source of revenue through commercial fishing for the rapidly growing population of Ilorin, the state capital of Kwara state. The rivers Iwonte, Jia, and Segbekuke are the main tributaries. With a maximum length of 20 kilometres, a breadth of 7 kilometres, and a depth of 13 metres, the reservoir is unusually huge and wide, with a storage capacity of around 43 million cubic metres [Citation24].
2.1.4 Asa River (Unity) (D)
With coordinates of 8°28'0"−8°31” N and 4°32'0"−4°34” E, the Asa river is one of the major rivers in Ilorin, Kwara state. The river is home to a number of businesses, including Dangote, Coca-Cola, pharmaceutical, and detergent industries. Near the river, there are a few small agricultural enterprises such as Ugwu and cassava plantations. The dumping of garbage, sewage disposal, and indiscriminate discharge of effluents/chemicals into the river's body is frequent, making the water appear unsafe for drinking and household purposes [Citation40].
2.1.5 Asa River (Harmony) (E)
It is a river segment with coordinates of 8°30'0"−8°32” N and 4°33'0"−4°34” E along the Asa River. It is located in Ilorin's Harmony Estate, with very little garbage entering the waterbody. Effluents from multiple industries within the estate, as well as home (sewage) wastes and agricultural waste run-offs along the river's bank, are all contained in this river.
2.2 Experimental design
The physicochemical parameters such as the temperature, pH, electrical conductivity, dissolved oxygen (DO), total dissolved solids (TDS), total suspended solids (TSS), biochemical oxygen demand (BOD), chemical oxygen demand (COD), and heavy metals were all measured in water samples taken from reservoirs (A, B and C) and rivers (D and E). A Hanna portable waterproof tester, model HI 98129, was used to measure water parameters while Atomic Absorption Spectrophotometer (AAS) (model: Buck scientific ACCUS-IS 211) was used to determine the heavy metals. Winkler’s method was used to determine the DO.
In the early hours of the day, two separate fish species, T. zillii and C. gariepinus, were collected from the five sites: A, B, C, D and E between 6:00-8:30 am in the period of March (dry season). They were caught with cast nets, gill nets, and baskets by fishermen. The fish were sorted and identified at the species level using the methods of Idodo-Umeh [Citation41] as well as the assistance of a fish taxonomist. The two most common fish species captured at the various sites were T. zillii and C. gariepinus; however, T. zillii species were in large number and were used primarily in our experiment. The sampled fish were taken to the Department of Zoology, University of Ilorin, Ilorin, Nigeria, in transparent 50L plastic aquaria with a net cover (to enable ventilation and prevent the fish from jumping out). Before the blood was collected through the tail area or by caudal vein puncture for analysis, the fish were allowed to recuperate from stress. To avoid any trace of chemicals, the fish were anaesthetized on ice that covered the entire body for 10-15 min and immediately removed and placed the tail in a water bath (30°C) prior to blood collection. Our investigations used two separate fish species (both T. zillii and C. gariepinus) (n = 5 per site) for each analysis. This was repeated three times (triplicate). This study was carried out following strictly the guidelines on the care and use of laboratory animals of the Ethical Committee of the University of Ilorin, Ilorin, Nigeria.
2.3 Oxidative stress, haematological analyses and and antioxidant enzymes activities
To carry out the oxidative stress analysis, blood was drawn from T. zillii (n = 5) from each site and stored in EDTA bottles prior to analysis, with the methodology of Reitman and Frankel (1957) being modified. For haematological analysis, blood was analysed using the methods outlined by Svobodova et al [Citation42] and Sovio, and Oikari [Citation43]. Blood samples were collected from the fish from each site for analysis, including red blood cell (RBC) profiles, white blood cell (WBC) profiles, and platelet profiles.
The activity of glutathione S-transferase (GST) was measured using 1 chloro 2, 4 dinitrobenzenes as a substrate [Citation44]. Using an extinction coefficient of 9.6mM-1cm-1, the specific activity of glutathione S-transferase was expressed as nmoles of GSH-CDNB conjugate formed/min/mg protein. Clairborne [Citation45] reported a catalase activity (CAT) assay based on the breakdown of H2O2, in which the absorbance was measured at 240 nm (pH 7.0, 28°C) and expressed as unit/mg protein. The activity of superoxide dismutase (SOD) was measured spectrophotometrically at 420 nm and expressed as a unit/mg protein using the Misra [Citation46] method, which relies on the autooxidation of adrenalin due to the presence of superoxide anion. The assay for glutathione peroxidase was performed using Paglia and Valentine [Citation47] technique. To a combination containing 0.2 mL of buffer, 0.2 mL of EDTA, and 0.1 mL of sodium azide, around 0.2 mL of tissue homogenate was added. After good mixing, 0.1 mL reduced glutathione and 0.1 mL hydrogen peroxide were added, and the mixture was incubated for 10 min in a water bath at 37°C. After the incubation period, 0.5 mL of 10% TCA was added and centrifuged for 5 min at 10,000 rpm. In a separate test tube, 1.0 mL of the supernatant was added to 2.0 mL Tris buffer and 50 µl DTNB. The OD was measured at 412 nm right away. While the activity of glutathione reductase (GR, EC 1.6.4.2) was measured according to Glatzle et al. [Citation48].
2.4 DNA damage analysis
This was performed using micronucleus (MN) and comet assays. Blood was collected from the caudal region of the two fish species (T. zillii and C. gariepinus) [n = 5 per site] using a 2 mL syringe and needle. The needle was placed ventrally into the caudal portion of the fish's body until it pricked the vertebral column, then moved out a little to allow blood to flow into the syringe. For the MN assay, a drop of blood was immediately placed on a clean, grease-free microscope slide to form a thin blood smear after the dispenser drew around 0.5 ml of blood. In a dust-free environment, the smeared slides were allowed to air-dry overnight. The air-dried slides were fixated in 70% absolute methanol for 20 min before being air-dried overnight. The slide was then stained with 10% Maygrunwald, cleaned with distilled water, and air-dried overnight after drying. After that, the glass slide was stained with 5% Giemsa, rinsed with distilled water, and dried. Under a light microscope, the dried slide was scored by counting a total of 2000 erythrocytes, which were then analysed with oil immersion at 1000X magnification for micronucleus (MN) and nuclear abnormalities (NA) as cytogenotoxicity biomarkers [Citation49,Citation50].
For Comet assay, the first/base layer was generated by coating totally frosted slides with 1% normal-melting-point-agarose overnight. The second layer consisted of 75 µl of 0.7% low-melting-point agarose (LMA) and 25 µl of lymphocyte suspension. The slides were immediately covered with coverslips and refrigerated on ice for 10 min to harden the agarose. The coverslips were removed, and the third layer of 90 µl of 0.5% LMA was applied, followed by the coverslips being reinstalled and the agarose being allowed to harden for 10 min over ice. Triplicates of each sample were taken. For 2��h at 4°C, the slides were submerged in a cold alkaline lysis solution. The slides were then refrigerated in a horizontal electrophoresis tank pre-filled with cold alkaline electrophoresis buffer for 20 min at room temperature to loosen the tight double-helical structure of DNA for electrophoresis. The electrophoresis was then carried out in an electrophoresis buffer at 4°C for 20 min at 25 V, 300 mA. After electrophoresis, a drop-by-drop application of Tris buffer (0.4 M Tris, pH 7.5) was used to neutralize excess alkali; the buffer was left on the slides for 5 min. This process of neutralization was carried out three times. After that, the slides were stained for 10 min with 80 µl propidium iodide (2 µg/ml). To avoid further DNA damage, all of the preceding operations were carried out in the dark [Citation51]. A Nikon 90i fluorescence microscope was used to view the comets, and a digital imaging system was used to gather photographs of 100 comets for each concentration. Overlapping cells were not counted. Comet Assay Software Project (CASP, Wroclaw University, Poland) was used to examine all of the comet images, and the tail length (TL), per cent tail DNA (% TDNA), and Olive tail moment (OTM) were recorded to describe DNA damage to lymphoma cells.
2.6 Statistical analysis
The micronucleus abnormalities and differences between the test groups were assessed using the SPSS software package version 21.0 (SPSS 21.0) and/or Graph-pad prism (version 5.0). The differences were compared using one-way ANOVA, and the Duncan multiple range test (DMRT) was used to evaluate the degree of statistical significance at p < 0.05. The mean and standard error were calculated.
3. Results
3.1 The water samples’ physicochemical properties demonstrate a drop in DO and an increase in Pb when compared to the permitted limit in drinking water
Except for DO, which was very low in the two rivers (D and E), all of the physicochemical parameters and heavy metals (Mn, Cu, Ni, N, P, Fe, Cl, and Ca) evaluated in the five separate water bodies were within the NSDWQ and WHO permitted levels (Table ). When compared to the limit set by the two organizations, all five locations saw a modest rise in Pb (mg/L) (Table ).
Table 1. Physiochemical parameters and metals of the water samples.
3.2 Biochemical and tissue lesions studies of Tilapia zillii fish show elevated ALT, AST, ALP, and albumin levels
Table shows that the serum ALT, AST, ALP, and albumin enzyme activity of T. zillii in the E site were significantly higher (p < 0.05) than in the other four sites (A-D). In comparison to the reservoirs (A-C), the AST enzyme activity of fish in the D and E sites is higher. Similarly, the ALT of fish in B and E sites show higher activity when compared to other sites.
Table 2. Oxidative enzyme activities induced in Tilapia zillii across the five sampling sites represented as mean ± standard error of mean (SEM)
3.3 Rbc, WBC, and PLT levels have increased in the haematological study in Tilapia zillii
Table shows the mean value of haematological parameters along with the standard deviation. Table shows that RBC (red blood cell), HGB (haemoglobin), MCV (mean corpuscular volume), and MCH (mean corpuscular haemoglobin) in T. zillii from E sites are significantly higher (p < 0.05) than in other sampling sites. MCH and MCHC (mean corpuscular haemoglobin concentration) levels of fish at the D site also increased significantly. The changes in HCT (haematocrit) and RDW (red blood cell distribution width) between the 5 sites were insignificant. There was no significant difference (p > 0.05) between the 5 sites in WBC profiles; LYM (lymphocyte), MID (mid-sized cells), and GRAN (granulocyte). When compared to other species, T. zillii at the E site has a considerable rise in GRAN (Table ). PLT (platelet), MPV (mean platelet volume), PDW (platelet distribution width), PLCR (platelet larger cell ratio), and PCT (plateletcrit) measurements across the five sites indicate no significant variation (p < 0.05). However, PLT and PDW in T. zillii at the D site and PLT and PLCR at the E site increased significantly (Table ).
Table 3. Red blood cell differential parameters in Tilapia zillii across 5 sampling sites.
Table 4. White blood cell differential parameters in Tilapia zillii across the 5 sampling sites.
Table 5. Platelets count in Tilapia zillii across 5 sampling sites.
3.4 The release of antioxidants indicates that the cells are under oxidative stress in Tilapia zillii.
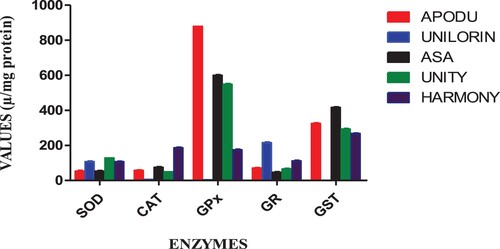
The order of antioxidant enzyme reactions in T. zillii blood was statistically different (p<0.05) across the five sampling sites; SOD responses were highest in the fish at the E site, followed by A, D, C and lowest at B (E>A>D>C>B). CAT responses were significantly highest in fish from the E site, followed by D, A, C, and least significant in B (E>D>A>C>B). GPx responses were greatly induced in fish from the C site, followed by B, E, D, and lowest in A (C>B>E>D>A). GR responses significantly increased in fish from the A site, followed by C, D, E and B (A>C>D>E>B). GST responses were highest in B, followed by C, E, D, and A (B<C>E>D>A) (Table ; Figure ).
Table 6. Antioxidant enzyme activities induced in Tilapia zillii across the five sampling sites represented as mean ± standard error of mean (SEM).
Figure 3. Antioxidant enzyme activities induced in Tilapia zillii across the five sampling sites.
3.5 Water samples from the rivers induced DNA damage in both Tilapia zillii and Clarias gariepinus
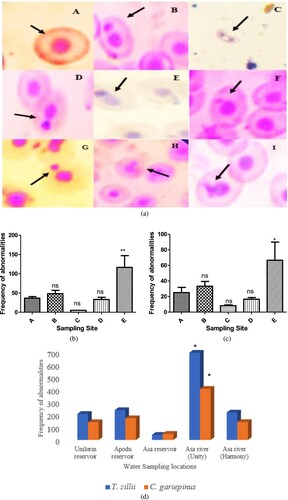
An increase in micronuclei (MN), nuclear abnormalities (NA), and DNA single-strand break are all signs that the fish are suffering from DNA damage. The peripheral blood erythrocytes of two fish species (T. zillii and C. gariepinus) obtained at various locations demonstrate induction of micronuclei (MN) and other nuclear abnormalities (NA), such as binucleated (BN), nuclear bud (NB), notched (N), lobed (L), and blebbed (BLB). With each of the two fish species obtained, site comparisons were made (E > D ≥ C ≥ A > B) indicating that the two rivers (E and D) showed the highest frequency of MN and NA compared to the reservoirs (C, A and B) (Figure (a)). The frequencies of abnormalities per fish are shown in the supplementary information (Supplementary Figure S1-S2) while the level of significance is presented in supplementary Table (S1-S2). In this investigation, it was discovered that T. zillii had a significantly increased (**p < 0.01 and *p < 0.05) in MN/NA than C. gariepinus (Figure (b-d)).
Figure 4. (a) Various micronuclei and nuclear abnormalities observed in both fish species. Normal nucleus, (B and C) Binucleated, (D) Nuclear bud, (E) Notched, (F and G) Micronucleus, (H) Lobed, (I) Blebbed. Mag.x1000. (b) Frequency of abnormalities observed in Tilapia zillii. (c) Frequency of abnormalities observed in Clarias gariepinus. (d) Micronuclei induction and nuclear abnormalities observed in different species of fish present at the various sites per 2000 cells. (*p < 0.05).
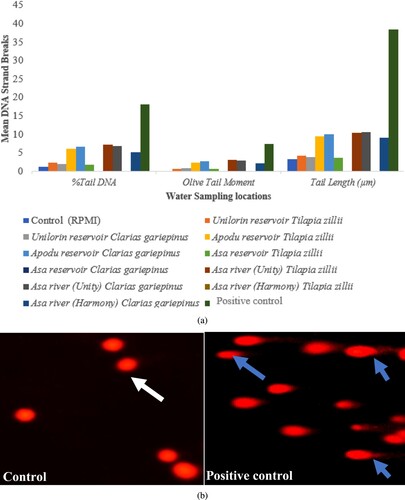
As illustrated in Figure (a and b), the level of DNA damage detected in the peripheral lymphocytes of fish collected at various places was assessed using the alkaline comet assay with parameters such as per cent tail DNA, olive tail moment, and tail length. The blood cells of fish obtained from the Asa river Unity (E) had the highest degree of DNA single-strand break. In fish collected at A and B, there was no significant variation in the level of DNA single-strand break. When comparing the two fish species, the DNA damage reported in T. zillii is higher than in C. gariepinus. In comparison to the selected reservoirs, DNA damage was found to be higher in fish species taken from river sites (Asa rivers Harmony (D) and Unity (E)). It was observed that at the reservoir sites, there is an elevation in the level of DNA damage in Apodu reservoir (C). The order of DNA damage across the 5 sites: Asa river unity > Apodu��> Asa river harmony > Unilorin > Asa reservoir (E > C>D > A>B).
Figure 5. (a) Mean DNA strand breaks in Clarias gariepinus and Tilapia zillii induced by the sampling water. Positive control (H2O2). (b) Cellular DNA damage. Negative control shows the normal shape of a nucleus without a comet tail (white arrow). Positive control shows the abnormal shape of a nucleus with a comet tail (blue arrow).
4. Discussion
The Tilapia fish sampled from five distinct sites; Unilorin reservoir (A), Asa reservoir (B), Apodu reservoir (C), Asa river (Harmony) (D) and Asa river (Unity) (E) in Ilorin, North Central Nigeria, show induction of oxidative stress which resulted in cellular and DNA damages in the study. The Nigerian Standard for Drinking Water Quality (NSDWQ) is the legally recognized standard for drinking water quality in Nigeria. This specifies the allowed values (which must not be exceeded) for certain water parameters before it may be regarded safe to drink [Citation52]. Because of the indiscriminate discharge of domestic, agricultural, and industrial wastes into water bodies, most rivers and reservoirs around the world are polluted. These wastes are hazardous, and they have the potential to change the ecosystem and genetic makeup of aquatic organisms. The physicochemical characteristics in the rivers (D and E) show a low level of DO and a slight increase in BOD, indicating a hypoxic condition of the rivers and a slight nitrate content due to runoff from agricultural fields in the vicinity that utilize pesticides and fertilizers for farming. If BOD5 is greater than 5 mg/L, the water is considered contaminated. Increased Pb, low DO levels in the rivers, and a modest increase in BOD and COD values obtained from the E site could be due to industrial effluents, home wastes, and runoff from some agricultural operations along the river's edge. This is due to de-oxygenation brought on by the discharge of industrial effluents into the water body. Because DO determines the distribution of animals and flora, It has been recognized as the most essential parameter for measuring water quality [Citation53]. Local streams in Uyo, Akwa-Ibom state, have also been found to be polluted by home sewage and waste, resulting in low DO and high nitrate levels [Citation54].
The enzymes ALP, AST, and ALT are produced in the liver, and their presence in the blood signifies liver damage. A significant level of oxidative stress enzymes observed in Tilapia fish at the E site indicates fish liver inflammation and oxidative stress which could be linked to a minor rise in conductivity, BOD, COD, and a decline in DO that could have put the fish under undue stress. This is consistent with the findings of Oshode et al. [Citation55], who found significant levels of AST in examined fish samples as a result of water pollution.
Blood is a tissue that reacts to changes in our surroundings. It consists of RBCs, WBCs, PLTs, and plasma. They are useful bioindicators for determining water quality [Citation56–59]. Changes in haematological parameters can be caused by contaminated water. In comparison to other sampling locations, we found a significant increase (p < 0.05) in RBC, HGB, MCV, MCH, GRAN, PLT, and PLCR in T. zillii from Asa river (Unity). MCH, MCHC, PLT, and PDW levels in Tilapia fish at Asa river Harmony were likewise significantly higher. This finding is consistent with that of Sahiti et al. [Citation60], who found slight alterations in HGB, MCHC, and WBC levels, as well as significant changes in RBC, MCV, and MCH in blood of common carp (Cyprinus carpio) in two lakes in Kosovo. This disparity in RBCs could be related to the rivers’ low DO levels at D and E sites and a slight increase in Pb. Blood parameters such as MCV, MCH and MCHC are important in diagnosing animal anaemia [Citation61]. The increasing values of these indicators appear in the case of various anaemia. Our result is in line with a study from Vergolyas et al. [Citation62] who showed water samples from the Desna and Dnieper rivers indicated a change in blood formula and an increase in the number of cells with nuclear abnormalities in fish.
Changes in water quality parameters have been linked to the activation of the antioxidant defence system in fish and other aquatic organisms living there, which may further elevate antioxidant responses in these organisms in the presence of environmental pollutants from agricultural, domestic, and industrial sources, as well as landfill leachates, resulting in the production of reactive oxygen species (ROS) [Citation63,Citation64]. Although oxidative stress and antioxidant responses have been used as biomarkers to assess the genotoxic potential of rivers in Nigeria such as the Ogun, Eleyele, and Asejiri rivers [Citation65–67], little is known about the oxidative stress and antioxidant responses of fish in major reservoirs and rivers in Kwara state. When there is an imbalance in the level of reactive oxygen species (ROS) and antioxidants in fish, the antioxidant defence system is triggered, and this defence is swiftly activated to checkmate oxidative stress that may be generated by elevated levels of pro-oxidants in the fish [Citation68]. The initial line of defence against oxidative stress is usually SOD and CAT, and their activities are easily evident as an increase in enzyme activity [Citation65]. Antioxidants may be reduced in cells as a result of exposure to environmental contaminants, but antioxidant levels may rise to compensate for the oxidative stress imbalance [Citation69,Citation70]. Increased SOD activities in T. zillii fish at D and E could be a reaction to oxidative stress produced by low oxygen levels (low DO and a slight increase in Pb), which could lead to hypoxia. Reduced oxygen levels may have triggered the generation of superoxide anions (the most damaging free radicals), which were catalytically scavenged by SOD and converted to H2O2, a defence readily adopted by the fish's antioxidant enzyme to limit oxygen toxicity. The findings in the SOD activities at D, E and A sites are consistent with the findings of Farombi et al. [Citation65], Isamah et al. [Citation70], that linked higher SOD concentrations in fish to oxidative stress.
In fish exposed to contaminants, CAT is a key enzyme that works on H2O2. CAT, along with SOD, is normally the first line of defence in fish exposed to pollutants, and while CAT levels increase in fish exposed to pollutants, its levels have been found to decrease in contaminated water bodies, as reported by Farombi et al. [Citation65]. Tilapia fish at the A site (reservoir) and E site (river) had lower CAT levels than those at the D site, but the CAT values at the B and C sites were not statistically different. Increased generation of ROS is slowly beginning to overpower the CAT defence, which could suggest that the fish is under oxidative stress. The CAT level findings are consistent with those of Arojojoye et al. [Citation66], who found that an increase in ROS generation is associated with lower catalase activity and other antioxidant enzymes. Increased CAT activity in T. zillii at the D site is a common response to environmental contaminants, as CAT and SOD are the first lines of defence against oxidative stress. The blood of representative fish species from the C site had the greatest GPx levels, followed by the B and E sites. GPx activity was reduced in T. zillii fish from the D site, with the lowest values found at the A site. Increased GPx levels show that this enzyme has a preventive and adaptive role against oxidative stress caused by heavy metals or organic contaminants. The increased GPx level backs up the findings of Lenartova et al. [Citation71], who discovered that fish GPx activity was 1.8-fold greater in contaminated rivers. The lower GPx level could suggest a low amount of pollution at the A site and a circumstance where the D site is self-purifying. In order to maintain the GSH/GSSG ratio, GR catalytically reduces oxidized glutathione. GR and GPx operate together because an increased level of GR may indicate oxidative stress, which may necessitate an increase in GPx to offset the stress impact [Citation72]. The highest GR values were found in the blood of representative fish (T. zillii) from the A site, followed by D, C, E, and B sites with the lowest GR values. Increased GR may indicate oxidative stress in fish, which is consistent with the findings of Pandey et al. [Citation73], who found increased GR in fish exposed to higher levels of pollution. GST levels were found to be lower in the blood of T. zillii at A, D, E and C sites and higher at the B site. The decrease can be linked to an increase in ROS production, and antioxidant levels in cells may be depleted in cells during exposure to environmental contaminants [Citation70].
Next, the degree of DNA damage was then evaluated using two separate tests in two different fish species (T. zillii and C. gariepinus). When compared to C. gariepinus, the micronucleus test, which is a reliable and sensitive assay that is commonly used as a diagnostic of DNA damage, revealed induction of micronuclei and other nuclear abnormalities in T. zillii at all five sites. Our findings contradict those of Ali et al. [Citation74], who found that the peripheral blood of C. gariepinus was particularly sensitive to the formation of MN when compared to T. zillii, which was sensitive to the production of MN as compared to two other tilapia species; Oreochromis niloticus, and Oreochromis aureus. In another study, Labeo rohita was the most sensitive to DNA damage and micronucleus formation, followed by Cirrhinus molitorella, red tilapia, and Oreochromis niloticus [Citation75].
Thus, this could be due to the fact that T. zillii has accumulated various metals in its body systems, such as Pb, and it also shows that its genome can withstand cytogenetic damage without apoptosis in our study. The findings support Kligerman [Citation76] report that fish living in contaminated waters, such as the E site in our study, have higher micronuclei frequencies. MN frequencies can change depending on the season, stress, pollutant type, and heavy metals [Citation77,Citation78].
The comet assay has been used to evaluate the impact of genotoxic contaminants on DNA integrity with great success. It has several advantages as a tool for genotoxic studies, including the ability to detect genotoxic damage at the single-cell level, suitability for most eukaryotic cell types; only a small number of cells are needed, faster and more sensitive than other available methods for detecting strand breaks, low cost, and the ability to detect early genotoxic exposure-response [Citation78,Citation79]. Because comets might be observed with the same length but varying fluorescence intensities, the percentage tail DNA (per cent tail DNA) is the parameter of choice for DNA damage assessment [Citation80]. The (% tail DNA) in the five sites in descending order; E > C>D > A>B, indicating that the reservoir with the highest and lowest DNA damage at the E and B sites respectively.
The Asa river (upstream), which has extended its path towards the Unity area (mid-stream) and Harmony area (downstream), exhibits a striking pattern. When compared to its courses, the Asa river (upstream) has the least DNA damage (Unity and Harmony rivers). Low DNA damage in the upstream and high DNA damage in the midstream could be linked to the amount of genotoxic chemical exposure. When a pollution gradient exists along the river, the rising amount of genotoxicity in C. gariepinus and T. zillii peripheral erythrocytes is directly linked to the level of pollutants. The trend observed on the Asa water course agrees with Hariri et al. [Citation78], who found that DNA damage was highest in the mid-stream (Asara) of the Karai river due to a high influx of pollutants from sewage and industries, and DNA damage was lowest in the upstream (Varangerud) due to low pollution levels.
According to Anifowoshe et al. [Citation12], the increase (per cent tail DNA and tail length) observed in Apodu reservoir compared to the negative control can be attributed to a slight increase in Pb and nitrate pollution due to sewage disposal and runoff from nearby farms that use pesticides and fertilisers for their farming activities. Exposure to pollutants from diverse sources can have additive, synergistic, or antagonistic interactions with fish [Citation31]. DNA damage can accumulate through an increase in the number of DNA-damaging events or a decrease in DNA repair [Citation31,Citation81]. The Apodu reservoir's results are consistent with those of Kushwaha et al. [Citation11] who found a considerably higher degree of DNA damage in Channa punctatus and Mystus vittatus erythrocytes exposed to contaminated water from the Gomti river in India when compared to baseline values. When compared to the negative control, the A site shows a low percentage of tail DNA. This is likely due to the fact that it is utilized for leisure activities and the reservoir is not close to residential areas, thus it receives little or no domestic garbage. The only conceivable source of contamination would be runoff during the rainy season or from the reservoir's water channel.
In most of the sampling sites, the results from the combined use of comet test and antioxidant responses to determine genotoxic potential were in accord, but in a few, they differed. Both the comet assay and antioxidant enzyme reactions indicated that the Unity and Harmony rivers were contaminated. This is comparable to the findings of Nwani et al. [Citation82], who found that the comet assay and antioxidant enzyme responses matched. The Apodu and Unilorin reservoirs have a little difference. Although DNA damage is slight in the Unilorin reservoir, antioxidant responses were inconsistent, which could imply that the reservoir is likely exposed to minute contaminants that induce these reactions. The antioxidant responses of the Apodu reservoir, which has substantial DNA damage, are mild. This is because, according to some studies, the comet assay is a more sensitive test than the antioxidant response because it can identify toxins at low doses [Citation31]. As a result, combining the comet assay with antioxidant enzyme responses allows for a more complete picture of a water body's genotoxic condition. Sources of lead (Pb) compounds are found in nature when Pb is mixed with two or more additional elements. Anthropogenic sources include mining and smelting, soldering, battery production, ammunition, metal water pipes, paint, and fuel. Oxidative stress (OS) is a known mechanism for lead poisoning, and lead has been shown to cause OS via the formation of reactive oxygen species (ROS). ROS overpowers the antioxidant system, allowing oxidized molecules to enter the cell [Citation83]. Tests on animal models have shown that continuous exposure to Pb damages the kidneys and increases the risk of cancer (inorganic lead has been found to be carcinogenic to humans—Group 2A) via increasing DNA strand breaks (genotoxicity) [Citation84]. Thus, an increase in DNA strand breaks as observed in this study in the two rivers may be attributed to the presence of Pb. Pb molecular toxicity is well-understood and occurs at blood levels as low as 5 micrograms per deciliter [Citation85]. The implications of these findings in our present study are that, because the fish are stressed as a result of increased ROS, this could affect their physiology and result in mortality. As a result, in the future, we will determine the current ichthyofauna diversity of rivers/reservoirs and compare it to previous reports to see if pollutants are causing a decline in fish populations, as well as evaluate how pollutants like Pb enter water bodies, their hosts, and possible developmental defects they may cause over time. However, the seasonal influx of contaminants could be one of this study's limitations.
5. Conclusions and recommendations
Using various tests and antioxidant enzyme reactions, the cytogenotoxic potential and antioxidant response of five water bodies were studied. The water bodies surveyed were found to be currently polluted, and if anthropogenic activity on these water bodies continues unabated, the ecology and biotic life may deteriorate more quickly than self-purification can repair. It is strongly advised that the government enact legislation to prohibit indiscriminate dumping of rubbish into water bodies, educate the public about the consequences of such activities, and warn people about the dangers of eating infected fish; otherwise, what goes around comes around. Therefore, in order to understand the overall quality of the rivers that have been sampled, future monitoring programmes should be improved and more analyses, including heavy metals and microplastic contamination, should be considered.
Abbreviations
Ast: Aspartate aminotransferase, ALT: Alanine transaminase, ALP: Alkaline phosphatase ALB: Albumin, WBC: White Blood Cell RBC: Red Blood Cell, PLT: Platelet, SOD: Superoxide dismutase, CAT: Catalase GPx: Glutathione peroxidases, GR: Glutathione reductase GST: Glutathione S-transferase DO: Dissolved oxygen, NSDWQ: Nigerian Standard for Drinking Water Quality WHO: World Health Organization, MN: Micronuclei NA: Nuclear abnormalities.
Declarations
No funding is available.
There are no conflicts of interest.
Animal Research (Ethics)
Experimental animals were cared for and used in accordance with the guidelines on the care and use of laboratory animals of the Ethical Committee of the University of Ilorin, Ilorin, Nigeria.
Participant Consent (Ethics)
Not applicable
Consent to Publish (Ethics)
This does not apply.
Plant Reproducibility
This isn't the case.
AAT and OSO designed the study; AAT, OSO, OAN, OA, OEO, AO, and AYM gathered, stored, and analysed materials in the lab. Technical assistance was provided by AKM, ASI, and IOA for the study. AAT and OSO wrote the first draft of the manuscript, which was then reviewed and edited extensively by AKM, ASI, and IOA. The final manuscript was read and approved by all authors.
Supplemental Material
Download MS Word (66.6 KB)Data Availability
The corresponding author can provide data sets generated and/or analysed during the study upon request.
Disclosure statement
No potential conflict of interest was reported by the author(s).
References
- Rappaport SM, Smith MT. Environment and disease risks. Science. 2010;330:460–461.
- Anifowoshe AT, Roy D, Dutta S, et al. Evaluation of cytogenotoxic potential and embryotoxicity of KRS-cauvery river water in zebrafish (danio rerio). Ecotoxicol Environ Saf. 2022;233:113320.
- Shuliakevich A, Muz M, Oehlmann J, et al. Assessing the genotoxic potential of freshwater sediments after extensive rain events – lessons learned from a case study in an effluent-dominated river in Germany. Water Res 2022;209:117921.
- Escher BI, Stapleton HM, Schymanski EL. Tracking complex mixtures of chemicals in our changing environment. Science. 2020;367:388–392.
- Chandra V, Pandav R. Neurological disorders. In: Jamison DT, Breman JG, Measham AR, Alleyne G, Claeson M, Evans DB, Jha P, Mills A, Musgrove P, editor. Disease Control Priorities in Developing Countries, 2nd edition. Oxford University Press and The World Bank; 2006. p. 627–645.
- Gaziano T, Reddy KS, Paccaud F, et al. Cardiovascular disease. In: Jamison DT, Breman JG, Measham AR, Alleyne G, Claeson M, Evans DB, Jha P, Mills A, Musgrove P, editor. Disease Control Priorities in Developing Countries, 2nd edition. Oxford University Press and The World Bank; 2006. p. 645–663.
- La Rosa G, Bonadonna L, Lucentini L, et al. Coronavirus in water environments: occurrence, persistence and concentration methods - A scoping review. Water Res. 2020;179:115899.
- Hemachandra CK, Pathiratne A. Cytogenotoxicity screening of source water, wastewater and treated water of drinking water treatment plants using two in vivo test systems: Allium cepa root based and Nile tilapia erythrocyte based tests. Water Res. 2017;108(180):320–329.
- Mustapha MK. Fish fauna of oyun reservoir, offa. Nigeria. J Aquat Sci. 2010;25(1):106–114.
- Sevensson B, Nilsson A, Jonsson E, et al. Fish consumption and exposure to persistent organochlorine compounds, mecury, selenium and methylamines the assessment of aquatic pollution. J Environ Res Develop. 1995;8(2):371–375.
- Kushwaha B, Pandey S, Sharma S, Srivastava R, Kumar R, et al. In situ assessment of genotoxic and mutagenic potential of polluted river water in channa punctatus and mystus vittatus. Int. Aquat. Res. 2012;4:16.
- Anifowoshe AT, Oladipo SO, Owolodun OA, et al. Ecogenotoxicological assessments of some selected fish species from Apodu reservoir, malete, North central. Nigeria. Manila J Sci. 2018;11:1–14.
- Anifowoshe AT, Oladipo SO, Adebayo MO, et al. Induction of micronuclei, base-pair substitution mutation and excision-repair deficient by polluted water from Asa river in Nigeria. AST. 2019;4(2):68–77.
- Musa SO, Omoregie E. Haematological changes in the mud fish, Clarias gariepinus (burchell) exposed to malachite green. J Aquat Sci. 1999;14:37–42.
- Mishra R, Shukla SP. Endosulfan effects on muscle malate dehydrogenase of the freshwater catfish Clarias batrachus. Ecotoxicol Environ Saf. 2003;56:425–433.
- Al-Sabti K. Handbook on genotoxic effects and fish chromosome. Jamova: Jozef Stefan Institute; 1991; 583.
- Almeida JA, Novelli ELB, Dal PSM, et al. Environmental cadmium exposure and metabolic responses of the Nile tilapia, Oreochromis niloticus. Environ Pollut. 2001;114:169–175.
- Klobucar GIV, Stambuk A, Mirjana P, et al. Genotoxicity monitoring of freshwater environments using caged carp (cyprinus carpio). Ecotoxicology. 2010;19:77–84.
- Jouanneau S, Recoules L, Durand MJ, et al. Methods for assessing biochemical oxygen demand (BOD): A review. Water Res. 2014;49:62–82.
- Pollock MS, Clarke LMJ, Dubé MG. The effects of hypoxia on fishes: from ecological relevance to physiological effects. Environ Rev. 2007;15:1–14.
- Zhao C, Feng W, Quan X, et al. Role of living environments in the accumulation characteristics of heavy metals in fishes and crabs in the Yangtze river estuary, china. Mar Pollut Bull. 2012;64:1163–1171.
- Al-Ghanim S, Mahboob S, Seemab S, Sultana T, Sultana, F., et al. Monitoring of trace metals in tissues of wallago attu (lanchi) from the Indus river as an indicator of environmental pollution. Saudi J Biol Sci, 2016;23:72–78.
- Javed M, Usmani N. An overview of the adverse effects of heavy metal contamination on fish health. Proc Natl Acad Sci, India, Sect B Biol Sci. 2019;89:389–403.
- Omotosho JS. Ichthyofauna diversity of Asa reservoir, Ilorin. Nigeria. Biosci Biotech. Res. Comm. 1998;10(1):75–81.
- Oladipo SO, Mustapha MK, Suleiman LK, et al. Fish composition and diversity assessment of Apodu reservoir, malete. Nigeria. IJFAS. 2018;6(2):89–93.
- Araoye PA. Physical factors and their influence on fish species composition in Asa lake, ilorin. Nigeria Rev. Biol. Trop. Int. J. Trop. Biol. 2009;57(1-2):167–175.
- Anifowoshe AT, Oyebanji JB, Oladipo OS, Oyeyemi FB, Abdulrahim MY, et al. Histological changes, micronuclei induction and nuclear abnormalities in the peripheral erythrocytes of Clarias gariepinus (burchell 1822) exposed to water sample from Apodu reservoir, Journal of Life and Bio Sciences Research. 2020;1(1):01-07.
- Oladipo SO, Adeniyi T, Anifowoshe AT. Histological and hepatic enzymes response of Oreochromis niloticus and Clarias anguillaris to pollution in Asa river, ilorin. Journal of Life and Bio Sciences Research. 2020;1(1):16–21.
- Akinboro A, Peter NA, Rufai MA, et al. Evaluation of Asa river water in ilorin, Kwara state, Nigeria for available pollutants and their effects on mitosis and chromosomes morphology in allium cepa cells. J Appl Sci Environ Manage. 2021;25(1):119–125.
- Lacaze E, Geffard O, Bony S, et al. Genotoxicity assessment in the amphipod gammarus fossarum by use of the alkaline comet assay. Muta Res/Genet Toxicol Environ Mutagen. 2010;700:32–38.
- Osman AGM, Abuel-Fadl KF, Kloas W. In situ evaluation of the genotoxic potential of the river Nile: II. detection of DNA strand-breakage and apoptosis in Oreochromis niloticus niloticus (linnaeus, 1758) and Clarias gariepinus (burchell, 1822). Mutation Research/Genetic Toxicology and Environmental Mutagenesis. 2012;747:14–21.
- Bolognesi C, Hayashi M. Micronucleus assay in aquatic animals. Mutagenesis. 2011;26:205–213.
- Kim IY, Hyun CK. Comparative evaluation of the alkaline comet assay with the micronucleus test for genotoxicity monitoring using aquatic organisms. Ecotoxicol Environ Saf. 2006;64:288–297.
- Vasquez MZ. Combining the in vivo comet and micronucleus assays: a practical approach to genotoxicity testing and data interpretation. Mutagen. 2009;060.
- Mitchelmore C, Birmelin C, Livingstone D, et al. Polycyclic and nitroaromatic compounds produce DNA strand breakage in brown trout (salmo trutta) and mussel (mytilus edulis L.) cells. Mutagen. 1997;12:101.
- Russo C, Rocco L, Morescalchi MA, et al. Assessment of environmental stress by the micronucleus test and the comet assay on the genome of teleost populations from two natural environments. Ecotoxicol Environ Saf. 2004;57:168–174.
- Frenzilli G, Nigro M, Lyons B. The comet assay for the evaluation of genotoxic impact in aquatic environments. Mutat Res/Rev Mutat Res. 2009;681:80–92.
- Martins M, Costa PM. The comet assay in environmental risk assessment of marine pollutants: applications, assets and handicaps of surveying genotoxicity in non-model organisms. Mutagenesis. 2015;30:89–106.
- Oladipo SO, Sunday OJ, Ogunbiyi DC. Occurrence and prevalence of parasites associated with Gnathonemus senegalensis in Apodu reservoir, Malete, Nigeria. Sri Lankan Journal of Biology. 2019;4(1):14–23.
- Kolawole OA, Ajayi KT, Olayemi AB, et al. Assessment of water quality in Asa river (Nigeria) and its indigenous Clarias gariepinus fish. Int J Environ Res Public Health. 2011;8(11):4332–4352.
- Idodo-Umeh G. Freshwater fishes of Nigeria (taxonomy, ecological notes diet and utilization). Benin City, Nigeria: Idodo Umeh publishes limited; 2003; 112.
- Svobodova ZD, Pravda PJ. Unified methods of haematological examination of fish. Vodnany, Czech Republic: Research Institute of Fish Culture and Hydrobiology; 1991; 31.
- Sovio A, Oikari A. Haematological effect of stress on a teleost. Essex Lucius. J Fish Biol. 1976;8:397–411.
- Habig WH, Pabst MJ, Jacoby WB. Glutathione-S-transferases. The first enzymatic step in mercapturic acid formation. J Biol Chem. 1974;249:7130–7139.
- Claiborne L. Handbook of methods or oxygen radical research. Londan: CRC Press; 1985.
- Misra HP. The role of superoxide anion in the autoxidation of epinephrine and a simple assay for superoxide dismutase. J Biol Chem. 1972;247:3170–3175.
- Paglia DE, Valentine WN. Studies on the quantitative and qualitative characterization of erythrocyte glutathione peroxidase. J Lab Clin Med Thesis. 1967;70:158–169.
- Glatzle D, Vuilleumier JP, Weber F, et al. Glutathione reductase test with whole blood, a convenient procedure for the assessment of the riboflavin status in humans. Experientia. 1974;30:665–667.
- Carrasco KR, Tilbury KL, Myers MS. Assessment of the piscine micronucleus test as an in situ biological indicator of chemical contaminant effects. Can J Fish Aquat Sci. 1990;47:2123–2136.
- Ergene S, Cavas T, Celik A, et al. Evaluation of river water genotoxicity using the piscine micronucleus test. Environ Mol Mutagen. 2007;48:421–429.
- Bajpayee M, Dhawan A, Parmar D. Comet assay: a reliable tool for the assessment of DNA damage in different models. Cell Biol Toxicol. 2009;25:5–32.
- Ighalo JO, Adeniyi AG. A comprehensive review of water quality monitoring and assessment in Nigeria. Chemosphere; 127569.
- Morrison HA, Smokorowski KE. The applicability of various frameworks and models for assessing the effects of hydropeaking on the productivity of aquatic ecosystems. Can Tech Rep Fish Aquat Sci. 2000: 2322.
- Akpan AW. The water quality of some tropical freshwater bodies in Uyo (Nigeria) receiving municipal effluents. slaughter-house washings and agricultural land drainage. Environ. 2004;24:49–55.
- Oshode OA, Bakare AA, Adeogun AO, et al. Ecotoxocological assessment using Clarias gariepinus and microbial characterization of leachate from municipal solid waste landfill. Int J Environ Res Public Health. 2008;2(4):391–400.
- Kopp R, Lang Š, Brabec T, et al. The influence of physicochemical properties of water on plasma indices in brook trout (salvelinus fontinalis, mitchill) reared under conditions of intensive aquaculture. Acta Vet Brno. 2013;82:427–433.
- Khan AS, Zhou P, Liu X, et al. Response of vitamins A, E, hematological and serum biochemical markers in Crucian carp (Carassius auratus gibelio) exposed to environmental Pb2+ and Cd2+. Acta Biochim Pol. 2015;62:581–587.
- Parrino V, Cappello T, Costa G, et al. Comparative study of haematology of two teleost fish (Mugil cephalus and Carassius auratus) from different environments and feeding habits. Eur Zool J. 2018;85:193–199.
- Osman GMA, AbouelFadl YK, El Reheem ABMA, et al. Blood biomarkers in Nile tilapia Oreochromis niloticus and African catfish Clarias gariepinus to evaluate water quality of the river Nile. J Fish sci. 2018;12:001–015.
- Sahiti H, Bislimi K, Dalo E, et al. Effect of water quality in hematological and biochemical parameters in blood of common carp (cyprinus carpio) in two lakes of Kosovo. NESciences. 2018;3(3):323–332.
- Coles EH. Veterinary clinical pathology. W.B. Saunders, Philadelphia. 1986;10-42.
- Vergolyas M, Myrtaziev E, Vikhliaieva M, et al. Hematological indicators of hydrobionts as a biomarker of anthropogenic pollution of the aquatic environment. Int J Nat Resour Ecology Manage. 2020;5(3):115–118.
- Slaninova A, Smutna M, Modra H, et al. A review: oxidative stress in fish induced by pesticides. Neuroendocrinol Lett. 2009;30(1):2–12.
- Sevcikova M, Modra H, Slaninova A, et al. Metals as a cause of oxidative stress in fish: a review. Veterinární Medicína. 2011;56(11):537–546.
- Farombi EO, Adelowo OA, Ajimoko YR. Biomarkers of oxidative stress and heavy metal levels as indicators of environmental pollution in African Cat fish (Clarias gariepinus) from Nigeria ogun river. Int J Environ Res Public Health. 2007;4(2):158–165.
- Arojojoye OA, Adeosun AM. Effect of environmental pollution on oxidative stress biomarkers in African cat fish (Clarias gariepinus) from asejire river in Oyo,state. J Environ Occupat Sci. 2016a;5:4.
- Arojojoye OA, Nwaechefu OO, Ajiboye JA, et al. Induction of oxidative stress in Clarias gariepinus from eleyele river in Nigeria. Adv Environ Res. 2016;5(3):179–187.
- Livingstone DR. Contaminant-stimulated reactive oxygen species production and oxidative damage in aquatic organisms. Mar Pollut Bull. 2001;42:656–666.
- McCord JM. Effects of positive iron status at a cellular level. Nutr Rev. 1996;54:85–88.
- Isamah GK, Asagba SO, Coker HA. Comparative evaluation of the levels of some antioxidant enzymes and lipid peroxidation in different fish species in Two rivers in the western Niger delta. Bull Environ Contam Toxicol. 2000;65:351–356.
- Lenartova V, Holovska K, Pedrajas JR, et al. Antioxidant and detoxifying fish enzymes biomarkers of river pollution. Vet J. 1997;147:18–30.
- Akpakpan EI, Akpanyung EO. Biomarkers of oxidative stress and histopathological studies in fish from ibaka and ifiayong rivers, akwa ibom state, Nigeria. World Appl Sci J. 2014;32(7):1209–1218.
- Pandey S, Parvez S, Ahamd Ansari R, et al. Effects of exposure to multiple trace metals on biochemical, histological and ultrastructural features of gills of a freshwater fish, channa punctata bloch. Chem Biol Interact. 2008;174(3):183–192.
- Ali FK, El-Shehawi AM, Seehy MA. Micronucleus test in fish genome: A sensitive monitor for aquatic pollution. AfrJ Biotech. 2008;7(5):606–612.
- Xian H, Tang M, Chen Y, et al. Indigenous fish–based assessment of genotoxic potentials of the helong reservoir in guangzhou, China. Env Toxicol Chem. 2021: 1–9.
- Kligerman AD. Fishes as biological detectors of the effects of genotoxic agents. In: J Heddle, editor. Mutagenicity: New horizons in genetic toxicology. New York: Academic Press; 1982. p. 435–456.
- Dhawan A, Bajpayee M, Parmar D. Comet assay: a reliable tool for the assessment of DNA damage in different models. Cell Biol Toxicol. 2009;25(1):5–32.
- Hariri M, Mirvaghefib A, Farahmandb H, et al. In situ assessment of karaj river genotoxic impact with the alkaline comet assay and micronucleus test, on feral brown trout ( salmo trutta fario ) Environ Toxicol Pharmacol 2018;58:59–69.
- Frenzilli G, Nigro M, Lyons B. The comet assay for the evaluation of genotoxic impact in aquatic environments. Mutation Research/Reviews in Mutation Research. 2009;681:80–92.
- Schnurstein A, Braunbeck T. Tail moment versus tail length—application of an In vitro version of the comet assay in biomonitoring for genotoxicity in native surface waters using primary hepatocytes and gill cells from zebrafish (danio rerio). Ecotoxicol Environ Saf. 2001;49:187–196.
- Cavas T, Konen S. Detection of cytogenetic and DNA damage in peripheral erythrocytes of goldfish (carassius auratus) exposed to a glyphosate formulation using the micronucleus test and the comet assay. Mutagenesis. 2007;22:263–268.
- Nwani CD, Nagpure NS, Kumar R, et al. DNA damage and oxidative stress modulatory effects of glyphosate-based herbicide in freshwater fish, channa punctatus. Environ Toxicol Pharmacol. 2013;36:539–547.
- Lopes AC, Peixe TS, Mesas AE, et al. Lead exposure and oxidative stress: A systematic review. Rev Environ Contam Toxicol. 2016;236:193–238.
- IARC Working Group on the Evaluation of Carcinogenic Risks to Humans. Inorganic and organic lead compounds. IARC Monogr Eval Carcinog Risks Hum 2006;87:1.
- Tamele IJ, Loureiro PV Lead, mercury and cadmium in fish and shellfish from the Indian ocean and Red Sea (African countries): Public health challenges. J Mar Sci Eng. 2020;8:344.