
 ?Mathematical formulae have been encoded as MathML and are displayed in this HTML version using MathJax in order to improve their display. Uncheck the box to turn MathJax off. This feature requires Javascript. Click on a formula to zoom.
Abstract
Pneumoconiosis is a systemic disease mainly caused by diffuse fibrosis (scar) of lung tissue due to long-term inhalation of productive mineral dust in occupational activities and retention in the lungs. The mineral dust concentrration can be effectively controlled using water-based mineral dust reduction technique. Therefore, the investigation into water-clay mineral dust interaction is useful for pneumoconiosis prevention and treatment. In this study, the adsorption performances for water molecules in kaolinite clay mineral were investigated. The findings reveal that the performances of water molecules adsorption in kaolinite clay mineral can be divided into primary adsorption and secondary adsorption. Under the lower vapour pressure, water molecules are primarily fixed in primary sites. At the higher vapour pressure condition, the secondary adsorption sites become the utilizable main adsorption centers. Primary adsorption is monolayer adsorption, while water molecules adsorption in secondary adsorption centers is occurred by the formation of water clusters.
1. Introduction
With the sustained development of the global economy, the demand for mineral resources is increasing. During the industrial mining process, a larger amount of mineral dust appears in the air, especially in the working face. The generated mineral dust can enter the human body through the respiratory tract. The smaller mineral dust has the longer time to float in the air and the greater possibility of diffusion into the deep part of the respiratory tract. Meanwhile, the mineral dust with smaller particles is easy to deposit in the alveolar tissue, which is the most pathogenic. Accordingly, the mineral dust has brought adverse effect on human health, and the number of people with respiratory diseases such as pneumoconiosis is gradually enhancing. At present, the most effective treatment method for mineral dust is water-based dust reduction technique. By spraying water molecules into the air, the suspension of mineral dust can be effectively prevented. Therefore, for better controlling pneumoconiosis and other respiratory diseases, investigating the interaction of water molecules and mineral dust is necessary.
The retained water distribution within mineral dust is affected by inorganic minerals and the organic matters [Citation1,Citation2]. The inorganic minerals (mainly clay minerals) have strong hydrophilicity and control the performances of water molecules adsorption [Citation3–5]. Compared with clays, the adsorption of water on organic matter surface is governed by kerogen type and maturity and can be ignored [Citation6,Citation7]. Meanwhile, by analyzing the core using nuclear magnetic resonance, Korb et al. [Citation8] pointed out that oil mainly exists in kerogen pores, while the pore system of clay minerals is the main storage space for water. Hence, the description of adsorption isotherm of water molecules on clay minerals plays an important role in correctly understanding the occurrence mode and characteristics of water in mineral dust. The clay minerals mainly include kaolinite, illite and montmorillonite. Kaolinite and illite are both considered as nonswelling clays, while montmorillonite is representative of swelling clay. In this study, nonswelling kaolinite clay is taken as the research object, and the performances of water molecules adsorption in swelling mineral of montmorillonite clay will be discussed in the next work.
Up to now, many attempts have been performed to study water molecules adsorption by clays [Citation9–13]. Zolfaghari et al. [Citation9] researched the effects of clays on the performances of water molecules adsorption in reservoir and found that improving the content of clays can increase the rate and amount of water molecules adsorption. Hatch et al. [Citation10] compared the water adsorption on montmorillonite, kaolinite and illite. They discovered that the mechanisms of water molecules adsorption in three clays are different. Feng et al. [Citation11] investigated water molecules adsorption performances in three clays (montmorillonite, kaolinite and illite). The results revealed that the small pores with the diameter of lower than 5 nm can be blocked by capillary water under high vapour pressure condition. Likos and Lu [Citation12] studied water molecules adsorption in kaolinite-montmorillonite mixtures and illustrated that montmorillonite-rich mixtures are conducive to the adsorption of water molecules. Martin [Citation13] analyzed the influence of temperature on the adsorption of water molecules in Na and Li kaolinite and reported that under the same vapour pressure, low temperature promotes the adsorption of water molecules. It is obvious that the physical interaction of kaolinite clay and water molecules gains less attention, and the available data about the adsorption performances of water molecules in kaolinite clay mineral is scattered. Hence, further studies about water molecuels adsorption performances in kaolinite clay mineral are still necessary.
The better interpreting of adsorption phenomenon and the deep understanding of adsorption mechanism of water molecules on clay minerals needs thermodynamics. At this stage, little work has been devoted to the thermodynamics analysis about water molecules adsorption in clays [Citation12,Citation13]. By analyzing the entropy of adsorption for water molecules on kaolinite clay, Martin [Citation13] discovered that the trapped water molecules in kaolinite clay have bigger randomness than normal liquid water molecules. Likos and Lu [Citation12] studied water molecules adsorption heat in kaolinite/montmorillonite mixtures. They discovered that the ratio of kaolinite in mixtures has no significant impact on the heat of adsorption. Evidently, the investigation on thermodynamics analysis of water molecules adsorption in kaolinite clay is very lacking. Hence, to better understand water adsorption mechanism on kaolinite clay, it is needed to systematically discuss water molecules adsorption in kaolinite clay from the viewpoint of thermodynamics.
This paper reports on the measurement for the adsorption of water molecules in kaolinite clay at temperatures ranging from 293 to 313 K. The mechanism of the adsorption of water molecules in kaolinite clay was discussed through thermodynamics analysis. This study aims to provide insights into occupational pneumoconiosis prevention and treatment.
2. Experimental methods
2.1. Material
The used kaolinite clay was obtained from Yunnan-Guizhou Plateau of China. The kaolinite clay for sample characterization and water molecules adsorption measurement was powdery with a size ranging from 0.106 to 0.125 mm.
2.2. Characterization of kaolinite
2.2.1. Characterization of pore system of kaolinite
The adopted kaolinite clay belongs to porous material, whose pore size distribution (PSD) is wide. In order to more precisely characterize the inner pore system of kaolinite clay, the low-temperature CO2 adsorption under 273.15 K was adopted to analyze micropore information, and the low-temperature N2 adsorption under 77 K was employed to detect mesopore and macropore information.
It is obvious that the measurement accuracy of pore structure is dependent of fluid property [Citation14]. Due to the extremely low temperature and larger kinetic diameter, the entry of N2 to the finest micropore is restricted. As a result, low-temperature N2 adsorption has a better accuracy to measure mesopore and macropore. In contrast, the higher temperature and smaller kinetic diameter facilitate injected CO2 molecules to probe the more constricted micropore. Accordingly, low-temperature CO2 adsorption is more suitable for measuring micropore.
2.2.2. Characterization of surface characteristics of kaolinite
Besides the pore structure, the surface chemistry characteristics can also affect the adsorption of water molecules on kaolinite clay [Citation15]. In this study, the functional group distributions and chemical property of kaolinite clay were analyzed by Fourier transform infrared (FTIR) spectrometry (Tensor II, Buker Corp.).
2.2.3. Characterization of mineral composition of kaolinite
The mineral composition of kaolinite clay was characterized through X-ray diffraction (XRD) of Bruker D8 Advance by Cu Kα radiation.
2.3. Adsorption isotherm measurement
The isotherms for water molecules adsorption in kaolinite clay at temperature range of 293–313 K was measured through the gravimetric adsorption apparatus (IGA-100B). This apparatus was offered by Hiden Analytical Ltd. The adsorption isotherm can be gained by collecting the uptake of water vapour at different equilibrium pressures (P) under constant experiment temperature (T).
Prior to injecting water molecules into sample cell, the kaolinite clay needs to be outgassed at 473 K and 10−5 Pa for 10 h. The result of thermogravimetric analysis indicates that at 473 K, the tightly adsorbed water in clay minerals can be removed, and the structure of clay minerals cannot be damaged [Citation16]. The relative pressure (P/P0) for adsorption measurement at each temperature all ranges from 0 to 0.90.
3. Theory
3.1. Adsorption isotherm model
By using the appropriate adsorption model to deal with adsorption isotherm, the adsorption potential of porous material can be estimated, and information about the interaction of adsorbate and porous material can be obtained. At present, there are some models available to treat adsorption isotherms for water molecules in porous adsorbents, such as Dubinin-Serpinsky model, Dent’s model and D’Arcy and Watt model [Citation3,Citation17]. Dent’s model assumes that adsorbent surface has two types of adsorption sites, i.e. primary and secondary sites. Those primary sites have the larger binding energy and will preferentially adsorb injected adsorbate molecules. Those secondary sites refer to the utilizable adsorption centers in the pre-occupied primary sites. Previous studies have demonstrated that Dent’s model can reasonably match adsorption performances for water molecules in reservoir [Citation5,Citation17]. Meanwhile, clay minerals control the adsorption process of water molecules in reservoir. Therefore, the collected isotherms for water molecules in kaolinite clay were simulated using Dent’s model in this study. Dent’s model can be described by Equation (1) [Citation5].
(1)
(1) where n refers to the quantity for adsorption (mmol/g); n0 represents the quantity of monolayer adsorption (mmol/g); and k1 and k2 represent the coefficients with regard to the adsorption energy of primary centers and the adsorption energy of secondary centers, respectively.
The quantity for adsorption in primary centers (n1) is obtained using Eq. (2). The adsorption amount in secondary centers (n2) is gained using Eq. (3)[Citation3].
(2)
(2)
(3)
(3)
The fitting results can be evaluated by average relative deviation (ARE) and determination coefficient (R2). ARE represents the quantitative deviation between experiment data and calculated value [Citation18].
(4)
(4) where ncal and nexp are the calculated adsorption amount and experimental adsorption amount (mmol/g), respectively; and N is the number of data point.
3.2. Thermodynamics analysis
For the better understanding of water molecules adsorption mechanism in kaolinite clay, the thermodynamics parameters of surface potential (Ω), Gibbs free energy change (ΔG), isosteric heat of adsorption (Qst) and entropy loss (ΔS) were analyzed. Ω represents the least isothermal work for adsorbate to attain equilibrium state and can be gained through Equation (5) [Citation19]. ΔG is usually taken as an indicator for analyzing the spontaneity degree of the adsorption and can be obtained through Equation (6) [Citation20]. Qst represents the heat effect for the investigated adsorption process, and Equation (7) and Equation (8) give the calculation method of Qst [Citation21]. ΔS can provide the information about adsorbed molecules accumulation manner and can be determined by Equations (9) and (10) [Citation20].
(5)
(5)
(6)
(6)
(7)
(7)
(8)
(8)
(9)
(9)
(10)
(10) where ΔH represents the enthalpy change; R represents the gas universal constant; and C represents the constant.
3.3. Henry’s coefficient
At the low equilibrium pressure condition, the uptake increases linearly with equilibrium pressure. This relationship is usually called Henry’s law. Over the Henry’s region, the density for adsorbate molecules is low, and the interaction of each adsorbate molecule with adsorbent surface is independent [Citation22]. As a result, the interaction force of adsorbent surface and adsorbate molecule is dominated in Henry’s region, and Henry’s coefficient (KHC) can be taken as an index to estimate adsorption affinity.
For calculating KHC, the relationship between the uptake and equilibrium pressure can be expressed by Equation (11) [Citation22].
(11)
(11) where A0, A1 and A2 represent viral coefficients. The relationship between KHC and A0 can be described by Equation (12).
(12)
(12)
When the equilibrium pressure is low, Equation (13) can be obtained by neglecting the high-order terms in Equation (11).
(13)
(13) Then A0 can be acquired through linear fitting of curve of ln(P/n) versus n.
4. Results and discussion
4.1. Characterization results of kaolinite
4.1.1. Mineral composition of kaolinite
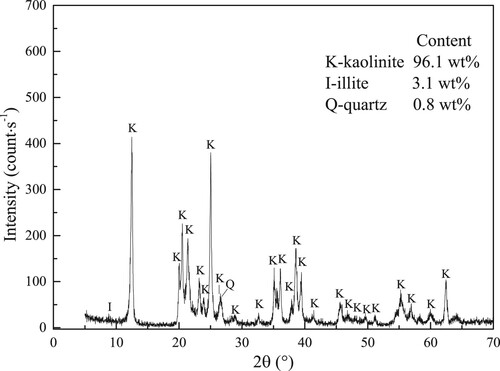
The XRD pattern of adopted sample is given in Figure . The main mineral of adopted sample is kaolinite with the content of 96.1 wt%. Meanwhile, the adopted sample has 0.8 wt% quartz and 3.1 wt% illite. Because the contents of quartz and illite are very low, the adsorption of water molecules on quartz and illite can be ignored. Accordingly, taking adopted sample as kaolinite clay is reasonable, and studying the adsorption performances for water molecules in adopted sample can understand the interaction of water molecules and kaolinite clay.
Figure 1. XRD pattern of kaolinite clay.
4.1.2. Surface characteristics of kaolinite
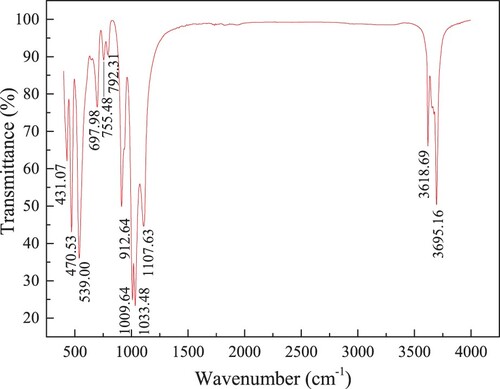
The obtained FTIR spectra for kaolinite clay are given in Figure . The absorbance peaks appearing at 3695.16 and 3618.9 cm−1 are caused by the O–H stretch vibration bonds between 3750 and 3600 cm−1, which are the representative normal silicate adsorption bands for kaolinite clay [Citation23]. The absorbance peaks ranging from 1200 and 800 cm−1 and from 600 and 400 cm−1 are related to the Si–O bending and stretching vibrations in silicate [Citation24]. The region for 800–600 cm−1 is assigned to the C–H bending vibration.
Figure 2. FTIR spectra of kaolinite clay.
4.1.3. Pore system of kaolinite
The obtained N2 isothermal adsorption and desorption curves in kaolinite clay under 77 K are plotted in Figure (a). The PSD for macropore and mesopore for kaolinite clay is described in Figure (b). When P/P0 is higher, the desorption isotherm is slightly above the adsorption isotherm. Under the lower P/P0 condition, the desorption isotherm coincides with the adsorption isotherm. Thereby, hysteresis loop is not obvious. Meanwhile, kaolinite has a continuous PSD ranging from 2 to 36 nm.
Figure 3. Isothermal adsorption and desorption curves for N2 at 77 K (a) and PSD of macropore and mesopore (b).
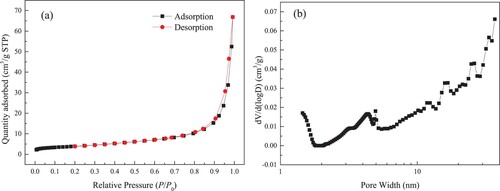
The calculated macropore and mesopore structure parameter for kaolinite clay is listed in Table . The BET specific surface area (SBET) for adopted kaolinite clay in this study is 14.03 m2/g, which is close to the value of the specific surface area of 8–12 m2/g for kaolinite reported by Harrou et al. [Citation26]. The obtained total pore volume (Vt) is 0.0325 cm3/g. The macropore volume (Vmac), mesopore volume (Vmes) and micropore volume (Vmic) are 0 cm3/g, 0.0297 cm3/g and 0.0028 cm3/g, respectively. Clearly, the proportion of Vmes to Vt (Vmes/Vt) on kaolinite clay is up to 91.4%, suggesting that mesopore provides the main contribution for SBET and Vt.
Table 1. Macropore and mesopore parameters for kaolinite and deep reservoirs.
Table also compares the macropore and mesopore parameters of kaolinite clay and deep reservoirs. The values of SBET and Vmac of kaolinite clay are both smaller than those of deep reservoirs, while kaolinite clay has the larger Vmes and Vt values than deep reservoir. Meanwhile, the value of Vmic of kaolinite clay is close to those of deep reservoirs. As listed in Table , kaolinite clay has a larger mesopore volume, and Vmes/Vt value for kaolinite clay is evidently higher than those for deep reservoirs. Hence, kaolinite clay has a more abundant mesopore structure, which is conducive to fluid migration. In addition, owing to the variation in phase behaviour for restricted fluid, mesopore also has an important influence on fluid adsorption, even when the potentials of adsorption are not obviously overlapped [Citation27]. This is because at the subcritical conditions, a liquid-like phase can be formed in the mesopore by the mechanism of capillary condensation [Citation28].
The obtained isothermal adsorption curve for CO2 in kaolinite clay under 273.15 K is displayed in Figure (a). The PSD for micropore for kaolinite clay is detailed in Figure (b). Apparently, the PSD for micropore for kaolinite clay is discontinuous with the main peaks around 0.50, 0.55, 0.60, 0.67, 0.74, 0.79 and 0.85 nm.
Figure 4. Isothermal adsorption curve for CO2 at 273.15 K (a) and PSD of micropore (b).
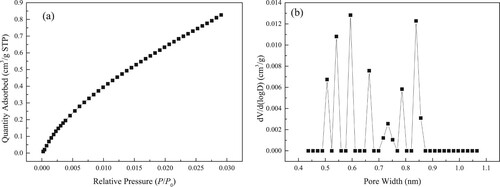
The micropore specific surface area (SCO2) and micropore volume (VCO2) obtained by CO2 adsorption measurement are given in Table with the values of 2.68 m2/g and 0.0015 cm3/g, respectively. The micropore parameters for deep reservoirs are also reported in Table . SCO2 and VCO2 for deep reservoirs are evidently larger than those for kaolinite clay, which reflects that the micropore structure for kaolinite clay is undeveloped. The larger SCO2 and VCO2 for deep reservoirs are due to the inclusion of organic matter within the reservoir matrix. The organic matter has the smaller pore size and the more complex structure than inorganic matter [Citation31]. Consequently, the micropore in deep reservoir is mostly offered by organic matter, and deep reservoir has the bigger SCO2 and VCO2 than kaolinite clay. Meanwhile, because the electrostatic interactions and van der Waals are enhanced in the micropore by the overlap of adsorption potential, micropore is particularly beneficial for fluid adsorption [Citation27,Citation32,Citation33].
Table 2. Micropore parameters for kaolinite and deep reservoirs.
4.2. Adsorption performance on kaolinite
4.2.1. Isothermal adsorption curves on kaolinite
Figure (a) gives the measured results for water molecules isothermal adsorption curves in kaolinite clay as a function of P/P0 at different temperatures. Obviously, there is positive correlation between the uptake and P/P0. When P/P0 is lower than 0.1, the uptake increases quickly. Then, with the continuous enhancement in P/P0, the adsorption rate becomes slow. Especially, at high P/P0, the quantity increases sharply. Until P/P0 is close to one, the adsorption is still not saturated.
Figure 5. Uptake of water molecules on kaolinite as a function of relative vapour pressure (a) and vapour pressure (b).
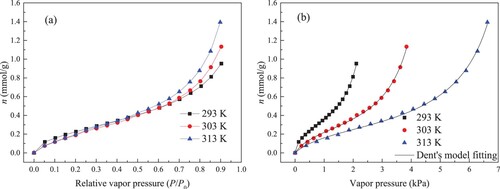
It can be noted from Figure (a) that the effect of measurement temperature on isotherms for water molecules adsorption is not clear when P/P0 is lower than 0.50. When P/P0 > 0.5, higher temperature corresponds to the greater adsorption quantity. For the adsorption process for water molecules on deep reservoir, Chen et al. [Citation4] also pointed out that water molecules adsorption isotherms plotted against P/P0 is insensitive to measurement temperature. The difference in the vapour pressure at three temperatures can account for the abnormal relationship of P/P0 and temperature. Water vapour pressure increases significantly with improving temperature. Apparently, the difference in vapour pressure at three temperatures is larger under higher P/P0. Even though improving temperature reduces uptake, the vapour pressure improvement promotes the adsorption of water, resulting in the abnormal relationship of P/P0 and temperature.
For a better understanding of adsorption performances of water molecules on kaolinite at different temperatures, Figure (b) shows the results for isotherms as a function of vapour pressure at three temperatures. It is obvious that reducing temperature can raise the adsorption quantity. Temperature increasement improves the thermal motion of molecules and gives molecules more kinetic energy to overcome the attraction force between molecules and surface adsorption sites, bringing about the lower adsorption amount [Citation3]. As plotted in Figure (b), adsorption isotherms shape at three temperatures is anti S-type, and the adsorption isotherms all belong to the type II isotherm. This type isotherm is also discovered for the adsorption of water molecules in deep reservoir [Citation4,Citation34]. For type II isotherm, the rapid rise of isotherm in the low-pressure stage is attributed to the adsorption of injected adsorbate molecules on the preferential adsorption sites, and the sharp and unlimited rise of isotherm in the high-pressure stage can be explained by the capillary condensation phenomenon in the mesopore.
4.2.2. Fitting results of adsorption isotherm on kaolinite
The fitting results for the isotherms of water molecules adsorption in kaolinite clay through Dent’s model are presented in Figure (b). It is evident that the calculated values agree well with the experiment data. Table summarizes the fitting parameters. R2 values are all greater than 0.99. ARE values are all lower than 3.0. Thereby, the adsorption isotherms can be well simulated by Dent’s model, and using Dent’s model to treat the data for water molecules adsorption in kaolinite clay is reliable.
Table 3. Fitting parameters in Dent’s model for water molecules on kaolinite.
Due to the assumption of two types of adsorption sites in Dent’s model, the adsorption sites on kaolinite clay surface can be divided into primary and secondary sites. As demonstrated by many scholars, the inherent functional groups on material surface, especially oxygen-containing functional group, can be taken as the primary sites [Citation35,Citation36]. The characterization result of surface characteristics of kaolinite presented in Figure shows that there are oxygenated functional groups distributions in kaolinite surface. Therefore, kaolinite clay has the surface basis to form the different adsorption sites.
As listed in Table , the value of n0 reduces with improving temperature. This indicates that the monolayer adsorption amount decreases as the temperature increases and improving temperature inhibits water molecules adsorption in primary sites. It can be also found that increasing temperature leads to the smaller values of k1 and k2, which suggests that the adsorption energies of primary sites and secondary sites are both weaken at the high temperature condition.
4.2.3. Evaluation of adsorption performances on primary sites and secondary sites
Taking the obtained values of n0, k1 and k2 into Equation (2) and Equation (3), the adsorption performances of water molecules on primary and secondary centers can be evaluated. Figure (a,b) show the isotherms for water molecules adsorption in primary centers and secondary centers, respectively. Manifestly, the shape of adsorption isotherm on primary sites differs very much from that of adsorption isotherm on secondary sites, illustrating that the mechanisms for water molecules adsorption in primary and secondary centers are different.
Figure 6. Uptake of water molecules on primary sites (a), secondary sites (b), primary sites and secondary sites (c) and three sites (d).
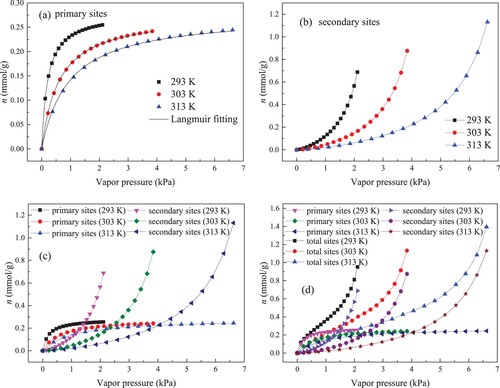
As described in Figures (a,b), when P is low, water molecules uptake in primary centers increases quickly, while less water molecules are adsorbed on secondary sties. Thereby, primary centers control water molecules adsorption in low P condition. Because of the lower density of water molecules at the initial stage within kaolinite pore space, the interaction between water molecules is very weak, and the injected water molecules will directly trapped in surface centers with larger adsorption potential. This rapid rise of adsorption isotherm in primary centers at low P not only illustrates that the primary sites have the higher binding energy but also confirms that the functional groups on kaolinite surface can take the role for primary sites.
As the P continues to increase, the uptake of water molecules in primary centers rapidly approaches the maximum value, while the uptake on secondary centers increases rapidly. This illuminates that water molecules adsorption in secondary centers plays a more and more important role with P increases. With the progress of adsorption process, majority of primary centers are fast used, resulting in slow increase of adsorption quantity in primary centers. The performance for adsorption in primary centers reveals that water molecules adsorption mechanism in primary centers is monolayer adsorption, agreeing with the findings of Chen et al. [Citation4] and Wang et al [Citation3]. In addition, the adsorption of water molecules in secondary centers is not monolayer adsorption. Many researches have indicated that the pre-adsorbed molecules in primary centers can act as secondary centers for the subsequent adsorption of water molecules [Citation15,Citation35]. With the continuous improvement of P, injected water molecules can form water clusters on the occupied primary sites via the hydrogen bonds [Citation15]. The formation and appearance of water clusters in porous material have been confirmed by in-situ small-angle neutron scattering [Citation35]. Therefore, when the primary sites are occupied, water clusters begins to form on the secondary sites. As the P enhances, the water clusters size constantly grows by gathering more injected water molecules, which is responsible for the rapid increase of water molecules on secondary sites. When studying water adsorption on activated carbons, Brennan et al. [Citation37] found that the retained water molecules will minify the size of pore and narrow PSD of activated carbons. Meanwhile, the adsorbed water molecules will separate space of pore into several regions and reduce connectivity of pore and available pore volume. Given that the distribution of retained water molecules in primary centers is by monolayer adsorption on pore surface, the influence of adsorption in primary centers on pore connectivity is limited. However, the growing clusters can effectively block the structure of pore[Citation15]. Therefore, for kaolinite-rich deep reservoir, the reduction in adsorption and transport capacity of CH4 after the fracturing process is mainly due to the formation of water clusters on secondary sites.
At high P condition, water molecules adsorption in primary centers reaches saturation, while water molecules adsorption amount in secondary centers increases sharply without limit. In this stage, there are no vacant primary sites for adsorption, and the uptake on primary sites is not increasing. For water molecules adsorption in secondary centers under high P, the growing water clusters can merge with other clusters to form the larger water clusters [Citation37], which brings about a sharp increase in adsorption quantity on secondary sites.
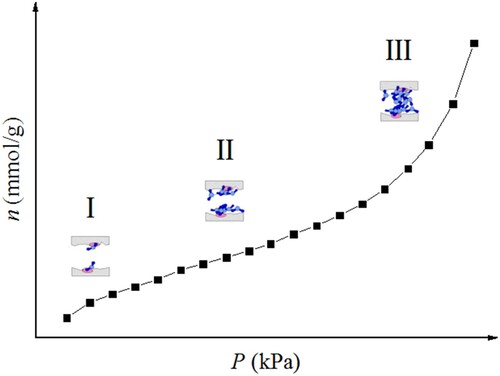
According to the above analysis, we can divide the adsorption process of water molecules on kaolinite clay into three stages. Figure presents the three adsorption stages of water molecules on kaolinite. The first stage represents the adsorption on primary sites on kaolinite surface. The second stage corresponds to the formation of water clusters on secondary sites (pre-adsorbed water molecules). Noticeably, with increasing P, the formed clusters can continue to enlarge and bridge with adjacent water clusters. The third stage refers to the capillary condensation of clusters in mesopore.
Figure 7. Three adsorption stages of water molecules on kaolinite (corrected from Ref. 34).
The comparison of isotherms in primary and secondary centers is displayed in Figure (c). Under low P, the uptake in primary centers is bigger than that in secondary centers. As P increases, secondary adsorption becomes important, and secondary adsorpiton quantity becomes to exceed primary adsorption quantity. Eventually, under high P, secondary adsorpiton uptake is evidently greater than primary adsorption quantity. It is acceptable that the adsorption performances for water molecules in primary centers is closely related to the functional groups on kaolinite surface, and adsorption on secondary sites is mainly affected by the pore structure of kaolinite. Hence, functional groups distribution in kaolinite is sparse, and especially at high P, the performances for adsorption for water molecules in kaolinite is controlled through inner system of kaolinite pore. In addition, temperature possesses a more obvious effect on adsorption performances for water molecules in secondary centers, which is in agreement with the observation reported by Wang et al. [Citation3]. This is attributed to the greater difficulty to form clusters in secondary centers under higher temperature [Citation5].
Figure (d) compares the adsorption behaviours of water molecules in primary, secondary and total sites. It can be noted that primary adsorption and secondary adsorption govern adsorption isotherm shape in total sites. In the previous study about water adsorption on activated carbon, Foley et al. [Citation36] pointed out that the adsorption isotherm is a function of vapour pressure, inner pore structure and the distribution and concentration of primary centers. As detailed in Figure (d), the isotherm shape for primary adsorption is in accord with the features of type I isotherm, indicating that primary adsorption mechanism is monolayer adsorption. Generally, the steep increase in the adsorption quantity at low P is owing to the enhanced adsorbate–adsorbent interaction in narrow micropores [Citation38]. For studied kaolinite, the oxygenated function groups on surface promote the rapid adsorption on primary sites in the low P. Due to its effectiveness, rationality and simplicity, Langmuir model has become the most commonly adopted model for monolayer adsorption [Citation39]. Thereby, the adsorption isotherms on primary sites were treated with Langmuir model. The form of Langmuir model is given in Equation (14).
(14)
(14) where nm represents the maximum adsorption ability; b represents Langmuir constant which is related to temperature, b = M0eE/(RT), where E represents the binding energy for adsorption sites; and M0 represents the prefactor.
The fitting results of adsorption isotherms on primary sites using Langmuir model are shown in Figure (a). The fitting parameters in Langmuir model are detailed in Table . The calculated primary adsorption quantity using Langmuir model is in excellent agreement with the given adsorption amount. Therefore, Langmuir model can well deal with the adsorption isotherm on primary sites. Because increasing temperature will reduce the uptake and the interaction energy, nm and b values both reduce with experiment temperature. Given that one of the basic assumptions for Langmuir model is that the adsorbed molecules on material surface do not affect each other, it can be reasonably considered that the interactions among trapped water molecules in primary centers on kaolinite surface can be neglected, which confirms that the distribution of primary sites in kaolinite surface is dispersed.
Table 4. Fitting parameters in Langmuir model for water molecules on primary sites.
As elucidated in Figure (d), the adsorption isotherms on secondary sites belong to type III isotherm. This type isotherm reveals that water molecule-kaolinite surface interaction is relatively weak and the rapid enhancement in adsorption amount at high P is attributed to the formation of water clusters [Citation38]. By analyzing the isotherms of primary adsorption and secondary adsorption, we can find that the combined effect results in the type II isotherm in kaolinite clay.
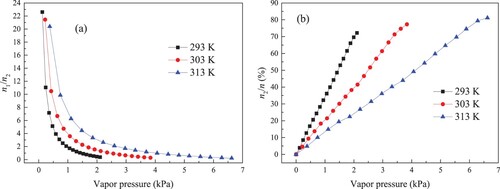
The ratio of adsorption amount on primary sites to that on secondary sites (n1/n2) is illustrated in Figure (a). Increasing vapour pressure can obviously decrease n1/n2. For example, with the enhancement in vapour pressure, the value of n1/n2 at 303 K decreases from 21.45 to 0.32. Figure (b) displays the percentage of secondary adsorption amount in total adsorption amount (n2/n). The value of n2/n at 293 K is the highest, followed by 303 K and 313 K in sequence.
Figure 8. Ratio of uptake on primary sites to secondary sites (a) and percentage of uptake on secondary sites in total uptake.
4.2.4. Adsorption affinity on kaolinite
Table gives the results of Henry’s coefficient (KHC) for water molecules on kaolinite clay at different temperatures. It can be noticed that the lower temperature corresponds to the larger values of KHC. Accordingly, the adsorption affinity becomes weaker as the temperature increases, which is in agreement with the findings of CO2 and N2 adsorption on zeolites [Citation40]. Therefore, improving temperature decreases the uptake of water molecules on kaolinite.
Table 5. Results of KHC for water molecules on kaolinite.
By comparing KHC in primary, secondary and total centers, we can find that KHC value in total centers is the largest, while KHC value in secondary centers is the smallest. The value of KHC in primary centers is more than one order of magnitude bigger than that in secondary centers. The calculation of KHC is mainly based on the experiment data in the low-pressure region. Thereby, the affinity in primary centers is apparently bigger than that in secondary centers. Water molecules will preferentially be trapped in primary centers in low-pressure region. The extremely small value of KHC on secondary sites also reflects that water molecules-secondary sites interaction is very weak, and the adsorption on secondary sites is dependent on the interaction force among water molecules.
4.3. Adsorption thermodynamics analysis on kaolinite
4.3.1. Surface potential on kaolinite
The calculated results of surface potential (Ω) in kaolinite in total, primary and secondary centers are presented in Figures (a–c), respectively.
Figure 9. Results of surface potential for water molecules on total sites (a), primary sites (b), secondary sites (c) and three sites (d).
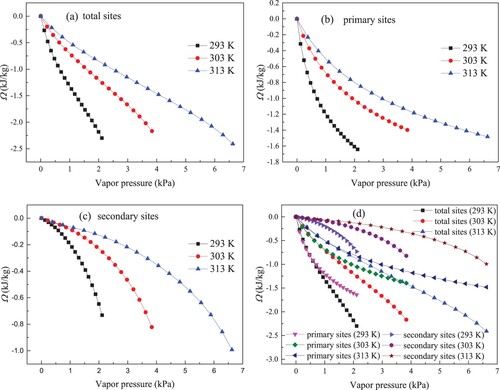
The absolute values for Ω all increase with increasing vapour pressure, which exhibits that more isothermal work is needed for water molecules adsorption at higher vapour pressure. At initial phase, water molecules are selectively trapped on surface centers with bigger adsorption potentials. When the preferential surface sites are gradually occupied, water molecules are restricted to be trapped in surface centers with smaller adsorption potentials [Citation41]. Accordingly, more isothermal work is needed at the higher vapour pressure condition to fix the water molecules on the adsorption centres, giving rise to the higher Ω. The Ω values approach zero when the vapour pressure decreases to zero. According to the definition about surface potential by Van Ness, the chemical potential on the occupied adsorbent surface is the same to that on fresh adsorbent surface under the low loading [Citation19]. Thus, the reduction in vapour pressure not only is harmful for adsorption amount but also can decrease Ω to zero.
As described in Figure , when the vapour pressure is the same at three temperatures, the lower temperature leads to higher (more negative) Ω, which is accordant with the finding of Duan [Citation42]. Ω represents the standard of necessary work to promote the adsorption system to reach equilibrium state [Citation19]. Improving experiment temperature will decrease the quantity of adsorption, and only a few adsorbates need to be packed into cavity space. Correspondingly, higher temperature corresponds to less isothermal work and lower Ω.
Figure (d) compares Ω on three adsorption sites at different temperatures. Obviously, Ω value in primary centers is more negative than that in secondary centers, illustrating that more isothermal work is offered for primary adsorption. Meanwhile, the absolute value for Ω in primary centers exhibits a more rapid increase upon vapour pressure over the lower vapour pressure region, suggesting that more adsorbates are trapped on the primary sites at the initial stage. In addition, the difference between Ω on primary sites and total sites becomes larger as the vapour pressure increase. Thereby, the contribution of Ω on secondary sites to that on total sites increases with vapour pressure, and Ω on kaolinite clay surface is affected by Ω in primary secondary centers.
4.3.2. Gibbs free energy change on kaolinite
The appearance of Gibbs free energy change (ΔG) is attributed to the asymmetry of force field for atom or molecule on solid surface [Citation43]. In order to make the interface stable, the interface will spontaneously decrease the surface free energy through the adsorption of other molecules [Citation21]. Hence, the larger ΔG reveals that the adsorbent possesses the greater power to reduce the energy by adsorbing gas. Taking ΔG to estimate the adsorption spontaneity is reasonable.
The calculated results for ΔG in kaolinite clay in total, primary and secondary centers are given in Figures (a–c), respectively. The values of ΔG are all negative, confirming that water molecules adsorption in kaolinite clay is a spontaneous process. Meanwhile, it can be found from Figure (a) that as the vapour pressure enhances, ΔG absolute value in total centers quickly rises to the maximum and then gradually declines. Consequently, the enhancement in vapour pressure under low vapour pressure region helps to improve adsorption spontaneity. Under the higher vapour pressure condition, increasing vapour pressure decreases the spontaneity of adsorption of water molecules.
Figure 10. Results of change of Gibbs free energy for water molecules adsorption on total sites (a), primary sites (b), secondary sites (c) and three sites (d).
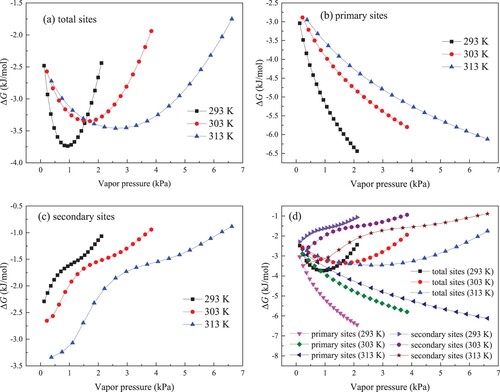
The calculated result of ΔG on primary sites is presented in Figure (b). In the entire vapour pressure region, ΔG shows a monotonous increasing trend on primary sites, revealing that enhancing vapour pressure can improve the spontaneity degree and promote the adsorption of water molecules on primary centers. Figure (c) shows the calculated result for ΔG in secondary centers. With improving vapour pressure, ΔG absolute value on secondary sites becomes smaller. Accordingly, enhancing vapour pressure reduces the adsorption spontaneity. For the porous materials, the adsorption process mainly occurs with the pore structure. As vapour pressure improves, the size of clusters continues to grow. As pointed out by Svabova et al. [Citation15], the formation of water clusters around the opening of pore throat can significantly block the inner pore system, reduce the available pore space and hamper the diffusion of injected adsorbate into pore. In addition, Brennan et al. [Citation37] found that the adsorbed clusters can shrink the pore size and narrower the pore size distribution. Meanwhile, water clusters can dramatically reduce pore connectivity by separating the connected and continuous pore space into several individual regions. Hence, with the vapour pressure enhances, the adsorption channel of kaolinite gets smaller, and the injected water molecules are more difficult to migrate into pore system to form bigger water clusters. Improving vapour pressure gives rise to lower ΔG on secondary sites.
Figure (d) compares the results of ΔG in primary, secondary and total sites. Under lower vapour pressure, the value of ΔG in total centers is close to that in primary centers. This is because the majority of injected adsorbates are trapped in primary centers at the early stage. With the rapid saturation of primary sites, subsequently adsorbates are retained in secondary centers. At this stage, the ΔG in total centers is mainly influenced by that in secondary centers, and the constant decrease for ΔG in secondary centers leads to the lower and lower ΔG on total centers.
As depicted in Figure (b,c), the temperature has different effect on ΔG primary and secondary centers. In primary centers, lower temperature corresponds to higher ΔG, illuminating that improving temperature decreases the spontaneity of primary adsorption. Contrarily, in secondary centers, the increase in temperature brings about the larger absolute value of ΔG. High temperature helps to raise adsorption spontaneity for water molecules on secondary sties. With increasing temperature, the clusters are more difficult to form [Citation5]. As a result, higher temperature causes the smaller water cluster, which is responsible for the bigger ΔG absolute value in secondary centers at higher temperature. Furthermore, as shown in Figure (a), when vapour pressure is less than 1.5 kPa, ΔG absolute value in total centers decreases as temperature improves, while higher temperature produces the larger ΔG absolute value in total centers for vapour pressure greater than 1.5 kPa. This indicates that the relationship of temperature and ΔG on total sites is governed by the influence of temperature on ΔG in primary and secondary centers.
4.3.3. Isosteric heat of adsorption on kaolinite
Isosteric heat of adsorption (Qst) is a fundamental parameter for the studied adsorption system. Qst can give information about surface characterization of adsorbent [Citation44]. The calculated result of Qst for water molecuels on kaolinite surface is plotted in Figure . The enthalpy change value (–Qst) is negative, which suggests that the adsorption of water molecules in kaolinite clay is an exothermic process. Thereby, reducing temperature improves water molecules adsorption on kaolinite clay.
Figure 11. Result of isosteric heat of adsorption for water molecules on kaolinite.
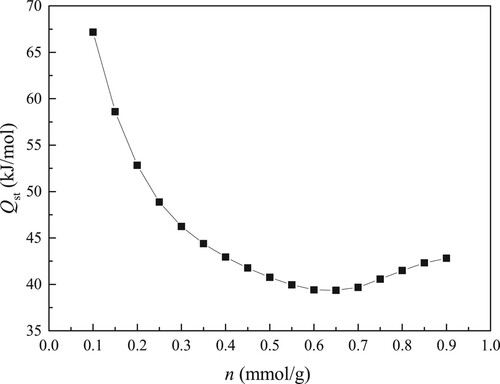
As described in Figure , Qst value is not constant during the adsorption process. With the enhancement in adsorption amount, Qst value quickly decreases to its minimum, and then increases slowly. Especially at initial phase, the decrease for Qst is faster. The reduction in Qst illustrates that the surface of kaolinite clay is energetically heterogeneous. The decrease of Qst with the uptake is also discovered for fluid adsorption in naturally occurring porous materials, such as clay minerals and shale [Citation42]. The change of Qst is affected by adsorbent surface heterogeneity and the interaction force between adsorbate molecules [Citation45]. For water molecules adsorption process in kaolinite clay, the water molecules are firstly trapped in primary centers with larger binding energy and then are trapped in adsorption centers with smaller binding energy. Thereby, due to the binding site heterogeneity, Qst for water molecules on kaolinite clay decreases as the uptake increases when the uptake is less than 0.6 mmol/g. The reduction of Qst also reflects that, at early phase, the adsorbate–adsorbate interaction is weaker. As the uptake increases, the majority of primary centers are utilized. Based on strong hydrogen bonds among water molecules, at late stage of adsorption, the water molecules are gradually adsorbed in secondary centers (occupied primary sites) through the formation of water clusters. The continuously enhancing adsorbate–adsorbate interaction results in the increase in Qst when the uptake is larger than 0.6 mmol/g. Meanwhile, the increase of Qst implies that adsorbate–adsorbate interaction is dominant during late phase. In addition, the increase of Qst indirectly confirms that the adsorption of water is mainly by the mechanism of water clusters within the pore space of kaolinite at the higher uptake condition.
4.3.4. Entropy loss on kaolinite
Knowledge of entropy loss (ΔS) is useful to understand the restricted degree and adsorption behaviour of water molecules. The calculated result of ΔS in kaolinite clay is shown in Figure . Evidently, ΔS value is negative, indicating that the disorderliness degree of system is reduced during the adsorption process. Hence, compared with the unrestricted water molecules, the freedom degree of adsorbed water molecules becomes smaller, and the adsorption system inclines to be orderly to decline the surface free energy. Meanwhile, the negative sign of ΔS also indicates that the internal pore structure of kaolinite clay does not change greatly during adsorption process and water molecules adsorption is enthalpy driven [Citation46].
Figure 12. Result of entropy loss for water molecules adsorption on kaolinite.
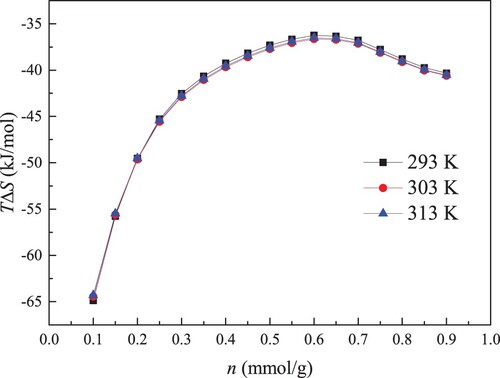
As given in Figure , ΔS value changes with the uptake, suggesting the heterogeneous process of water molecules adsorption in kaolinite clay. ΔS value reflects the restriction degree of adsorbate molecules, which is affected through adsorbent–adsorbate interaction and available free pore space. Generally, when the adsorbent–adsorbate interaction force is the same, the smaller the pore size, the greater the absolute value of ΔS [Citation47]. This is mainly due to the distinct layers are not formed in the smaller pore. Within the bigger pore space, the produced distinct layer corresponds to a more structured fluid, which always generates the lower ΔS [Citation48]. At the initial stage of adsorption, the free space is abundant, and ΔS value is affected through adsorbent–adsorbate interaction. Because the primary centers have the higher bind energy, the adsorbed water molecules are firmly trapped on the kaolinite surface. Hence, the movement of adsorbed water molecules is severely limited and the packing of adsorbed water molecules is more efficient, giving rise to the higher ΔS. With the further adsorption of water molecules, the water molecules are only fixed to adsorption centers with lower bind energy. The adsorbent–adsorbate interaction gets weaker, and the force that prevents water molecules from escaping the kaolinite surface becomes smaller. Accordingly, the disorder degree of water-kaolinite clay adsorption system increases, and the absolute value of ΔS reduces as the uptake enhances. At the higher loading condition, the primary centers are all utilized, and the injected adsorbates are retained within pore system by water clusters. With increasing the size of water clusters, water clusters movement in the pore is more difficult. Thus, the absolute value of ΔS improves under the high loading. Moreover, we can note that as the uptake enhances, the decrease rate of ΔS at the initial phase is greater than the increase rate of ΔS at the late phase, illuminating that the effect of adsorbent–adsorbate interaction on ΔS is more remarkable than the effect of free space on ΔS.
In addition, the previous finding has reported that ΔS is positively correlated with Qst and the more effective configuration causes the release of higher Qst [Citation49]. As elucidated in Figures and , the change trends of ΔS and Qst are consistent. Compared with ΔS of nonpolar gases, it is manifest that ΔS of water molecules in kaolinite is larger. The research result of Myers also showed that the absolute values of standard entropies for nonpolar molecules are dramatically smaller than those for polar molecules [Citation47]. Meanwhile, Brennan et al. [Citation37] found that adsorbed water molecules are preferentially retained by the formation of a three-dimensional water clusters network, which CH4 adsorption is mainly by forming layers. Accordingly, the adsorbed water molecules are tight and advantageous, and adopting water molecules to displace pre-adsorbed CH4 molecules is feasible. Under different temperatures, the curves of ΔS are almost coincident. The effect of temperature on ΔS can be ignored.
5. Conclusions
In this study, the performances of water molecules adsorption in kaolinite clay were reported. The obtained conclusions are as follows:
Dent’s model can well simulate the adsorption data of water molecules on kaolinite clay. The mechanism of primary adsorption is monolayer adsorption, while water molecules adsorption in secondary centers is by the formation of water clusters. Under low vapour pressure condition, primary adsorption controls water molecules adsorption process. At the high vapour pressure region, secondary adsorption predominates.
The surface potential increases with increasing vapour pressure. The enhancement in vapour pressure improves the spontaneity of primary adsorption but reduces the spontaneity of secondary adsorption. Entropy loss and isosteric heat of adsorption both quickly reduce to the minimum value and then slowly enlarge with increasing the uptake.
Data availability
The data applied to support the results in this study are available from the corresponding author upon request.
Disclosure statement
No potential conflict of interest was reported by the author(s).
Additional information
Funding
References
- Feng D, Li XF, Wang XZ, et al. Water adsorption and its impact on the pore structure characteristics of shale clay. Appl Clay Sci. 2018;155:126–138.
- McCutcheon AL, Barton WA, Wilson MA. Characterization of water adsorbed on bituminous coals. Energ Fuel. 2003;17:107–112.
- Wang TY, Tian SC, Li GS, et al. Experimental study of water vapor adsorption behaviors on shale. Fuel. 2019;248:168–177.
- Chen J, Gai HF, Xiao QL. Effects of composition and temperature on water sorption in overmature Wufeng-Longmaxi shales. Int J Coal Geol. 2021;234:103673.
- Tang X, Ripepi N, Valentine KA, et al. Water vapor sorption on Marcellus shale: measurement, modeling and thermodynamic analysis. Fuel. 2017;209:606–614.
- Gasparik M, Bertier P, Gensterblum Y, et al. Geological controls on the methane storage capacity in organic-rich shales. Int J Coal Geol. 2014;123:34–51.
- Hu Y, Devegowda D, Striolo A, et al. Microscopic dynamics of water and hydrocarbon in shale-kerogen pores of potentially mixed wettability. SPE J. 2014;2(1):112–124.
- Korb JP, Nicot B, Louis-Joseph A, et al. Dynamics and wettability of oil and water in oil shales. J Phys Chem C. 2014;118:23212–23218.
- Zolfaghari A, Dehghanpour H, Holyk J. Water sorption behaviour of gas shales: I. Role of clays. Int J Coal Geol. 2017;179:130–138.
- Hatch CD, Wiese JS, Crane CC, et al. Water adsorption on clay minerals as a function of relative humidity: application of BET and Freundlich adsorption models. Langmuir. 2012;28:1790–1803.
- Feng D, Li XF, Li J, et al. Water adsorption isotherm and its effect on pore size distribution of clay minerals. J China Univ Pet. 2018;42(2):110–118.
- Likos WJ, Lu N. Water vapor sorption behavior of smectite-kaolinite mixtures. Clay Clay Miner. 2002;50(5):553–561.
- Martin RT. Water vapor sorption on kaolinite: entropy of adsorption. Clay Clay Miner. 1960;8:102–114.
- Ross DJK, Bustin RM. The importance of shale composition and pore structure upon gas storage potential of shale gas reservoirs. Mar Petrol Geol. 2009;26:916–927.
- Svabova M, Weishauptova Z, Pribyl O. Water vapour adsorption on coal. Fuel. 2011;90:1892–1899.
- Kuila U, Prasad M. Specific surface area and pore-size distribution in clays and shales. Geophys Prospect. 2013;61:341–362.
- Duan S, Li GD. Equilibrium and kinetics of water vapor adsorption on shale. J Energ Resour-ASME. 2018;140:122001-1–122001-10.
- Song X, Wang LA, Ma X, et al. Adsorption equilibrium and thermodynamics of CO2 and CH4 on carbon molecular sieves. Appl Surf Sci. 2017;396:870–878.
- Ridha FN, Webley PA. Entropic effects and isosteric heats of nitrogen and carbon dioxide adsorption on chabazite zeolites. Micropor Mesopor Mat. 2010;132:22–30.
- Zhou X, Yi HH, Tang XL, et al. Thermodynamics for the adsorption of SO2, NO and CO2 from flue gas on activated carbon fiber. Chem Eng J. 2012;200-202:399–404.
- Zhou L, Feng QY, Qin Y. Thermodynamic analysis of competitive adsorption of CO2 and CH4 on coal matrix. J China Coal Soc. 2011;36(8):1307–1311.
- Tang X, Wang ZF, Ripepi N, et al. Adsorption affinity of different types of coal: Mean isosteric heat of adsorption. Energ Fuel. 2015;29:3609–3615.
- Chen YY, Furmann A, Mastalerz M, et al. Quantitative analysis of shales by KBr-FTIR and micro-FTIR. Fuel. 2014;116:538–549.
- Pan Y, Hui D, Luo PY, et al. Experimental investigation of the geochemical interactions between supercritical CO2 and shale: Implications for CO2 storage in gas-bearing shale formations. Energ Fuel. 2018;32:1963–1978.
- Gu M, Xian XF, Duan S, et al. Influences of the composition and pore structure of a shale on its selective adsorption of CO2 over CH4. J Nat Gas Sci Eng. 2017;46:296–306.
- Harrou A, Gharibi E, Nasri H, et al. Thermodynamics and kinetics of the removal of methylene blue from aqueous solution by raw kaolin. SN Appl Sci. 2020;2(2):1–11.
- Broom DP, Thomas KM. Gas adsorption by nanoporous materials: future applications and experimental challenges. Mrs Bull. 2013;38(5):412–421.
- Gelb LD, Gubbins KE, Radhakrishnan R, et al. Phase separation in confined systems. Rep Prog Phys. 1999; 62: 1573.
- Pan Y, Hui D, Luo PY, et al. Experimental investigation of the geochemical interactions between supercritical CO2 and shale: Implications for CO2 storage in gas-bearing shale formations. Energ Fuel. 2018;32:1963–1978.
- Huo PL, Zhang DF, Yang Z, et al. CO2 geological sequestration: displacement behavior of shale gas methane by carbon dioxide injection. Int J Greenh Gas Con. 2017;66:48–59.
- Niu Y, Yue CT, Li SY, et al. Influencing factors and selection of CH4 and CO2 adsorption on Silurian shale in Yibin. Sichuan Province of China. Energ Fuel. 2018;32(3):3202–3210.
- Zhou SW, Xue HQ, Guo W, et al. Supercritical isothermal adsorption characteristics of shale gas based on gravimetric method. J China Coal Soc. 2016;41(11):2806–2812.
- Ji LM, Ma XQ, Xia YQ, et al. Relationship between methane adsorption capacity of clay minerals and micropore volume. Nat Gas Geosci. 2014;25(2):141–152.
- Charriere D, Behra P. Water sorption on coals. J Colloid Interf Sci. 2010;344:460–467.
- Bahadur J, Contescu CI, Rai DK, et al. Clustering of water molecules in ultramicroporous carbon: In-situ small-angle neutron scattering. Carbon N Y. 2017;111:681–688.
- Foley NJ, Thomas KM, Forshaw PL, et al. Kinetics of water vapor adsorption on activated carbon. Langmuir. 1997;13:2083–2089.
- Brennan JK, Thomson KT, Gubbins KE. Adsorption of water in activated carbons: Effects of pore blocking and connectivity. Langmuir. 2002;18:5438–5447.
- Thommes M, Kaneko K, Neimark AV, et al. Physisorption of gases, with special reference to the evaluation of surface area and pore size distribution (IUPAC technical report). Pure Appl Chem. 2015;87(9–10):1051–1069.
- Tang X, Ripepi N, Luxbacher K, et al. Adsorption models for methane in shales: review, comparison, and application. Energ Fuel. 2017;10:10787–10801.
- Deng H, Yi HH, Tang XL, et al. Adsorption equilibrium for sulfur dioxide, nitric oxide, carbon dioxide, nitrogen on 13X and 5A zeolites. Chem Eng J. 2012;188:77–85.
- Xiong J, Liu XJ, Liang LX, et al. Adsorption behavior of methane on kaolinite. Ind Eng Chem Res. 2017;56:6238–6299.
- Duan S. A thermodynamics study of CO2 and CH4 adsorption on Sichuan Basin shale. Chongqing, Chongqing University, 2017.
- Nie BS, He XQ, Wang EY. Surface free energy of coal and its calculation. J Taiyuan Univ Technol. 2000;31(4):346–348.
- Sircar S. Isosteric heats of multicomponent gas adsorption on heterogeneous adsorbent. Langmuir. 1991;7:3065–3069.
- Chakraborty A, Saha BB, Koyama S. On the thermodynamic modeling of the isosteric heat of adsorption and comparison with experiments. Appl Phys Lett. 2006;89:171901.
- Chowdhury S, Saha P. Insight into adsorption thermodynamics. Thermodynamics, InTech, 2003.
- Myers AL. Characterization of nanopores by standard enthalpy and entropy of adsorption of probe molecules. Colloid Surface A. 2004;241:9–14.
- Keffer D, Davis HT, Mccormick AV. The effect of nanopore shape on the structure and isotherms of adsorbed fluids. Adsorption. 1996;2:9–21.
- Wang HY, Wang BD, Li JH, et al. Adsorption equilibrium and thermodynamic of acetaldehyde/acetone on activated carbon. Sep Purif Technol. 2019;209:535–541.