
Abstract
Optoelectronic and thermoelectric properties of A3InAs3 (A = Sr and Eu) Zintl compounds are investigated using FP-LAPW method with LDA, GGA and mBJ potentials for Sr3InAs3 in addition with Hubbard (U) for Eu3InAs3 based on DFT. Electronic properties reveal that both the compounds are direct bandgap semiconductors and their semiconducting nature is also supported by electrical resistivity (conductivity). The direct bandgap value is ranging from 0.50 to 0.74 and is decreasing with the replacement of Sr by Eu. The results divulge that both the compounds are optically active in the infrared region and optically anisotropic in nature and can be used as a shield for ultraviolet radiation and potential candidate for optoelectronic devices. Negative value of -383 and -411 µV/K Seebeck coefficients suggest that electrons are the majority charge carriers. Low thermal conductivity, high Seebeck coefficient and high power factor indicating that A3InAs3 (A = Sr and Eu) are the potential matrix for thermoelectric application.
1. Introduction
In order to overcome the energy crises over the world, it is necessary to enhance the harvest of current energy sources. The Carnot cycle limits the effectiveness of all thermal engines; therefore, the only way to gain an advantage is to take the dissipated heat that is being expelled into the environment. It is accomplished simply by catching the released heat that would otherwise be squandered in the environment. Through thermoelectricity, this wasted heat can be converted into a valuable source of electrical energy [Citation1,Citation2]. The power factor (PF) is frequently used to study thermoelectric properties in materials. High power factors can be achieved in compounds that obey the phonon glass electron crystal idea (PGEC). In these substances, the charge transportation is handled similar to that which occurred in ideal crystal [Citation2,Citation3]. Some compounds such as skutterudites, minerals and clathrates are best-known instances of materials obeying the PGEC concept. These materials are widely examined to find their thermoelectric uses in various fields. However, some of the Zintl phases possess tremendous thermoelectric features under the normal and high-temperature ranges, i.e. 500–1200 K. Various Zintl phases have structures as zero dimension, one dimension and two dimension polyanions and they are investigated for the power generation systems like A3BX3 A9B4+δX9, AB2X2, A5B2X6 and A14BX11, etc. In these systems, “A” indicates alkali or alkaline earth metals or simply rare earth metals, “B” represents transition elements and “X” denotes the elements of group-15 from “P” to “Bi” [Citation4]. In the aforementioned classes of Zintl pnictides, two classes A14BX11 and AB2X2 have their own special importance and they are discussed frequently. Among the best p-type Zintl materials, the A14BX11-class is mostly considered and performs appropriately in high-temperature range. Its figure of merit (ZT) value is greater than or equal to one [Citation5]. For instance, the value of ZT = 1 for Yb14MnSb11 under 1223 K temperature. For the Yb14Mn0.2Al0.8Sb11 material, their ZT value is about 1.3 under 1223 K temperature. The values of Seebeck Coefficient (α) and thermal conductivity (κ) are 250 μV/K and 0.5 W/m/K correspondingly [Citation6,Citation7]. Recently the materials AB2X2 type are mainly focused. Some of these materials are considered to devour both n and p-type dupability [Citation8]. There are many reports available about the structural properties of A3BX3 type pnictide materials, where A is alkaline earth element and nominally it is Eu divalent and B represents the elements of group 13 [Citation9–18]. The class A3BX3 is known to be very unique in sense of structure as it crystallizes in five different structures [Citation10,Citation13,Citation14,Citation18]. All the known structures are centred on BX4 tetrahedral. However, their interconnectivity is found to be very different from each other. The surprising outcomes are picked because of the difference of electro-negativities and atomic sizes. For instance, one can choose any structure among the following; Ba3AlAs3, Ba3GaAs3 and Ba3InAs3. In these structures, there is only variation of B atom which may vary from aluminium to Indium. The compound Ba3AlAs3 has orthorhombic structure and categories in Cmce-64 space group and the aspects dimeric Al2As6 units [Citation14]. It is isostructure with diborane B2H6 molecule [Citation16]. Two other materials Ba3GaAs3 and Ba3InAs3 also have orthorhombic structure with Pnma-62 space group. However, their structural properties are different. The first compound Ba3GaAs3 consists of 56 atoms per unit cell claims Ga2As6 fragments [Citation16] which are analogous to formerly discussed Al2As6 units. On contrary, the second compound Ba3InAs3 has a unit cell with 28 atoms and claims InAs4 tetrahedra are linked as infinite chains through corners [Citation15]. Almost similar structural trend noticed for Eu3BAs3 phases, where B may be Al or Ga. The compound Eu3AlAs3 has monoclinic structure with P21/c-14 space group and the Eu3GaAs3 phase has orthorhombic structure along the space group of Cmce-64. These two structures feature Al2As6 as well as Ga2As6 units, as mentioned earlier are arranged in different ways according to one-to-one prolonged symmetries [Citation18].
Thermoelectric properties of A3BX3 type materials are studied only for the p-type semiconductors like Sr3AlSb3 preserves p-type semiconductor nature along the higher values of α and κ, i.e. 470 μV/K and κ of 0.55 W/m/K, respectively, under 800 K temperature. The doped compounds Sr3Ga0.93Zn0.07Sb3 and Ca2.94Na0.06AlSb3 of that material have gained the attraction because of their ZT values ∼0.94 and 0.78, respectively, under 1000 K temperature. However, there is no information available on the n-type nature of 3-1-3 family of Zintl classes.
Recently Rajput et al. [Citation19] observed the unexpected n-type semiconductor Eu3InAs3 in A3BX3 family. This new A3BX3 composition expresses the n-type semiconductor behaviour without doping considerations. Moreover, the phase Eu3InAs3 is single crystalline solid having anonymously greater Seebeck coefficient, i.e. α ≈ −280 μV/K under RT (room temperature). These outcomes are found to be unprecedented showing the best-found value of n-type pnictides. The value of Mg3.2Bi0.49Te0.01Sb1.5 material is about −200 μV/K [Citation20]. Since, the Eu3InAs3 compound is an arsenide, can provide new pattern and essential hints about the construction of next-generation thermoelectric substances. The current investigation may provide fundamental ground to researchers working in this field.
A3InAs3 (A = Sr and Eu) is reported as a narrow bandgap semiconductor when crystallized in ortho-rhombic symmetry with space group Pnma (# 62) [Citation19]. Only Eu3InAs3 (A = Sr and Eu) Zintl phase compounds have been reported as n-type thermoelectric compounds based on the Seebeck Coefficient. There is no light shed on these compounds regarding their optical and thermoelectric properties, which motivate us to investigate the electronic, optical and thermoelectric performance of these materials for useful application in the framework of Density Functional Theory (DFT).
2. Computational detail
The FP-LAPW approach contained by DFT [Citation21,Citation22], as implemented in the WIEN2k package [Citation23], is used to examine the electronic and optical properties of A3InAs3 (A = Sr and Eu) compounds. DFT is the most accurate theory for manipulative solid-state electronic structure [Citation24–32]. For Sr3InAs3 and the addition of Hubbard U for Eu3InAs3, the exchange-correlation effects were treated by LDA [Citation33], and GGA [Citation34] while Modified Tran and Blaha Becke–Johnson (TB-mBJ) is used for enhanced calculation of optoelectronic properties having low computational cost [Citation35].
The unit cell is separated into interstitial and atomic sphere muffin-tin regions in the FP-LAPW technique. The potential is considered a plane wave outside the sphere, whereas, inside the atomic spheres, the potential is solved using spherical harmonics. The valance atomic states are separated from core states by cut-off energy of −6 Ry, and 1000 k-points were used throughout the Brillouin zone computations. In the interstitial region, the cut-off parameter RMT/Kmax were set to 8.0. The charge density is Fourier extended up to Gmax = 12/a.u. The valance wave function inside the muffin-tin spheres is extended up to lmax = 10. The self-interaction corrections (SIC) technique [Citation36] was used to calculate an approximated value of Ueff = U − J in which J = 0. In the instance of Eu3InAs3, different Hubbard U values were tested, and U = 7 eV/Eu was chosen for the current calculation, with the energy between iterations converging to 0.1 mRy and forces decreased to 1 mRy/Bohr. To calculate all of the transport parameters for the chemicals under investigation, the BoltzTrap algorithm is based on the Boltzmann transport semi-classical theory [Citation37].
3. Results and discussion
3.1. Electronic properties
A band has several different energy states in which an array of electrons is prohibited. Many physical features are linked to a material’s band structure, which can be better understood by illustrating the band structure (BS) [Citation38]. The BS for A3InAs3 (A = Sr and Eu) with Pnma space group shown in Figure are calculated using LDA and GGA potentials and LDA + U and GGA + U through R-Γ-X-M-Γ integration path. Conversely, mBJ and mBJ + U is also used for the estimation of electronic properties. For the understudy compounds, the estimated band structures and total density of state are shown in Figure . The Fermi level (EF) in the band structure is located between the valance and conduction bands at zero energy. Figure shows that these compounds’ valance and conduction bands are separated by a gap, confirming their semiconductor nature. Due to the lower conduction band (CB) meeting with the higher valence band (VB) at Γ symmetry point, both compounds are classified as “direct bandgap semiconductors” (DBGS). The calculated values of bandgap (Eg) are 0.58, 0.61 and 0.76 eV for Sr3InAs3 and 0.50, 0.60 and 0.74 eV for Eu3InAs3. The reported results for Sr3InAs3 are 0.58 and 0.64 eV using atomic sphere approximation and Arrhenius equation while 0.31 and 0.55 eV for Eu3InAs3 through Arrhenius equation and by Eg = 2e|αmax|Tmax relation [Citation19]. The Eg for these compounds are decline going from Sr to Eu due to increasing of atomic size and also rising with change in potential from LDA → GGA → mBJ. The calculated outcome is well accordance with the experimental reported results [Citation19] shows reliability of the present work and also comparable with results obtained for (0.78 eV) Ba3GaAs3, (0.5 eV) Ca3AlSb3 and (0.6 eV) Sr3GaSb3 [Citation16,Citation39–41]. The total density of states (TDOS) along with partial density of states (PDOS); d state of Sr/Eu and p state of In and As are also considered for these compounds to further clarify the semiconducting nature of the understudy compounds as shown in Figure (a–c) as 0 eV energy is taken as Fermi level (EF). Figure (a) shows the computed TDOS for the understudy compounds, confirming their semiconductor character by showing that the VB and CB does not overlapping the EF.
Figure 1. Crystal structure of A3InAs3 (A = Sr and Eu).
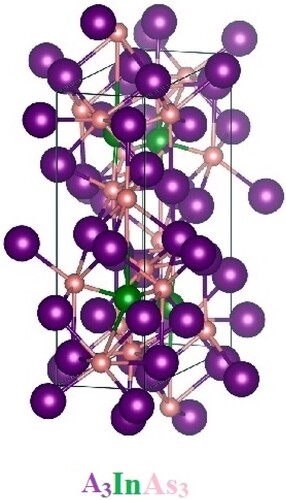
Figure 2. Electronic band structures along with total density of state up to −1 to 1 eV range of A3InAs3 (A = Sr and Eu).
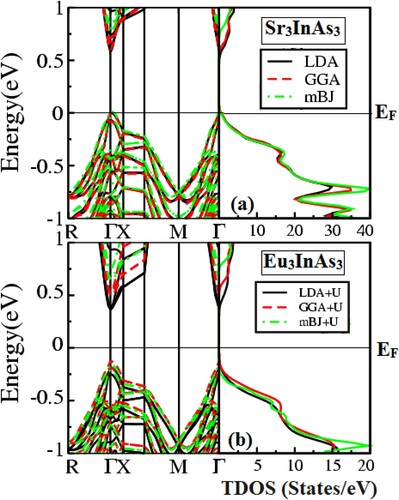
Figure 3. (a–c) Total and partial density of states of A3InAs3 (A = Sr and Eu).
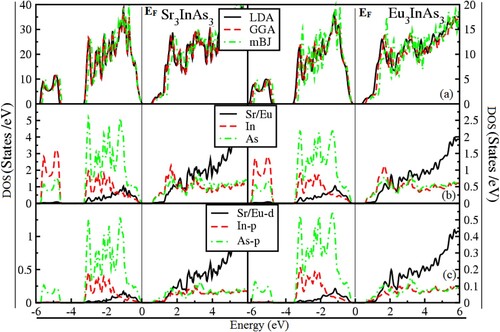
The TDOS consists of three sections in the energy range of −6 to 6 eV. The first section lies in the range of −6 to −5.33 eV, the second section lies in the range of −4.33–0 eV and the third section starts from the bang gap and reaches to 6 eV, respectively, for both compounds. From Figure (a,b), it is also clear that there is a variation in the density of states of both compounds going from LDA/LDA + U to mBJ/mBJ + U. In Sr base compound, the energy gap is sheeted from 0.58 to 0.61 and 0.76 eV and from 0.50 to 0.60 and 0.74 eV for Eu3InAs3, respectively, by LDA, GGA and mBJ without and with Hubbard U.
In order to find out the contribution to the total density of states, total densities of constituent elements of both the compounds are taken into account presented in Figure (b). From the figure, it is obvious that the section from −6 to −5.33 eV is contributed by In and As states while sections from −4.33 to 0 eV and from band gap to 6 eV are contributed by Sr/Eu, In and As, respectively, in both compounds with different contribution in valance and conduction band. To verify the basis of semiconducting character of A3InAs3 (A = Sr and Eu) compounds, their partial density of state (PDOS) is also considered shown in Figure (c). In Figure (c), it is clear that the contribution of Sr/Eu is due to d state and contribution of In and As is due to p state. The densities of both Sr/Eu-d and In/As-p states are composed of valance and conduction band. In valance band, density of As-p state shows greater contribution as compare to d and p state of Sr/Eu and In while in the conduction band density of Sr/Eu-d state shows greater contribution as compare to, p state of In and As. These compounds have an energy gap between the As-p states, as seen from the conduction and valence bands.
3.2. Optical properties
The optical response of a material to an optoelectronic application must be thoroughly examined. Therefore optical characteristics of the compounds A3InAs3 (A = Sr and Eu) are investigated along the three crystallographic axis (X, Y and Z), in the energy limit of 0–14 eV. In the current study, the optical parameters under investigation are real and imaginary parts of dielectric function (ϵ1 (ω) and (ϵ2 (ω)), reflectivity, refractive index and loss function presented in Figure (a–e). In Figure (a), the ϵ1 (ω) demonstrates different physical characteristic of the compound. The zero-frequency limit of ϵ1 (ω) referred to as static dielectric function (ϵ1 (0)). Figure (a) shows that the ϵ1 (0) lies in the range of 11.33–13.5, respectively, for both compounds. The static dielectric value for the X, Y and Z axis are 11.33, 11.66 and 12.0 for Sr3InAs3 and 12.96, 12.98 and 13.15 for Eu3InAs3 correspondingly as shown in Figure (a). Beyond the zero-frequency limit, as seen in Figure (a), the spectra grow and reach their highest peak at 2.32, 2.48 and 1.73 eV for Sr3InAs3 and 1.48, 1.3 and 1.2 eV for Eu3InAs3 correspondingly in crystallographic axis. For materials with dielectric properties, beyond the most significant peak, spectra begin to fall until they hit zero, at which point they become metallic.
Figure 4. (a–e) Optical parameters of A3InAs3 (A = Sr and Eu).
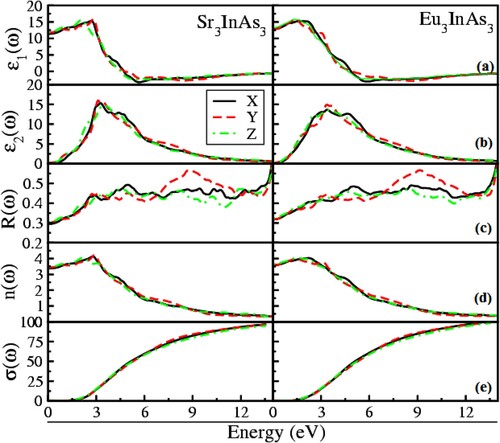
Figure 5. (a–e) Spacific part of optical parameters in spacific energy range of A3InAs3 (A = Sr and Eu).
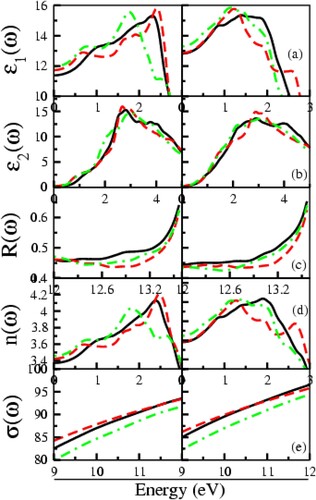
From Figure (b), the starting point of the ϵ2 (ω) is a threshold point correspond to the Eg of the compounds. It is obvious that after the threshold value the gap is falling from Sr to Eu in these compounds and optical Eg lies in the boundary of infrared region of electromagnetic spectrum make these materials as potential candidate as optoelectronic materials in infrared region. When the major inter-band transition occurs, the raise in curve is observed extremely quickly and reaches its highest peak at 2.80, 2.60 and 2.90 eV for Sr3InAs3 and 2.80, 2.75 and 2.81 eV for Eu3InAs3, respectively, in the X, Y and Z direction revealed from Figure (b).
The determined reflectivity (R (ω)) displayed in Figure (c) and visualized clearly in Figure (c) in the energy range of 12–13.8 eV. Figure (c) shows that the highest reflectivity of 63%–65% corresponds to Sr3InAs3 at 13.7 eV and 65%–67% correspond to Eu3InAs3 at 13.7 eV. Intriguingly, the reflectivity increases almost as much as when the ϵ1 (ω) decreases. In the ultraviolet, these materials’ high reflectivity can be utilized as a shield in opposition to extremely high-frequency radiations.
Figure (d) characterizes refractive index (n(ω)). The static value (n(0)) of n(ω) lies in the array of 3.38–3.65 correspondingly for both compounds A3InAs3 (A = Sr and Eu). From Figure (d), the value of n(0) is 3.38, 3.42 and 3.47 for Sr3InAs3 and 3.58 and 3.65 for Eu3InAs3 correspondingly in the X, Y and Z crystallographic axis. At energies between 1.0 and 2.0 eV, the real part of refractive will rise above its static value and reach its maximum value, respectively, for A3InAs3 (A = Sr and Eu). From Figure (d), it is clear that the static value of refractive index for Sr3InAs3 and Eu3InAs3 lies at 2.88, 2.97 and 1.8 eV, 1.98, 1.2 and 1.21 eV in X, Y and Z directions. The slowing of the greater number of photons when they interact with the materials causes to maximization of the refractive index of these compounds [Citation42].
One of the essential tools for determining how many electrons are involved in a material’s optical transition is the sum rule (σ (ω)). Figure (e) demonstrates that the oscillator strength of the under investigation compounds increases with the increase in energy.
Since there are no unoccupied electrons at lower energies, the σ (ω)) is zero, and electrons begin to rise rapidly at higher energies when energy exceeds the bang gap. The strength of the oscillator generally increases as the bandgap narrows. From Figure (e), it is clear that the oscillator strength shows that 92–94 and 94–97 effective electrons are concerned with optical transition correspondingly in deferent directions of A3InAs3 (A = Sr and Eu).
3.3. Thermoelectric properties
The thermoelectric generators are incredibly effective at converting heat energy into electrical energy. Consequently research into thermoelectric characteristics has significantly boosted in recent years (TE). There are numerous applications for thermoelectric materials, including computer cooling and TE refrigeration, and the design of small detector components. These materials’ thermoelectric properties must be studied to determine how well they work at high temperatures. There are semiconductors known as active thermoelectric materials with a small bandgap. The BoltzTrap programme examines transport characteristics based on the density of states and band topologies [Citation37]. Thermoelectric characteristics are examined in the current study in-between 0 and 750 K temperature range. Charges flow is measured by electrical conductivity (σ) and resistance to flow is calculated through electrical resistivity (ρ). The calculated ρ and σ are calculated by the removal of time factor of 1016 s and presented in Figure for both compounds A3InAs3 (A = Sr and Eu). For understudy compound, curve for electrical resistivity is decreasing with increasing temperature. The ρ of Eu3InAs3 follows the same trend as experimental result given as inset in Figure . On the other hand, electrical conductivity of these compounds is very small at low temperature and rises with enhance in temperature. In addition to increasing temperature, the σ also rises with the substitution of Eu for Sr in the circuit.
Figure 6. Electrical resistivity and conductivity versus temperature plot of A3InAs3 (A = Sr and Eu).
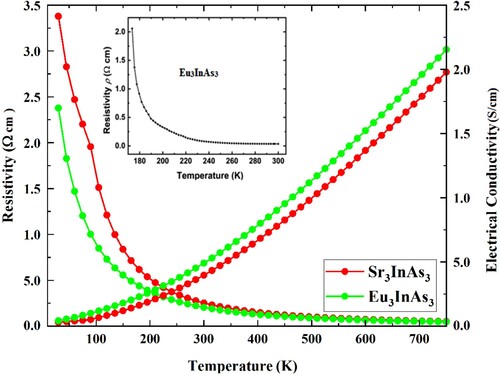
Due to the narrowing of the bandgap by cation substitution causes to increase σ. σ of these compounds are 3.96 and 4.90 S/cm at room temperature and 2.17 and 2.35 at 750 K going from Sr3InAs3 to Eu3InAs3. From both electrical resistivity and conductivity, it is also indicated that these compounds ate semiconductors in nature. Similar nature of ρ has also been reported for the iso-structural Zintl phase Eu3InP3 compound [Citation17]
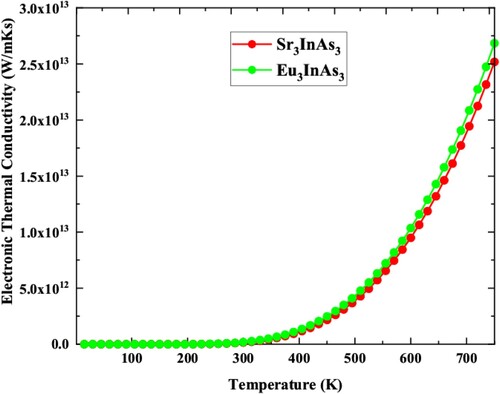
Electron conduction and lattice vibrations are two of the most common mechanisms for heat conduction in materials. The electronic part of thermal conductivity (Ke) for the compounds under investigation is computed using the BoltzTraP package as shown in Figure . The increase in Ke as temperature rises as seen from the figure. The Ke of the studied compounds are almost invariable at low temperatures and fluctuate as the temperature growing. The Ke for the understudy compounds are 1.84 × 10¹¹ and 1.85 × 10¹¹ W/mKs and 3.19 × 10¹³, 3.38 × 10¹³ at 300 and 800 K, respectively, for Sr3InAs3 and Eu3InAs3. The thermal conductivity of Eu3InAs3 is almost same at room temperature while higher at 750 K than the Sr3InAs3 compound.
Figure 7. Electronic thermal conductivity versus temperature plot of A3InAs3 (A = Sr and Eu).
The Lattice thermal conductivity (KL) for A3InAs3 (A = Sr and Eu) is calculated by famous Slack’s model [Citation43] as shown in Figure . The KL of the understudy compound is 0.981 and 0.987 W/mK at 750 K for A3InAs3 (A = Sr and Eu). The figure shows that the KL of all compounds is decline with raise in temperature. This signifies that there is low phonon–phonon interaction at lesser temperatures and raises at high temperatures. Thermoelectric voltage increases when two dissimilar materials are brought together at opposed temperatures. Voltage patterns are restricted when there is a temperature differential between two materials. Increased thermoelectric voltage is a sign of higher levels of efficiency when applied to a particular temperature gradient. The α determines the thermocouple’s efficiency by comparing voltage to the temperature differential. Computed value of α for A3InAs3 (A = Sr and Eu) is presented in Figure . -ive values of the α point out that the compounds are n-type semiconductors, whereas positive values suggest that they are p-type.
Figure 8. Lattice thermal conductivity versus temperature plot of A3InAs3 (A = Sr and Eu).
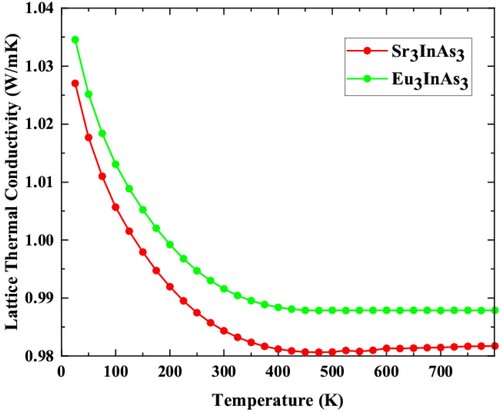
Figure 9. Seebeck coefficient versus temperature plot of A3InAs3 (A = Sr and Eu).
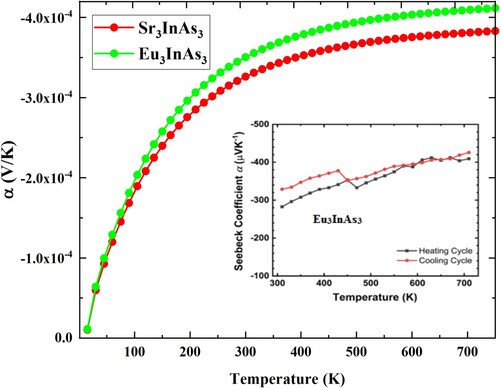
The α for A3InAs3 (A = Sr and Eu) is negative, verify their n-type semiconducting nature and indicate that electrons are the majority carrier in these compounds. For both compounds, α not only rises with increase in temperature but also with the replacement of Sr by Eu. Substituting Sr for Eu improves the thermoelectric performance of the compounds under study. The absolute value of −326 and −350 µV/K at room temperature and −383 and −411 µV/K at 750 K, respectively, for A3InAs3 (A = Sr and Eu). The reported results for Eu3InAs3 are will agreement with the experimental result [Citation19] given as inset in Figure therefore the result reported for Sr3InAs3 is rational and logical.
Comparatively most Zintl phase compounds show p-type performance and no A3BC3 n-type Zintl compounds have been reported so far. The greater calculated value (−383 and −411 µV/K) for the A3InAs3 (A = Sr and Eu) disclose that these compounds are potential candidate for thermoelectric applications analogous to other Zintl phase compounds having α of 180 μV/K forYb14MnSb11 [Citation6], 260 μV/K for Ca2.94Na0.06AlSb3 [Citation39], 470 μV/K for Sr3AlSb3 [Citation41], −310 μV/K for K0.995Ba0.005GaSb4 [Citation44], −85 μV/K for Ba3Cd2P4 [Citation45]. 200 μV/K for Ca5Al0.95In0.95Zn0.1Sb6 [Citation46], 185 μV/K for Eu11Cd4.5Zn1.5Sb12 [Citation47] and 270 μV/K for Ca9Zn4.6Sb9 [Citation48].
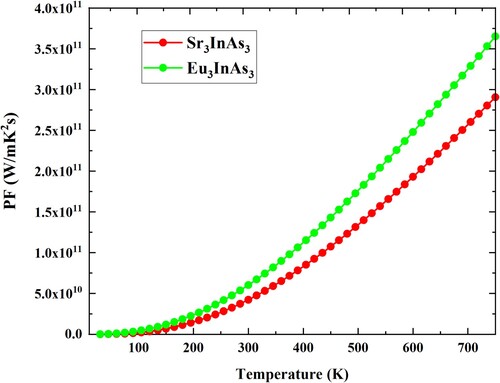
An additional thermoelectric property known as the power factor (PF) determines the ability of a material to produce power. Figure shows the calculated power factor for the understudy compounds concerning temperature. With temperature increase, the carrier concentration increases, resulting in an overall increase in the Power Factor of all molecules. Highest value of PF at 300 K for A3InAs3 (A = Sr and Eu) compounds are 4.22 × 10¹⁰ and 6.02 × 10¹⁰ at 300 K and 2.90 × 10¹¹ and 3.65 × 10¹¹ at 800 K, respectively.
Figure 10. Power factor versus temperature plot of A3InAs3 (A = Sr and Eu).
4. Conclusions
The electronic, optical and thermoelectric properties of orthorhombic Sr3InAs3 and Eu3InAs3 Zintl phase compounds are studied using the FP-LAPW method, and DFT potentials such as LDA, GGA, and GGA-mBJ. According to the BS and DOS, all compounds are centrally symmetric direct bandgap semiconductors. It is estimated that the direct bandgap ranges from 0.50 to 0.74 eV and decreases with atomic replacement from Sr to Eu while increasing with the transition from LDA to mBJ. Evidence suggests that all of the compounds studied are optically active and anisotropic, indicating that they could be helpful in optoelectronic devices and UV protection. Therefore, their thermoelectric properties, such as electrical and thermal conductivity, Seebeck coefficient, and power factor, are computed. According to the Seebeck coefficient, electrons make up the majority of the charge carriers in these materials. These compounds, which have high Seebeck coefficients and power factors, are excellent candidates for use as active thermoelectrics. Its poor heat conductivity makes it an ideal starting point for developing novel thermoelectric materials.
Acknowledgement
The authors express their gratitude to Princess Nourah bint Abdulrahman University Researchers Supporting Project (Grant No. PNURSP2022R124), Princess Nourah bint Abdulrahman University, Riyadh, Saudi Arabia. Moreover, we would like to thank Taif University Research Supporting Project number (TURSP-2020/63), Taif University, Taif, Saudi Arabia.
Disclosure statement
No potential conflict of interest was reported by the author(s).
Data availability statement
Data sharing is not applicable to this article as no data sets were generated during the present study.
Additional information
Funding
References
- Snyder GJ, Toberer ES. Complex thermoelectric materials. Nat Mater. 2008;7:105–114.
- Slack GA. New materials and performance limits from thermoelectric cooling. In: Rowe DM. (Ed.) CRC handbook of thermoelectrics. Boca Raton (FL): CRC Press; 1995. p. 407–440.
- Beekman M, Morelli DT, Nolas GS. Better thermoelectrics through glass-like crystals. Nat Mater. 2015;14:1182–1185.
- Ovchinnikov A, Bobev S. Zintl phases with group 15 elements and the transition metals: a brief overview of pnictides with diverse and complex structures. J Solid State Chem. 2019;270:346–359.
- Hu Y, Cerretti G, Wille ELK, et al. The remarkable crystal chemistry of the Ca14AlSb11 structure type, magnetic and thermoelectric properties. J Solid State Chem. 2019;271:88–102.
- Brown SR, Kauzlarich SM, Gascoin F, et al. Yb14MnSb11: new high efficiency thermoelectric material for power generation. Chem Mater. 2006;18 (7):1873–1877.
- Toberer ES, Cox CA, Brown SR, et al. Transition in a Zintl phase: rational enhancement of thermoelectric efficiency in Yb14Mn1-xAlxSb11. Adv Funct Mater. 2008;18 (18):2795–2800.
- Zheng L, Li W, Sun C, et al. Ternary thermoelectric AB2C2 Zintls. J Alloys Compd. 2020;821:153497.
- Cordier G, Schafer H. Ca3AlAs3 – an intermetallic analogue of the chain silica. Angew Chem. 1981;93 (7):466–466.
- Cordier G, Savelsberg G, Schafer H. Zintlphasen Mit .. Komplexen Anionen: Zur Kenntnis von Ca3AlAs3 and Ba3AlSb3. Z Naturforsch B. 1982;37:975–980.
- Cordier G, Stelter M, Schäfer H. Zintlphasen Mit Komplexen Anionen: Zur Kenntnis von Sr6Al2Sb6. J Less Common Met. 1984;98:285–290.
- Cordier G, Schafer H, Stelter M. Ca3AlSb3 and Ca5Al2Bi6, Zwei Neue Zintlphasen Mit Kettenförmigen Anionen.Z Naturforsch B. 1984;39:727–732.
- Cordier G, Schafer H, Steher M. Neue Zintlphasen: ba3gasb3, Ca3GaAs3 und Ca3InP3. Z Naturforsch B. 1985;40 (9):1100–1104.
- Cordier G, Schafer H, Stelter M. Sr3GaSb3 and Sr3InP3, two new Zintl phases with complex anions. Z Naturforsch B. 1987;42 (10):1268–1272.
- Somer M, Cabrera WC, Peters K, et al. Crystal structure of tribarium triarsenidoindate, Ba3InAs3. Z Kristallogr N Cryst Struct. 1996;211 (9):632.
- Stoyko S, Voss L, He H, et al. Synthesis, crystal and electronic structures of the pnictides AE3TrPn3 (AE = Sr, Ba; Tr = Al, Ga; Pn = P, As). Crystals (Basel). 2015;5 (4):433–446.
- Jiang J, Payne AC, Olmstead MM, et al. Complex magnetic ordering in Eu3InP3: a new rare earth metal Zintl compound. Inorg Chem. 2005;44 (7):2189–2197.
- Radzieowski M, Stegemann F, Klenner S, et al. On the divalent character of the Eu atoms in the ternary Zintl phases Eu5In2Pn6 and Eu3MAs3 (Pn=As-Bi; M=Al, Ga). Mater Chem Front. 2020;4 (4):1231–1248.
- Rajput K, Baranets S, Bobev S. Observation of an unexpected n-type semiconducting behavior in the New Ternary Zintl phase Eu3InAs3. Chem Mater. 2020;32 (22):9616–9626.
- Tamaki H, Sato HK, Kanno T. Isotropic conduction network and defect chemistry in Mg3+2-based layered Zintl compounds with high thermoelectric performance. Adv Mater. 2016;28 (46):10182–10187.
- Hohenberg P, Kohn W. Inhomogeneous electron gas. Phys Rev B. 1964;136 (3B):864–871.
- Kohn W, Sham LJ. Self-consistent equations including exchange and correlation effects. Phys Rev. 1965;140 (4A):A1133–A1138.
- Blaha P, Schwarz K, Tran F, et al. WIEN2k: an augmented plane waves plus local orbitals program for calculating the properties of solid. J Chem Phys. 2020;152 (7):07410130.
- Berri S. Theoretical study of physical properties of Ba3B(Nb,Ta)2O9 (B = Mg, Ca, Sr, Cd, Hg, Zn, Fe, Mn, Ni, Co) perovskites. Comp Condense Mater. 2021;29:e00595. doi:10.1016/j.cocom.2021.e00595.
- Berri S. Half-metallic and thermoelectric properties of Sr2EuReO6. Comp Condense Mater. 2021;28:e586. doi:10.1016/j.cocom.2021.e00586.
- Berri S. Computational study of structural, electronic, elastic, half-metallic and thermoelectric properties of CoCrScZ (Z = Al, Si, Ge, and Ga) quaternary Heusler alloys. J Supercond Nov Magn. 2020;33 (12):3809–3818. doi:10.1007/s10948-020-05638-4.
- Elahmar MH, Rached H, Rached D. The half metallic feature at high temperature of the novel half-Heusler alloys and their [100] oriented layered superlattices: a DFT investigations. Mater Chem Phys. 2021;15:124712. doi:10.1016/j.matchemphys.2021.124712.
- Rached AA, Babu MMH, Rached H, et al. Prediction of a new Sn-based MAX phases for nuclear industry applications: DFT calculations. Mater Today Cammun. 2021;27:102233. doi:10.1016/j.mtcomm.2021.102233.
- Rached AA, Rached H, Ouadha' I, et al. The vanadium-doping effect on physical properties of the Zr2AlC MAX phase compound. Mater Chem Phys. 2021;260:124189. doi:10.1016/j.matchemphys.2020.124189.
- Rached H. Prediction of a new quaternary Heusler alloy within a good electrical response at high temperature for spintronics applications: DFT calculations. Int J Quantum Chem. 2021;121 (12):e26647. doi:10.1002/qua.26647.
- Hadji T, Khalfoun H, Rached H, et al. Ab-initio prediction of high TC half-metallic ferrimagnetism in Li-based Heusler compounds Mn2LiZ (Z = Si, Ge and Sn). Comp Condense Mater. 2021;27:e00557. doi:10.1016/j.cocom.2021.e00557.
- Belasri A, Rached D, Rached H, et al. The half metallic behavior at high temperature of highly spin-polarized V-based Heusler alloy: DFT calculations. Eur Phys J B. 2021;94(110). doi:10.1140/epjb/s10051-021-00127-6
- Perdew JP, Zunger A. Self-interaction correction to density-functional approximations for manyelectron systems. Phys Rev B. 1981;23 (10):5048–5079.
- Perdew JP, Burke K, Wang Y. Generalized gradient approximation for the exchange-correlation hole of a many-electron system. Phys Rev Lett. 1996;54:16533.
- Tran F, Blaha P. Accurate band gaps of semiconductors and insulators with a semilocal exchange-correlation potential. Phys Rev Lett 2009;102 (22):226401.
- Tsuneda T, Hirao K. Self-interaction corrections in density functional theory. J Chem Phys. 2014;140(18):18A5131–13.
- Madsen GKH, Sing DJ. Boltztrape: a code for calculations band structure dependent quantities. Comput Phys Commun. 2006;175(1):67–71.
- Vidal J, Lany S, Davezac M, et al. Band-structure, optical properties, and defect physics of the photovoltaic semiconductor SnS. Appl Phys Lett. 2012;100 (3):032104.
- Zevalkink A, Toberer ES, Zeier WG, et al. Ca3AlSb3 an inexpensive, non-toxic thermoelectric material for waste heat recovery. Energy Environ Sci. 2011;4 (2):510–518.
- Zevalkink A, Zeier WG, Pomrehn G, et al. Thermoelectric properties of Sr3GaSb3 – a chain-forming Zintl compound. Energy Environ Sci. 2012;5 (10):9121–9128.
- Zevalkink A, Pomrehn G, Takagiwa Y, et al. Thermoelectric properties and electronic structure of the Zintl phase Sr3AlSb3. Chem Sus Chem. 2013;6 (12):2316–2321.
- Ullah I, Murtaza G, Khenata R, et al. Structural and optoelectronic properties of X3ZN (X = Ca, Sr, Ba; Z = As, Sb, Bi) anti-perovskite compounds. J Electro Mater. 2016;45 (6):3059–3068.
- Slack GA. The thermal conductivity of nonmetallic crystals. J Appl Phys Solid State Phys. 1979;34(1). doi:10.1016/S0081-1947(08)60359-8.
- Ortiz BR, Gorai P, Stevanovic V, et al. Thermoelectric performance and defect chemistry in n-type Zintl KGaSb4. Chem Mater. 2017;29 (10):4523–4534.
- Balvanz A, Baranets S, Bobev S. Synthesis and structural characterization of the new Zintl phases Ba3Cd2P4 and Ba2Cd2P3. Rare example of small gap semiconducting behavior with negative thermopower within the range 300 K-700 K. J Solid State Chem. 2020;289:121476–121479.
- Zevalkink A, Swallow J, Ohno S, et al. Thermoelectric properties of the Ca5Al2-xInxSb6 solid solution. Dalton Trans. 2014;43 (42):15872–15878.
- Kazem N, Hurtado A, Sui F, et al. High temperature thermoelectric properties of the solid-solution Zintl phase Eu11Cd6-xZnxSb12. Chem Mater. 2015;27 (12):4413–4421.
- Ohno S, Aydemir U, Amsler M, et al. Achieving ZT > 1 in Inexpensive Zintl phase Ca9Zn4 + xSb9 by phase boundary mapping. Adv Funct Mater. 2017;27 (20):1606361.