
ABSTRACT
In this study, green synthesis of monometallic (Ag) and bimetallic (Ag-Ni) nanoparticles is carried out. UV-Visible spectra illustrated peaks at 463 and 429 nm for monometallic and bimetallic nanoparticles. FTIR spectra analysis revealed the presence of different functional groups. SEM and EDX elaborated on the morphology and indicate the presence of respective elemental peaks. XRD data calculations predicted the size of monometallic and bimetallic to be 42 and 25 nm. In the end, the biosynthesized nanoparticles are used as a spectrophotometric probe for the determination of cupric ions. Different parameters are studied and optimized on a standard aqueous solution. Monometallic nanoparticles showed an optimum response in a slightly alkaline medium within 12.5 min of contact time for 8 μM analyte concentration. While bimetallic nanoparticles attained this target in a shorter contact time with a higher concentration value. Then these optimized conditions are utilized for the determination of cupric ions in real water samples.
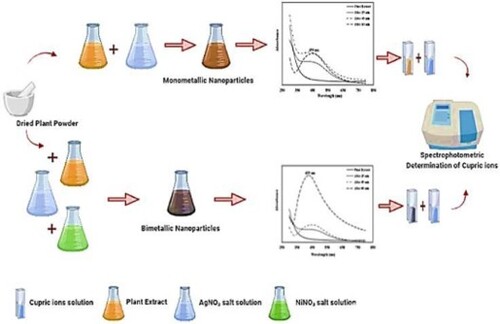
GRAPHICAL ABSTRACT
1. Introduction
Due to the great environmental and biological impacts of heavy metal ions, various analytical methods have been developed for their determination. Major anthropogenic sources of these pollutants are the paper industry, the electronic industry and the combustion of fossil fuels [Citation1]. These heavy metal ions can bioaccumulate and pose serious health issues. Copper is an important transition element present in the human body. It is also found in our bodies in the form of cytochrome oxidase, superoxide dismutase and tyrosine metalloenzymes [Citation2,Citation3]. Beyond a certain limit, increased concentration of Cu+2 ions in our body causes various diseases including hypertension and severe damage to vital organs (respiratory system, liver and kidney) [Citation4].
Developing a selective method for the quantification of copper ions in environmental samples is very important. In the literature, different physiochemical methods, such as molecular fluorescence spectroscopy [Citation5,Citation6], atomic absorption spectroscopy [Citation7,Citation8], chemiluminescence [Citation9], inductively coupled plasma mass spectrometry [Citation10], ion exchange chromatography [Citation11], electrochemical methods [Citation12] and spectrophotometric methods, have been reported to determine the cupric ions in water samples. Spectrophotometric methods are based on a colour complex formation process using different reagents such as resorcinol [Citation13], 2,5-dimercapto or 1,3,5-diathiozole. However, all these methods require sophisticated and expensive equipment, skilled operators and time-consuming protocols. From this perspective, it is a dire need to report an efficient and selective method for the determination of cupric ions in real samples.
During the past few years, gold and silver nanoparticles-based colorimetric probes have been utilized for the estimation of different pollutants including metallic ions [Citation14]. They had earned quite an attention in diversified fields of analysis due to their simple fabrication process, low cost and sensitive nature [Citation15]. The response of these colorimetric probes is based on their surface plasmon resonance properties. Interaction of these sensing materials with the analyte leads to changes in their absorbance-based spectrum and eventually this change can be related to the determination of environmental pollutants. Recently selective determination of aluminium, copper, mercury, ferric, cadmium, nickel and lead has been carried out by sensors capped with various molecules such as glutathione, lysine, N-acetyl-l-cysteine, mercaptosuccinic acid, sulfosalicylic acid, citrate, azacrown ether and valine [Citation16–23]. Reported nanoparticle-based sensing probes are based on chemical synthetic routes, thus making them non-ecofriendly approaches.
Micro-organisms or plants are commonly exploited in green route-based nanoparticle synthesis. Currently, this is the most preferred method because it is low cost, does not produce toxic by-products and is eco-friendly [Citation24–26]. Micro-organisms employed for the synthesis of nanoparticles require a culture media and specific conditions that are difficult to maintain [Citation27]. In comparison to micro-organisms, plants act as a better substitute as they contain a large variety of phytochemicals that can act as reducing and capping agents in the formation of metallic nanoparticles [Citation28].
In this study, green synthesis of silver-based monometallic and bimetallic nanoparticles is carried out and the prepared material is further applied for the spectrophotometric determination of cupric ions. In the end, these prepared monometallic and bimetallic nanoparticles-based sensors are tested in real samples to evaluate their efficiency.
The plant extract of Araucaria bidwilli is used to prepare silver monometallic and silver-nickel bimetallic nanoparticles. Araucaria bidwilli belongs to the genus of evergreen coniferous trees. It is mostly used as an ornamental plant in urban areas of Pakistan. It is also used as a medicinal plant for the treatment of amenorrhoea. The reported studies illustrate that major phytochemical constituents in Araucaria bidwilli are carbohydrates, alkaloids, steroids, terpenoids, saponins, flavonoids and glycosides [Citation29].
2. Experimental section
2.1. Chemicals
Silver nitrate (AgNO3), nickel nitrate (Ni(NO3)2), copper sulphate (CuSO4.5H2O) and other chemical reagents were purchased from Sigma Aldrich, Pakistan and used without further purification.
2.2. Collection of plant
A plant sample (Araucaria bidwilli) was collected from the field area of Government College Women University, Sialkot (32.5028° N, 74.5305° E), Pakistan. The plant was identified and authenticated by a taxonomist of the Botany Department at Government College Women University, Sialkot, Pakistan.
2.3. Preparation of plant extract
The collected plant material was thoroughly washed with distilled water and shade dried. Afterwards, it was crushed and gronded to a fine powder. The plant extract was prepared in a conical flask (250 mL) using 5 g of powdered plant and 100 mL of distilled water. The respective mixture was boiled at 70 °C for 15 min with continuous stirring. In the end, it was cooled at room temperature. The cooled mixture was filtered using Whatman's No.1 filter paper. The plant extract thus obtained was stored at 4°C. By repeating the above-mentioned steps, the further plant extract was prepared for use throughout the work [Citation30].
2.4. Preparation of silver monometallic nanoparticles
In order to prepare silver (Ag) nanoparticles, 20 mL of plant extract was added to the 100 mL of silver nitrate (2 mM) solution in a flask. The mixture thus obtained was stirred continuously and heated at 75°C under specific pH conditions. Eventually colour of the reaction mixture changes showing the formation of Ag nanoparticles [Citation30].
Ag nanoparticles were collected by centrifugation (Hemel Z207A, Germany) at 3500 rpm for 20 min. Collected nanoparticles were washed thrice with water and ethanol on an alternate basis in order to remove the soluble impurities. In the end, these were dried in an oven and stored in Eppendorf tubes till further use.
2.5. Preparation of silver nickel bimetallic nanoparticles
Silver-nickel (Ag-Ni) bimetallic nanoparticles were prepared by adding 20 mL plant extract to the equal molar (2 mM) concentration mixture of 100 mL silver nitrate and 100 mL nickel nitrate solution in a flask. The mixture thus obtained was heated at 70°C for 15 min with continuous stirring until the colour of the reaction mixture changed. This change in colour depicts the formation of silver-nickel bimetallic nanoparticles [Citation31].
The synthesized bimetallic nanoparticles were collected by centrifugation (Hemel Z207A, Germany) at 3500 rpm for 20 min. These were washed with distilled water and ethanol alternatively for the removal of soluble impurities. Finally, collected nanoparticles were oven dried and stored in Eppendorf tubes.
2.6. Characterization of synthesized nanoparticles
UV visible spectrum, (Specord 210 plus Analytik Jena, Germany) of monometallic and bimetallic nanoparticles, was recorded within the wavelength range of 300–800 nm in order to study their optical properties. FTIR (Nicolet 6700, Thermo Fisher Scientific, US) spectra revealed the nature of major chemical constituents within the spectral range of 4000 cm−1–400 cm−1 at a resolution of 2 cm−1. Surface morphology was studied using scanning electron microscopy (JCM-6000 Neoscope, JEOL Ltd, Japan), while elemental analysis was carried out with EDX coupled with SEM. Powdered X-ray diffraction (Philips PANalytical powder) analysis was carried out to evaluate the crystalline nature and phase purity of synthesized monometallic and bimetallic nanoparticles using CuKα (1.54 A°) radiation between the 2θ range of 10°−100°. The particle size of prepared nanoparticles was also calculated using the XRD data and Debye-Scherrer's formula.
2.7. Sensing of cupric ions
Determination of Cu+2 ions was done using a standard solution of copper sulphate (1 mM). Solutions of varying concentration (0.3–0.8 µM) were added into 3 mL of monometallic or bimetallic nanoparticles (0.02 mg/mL). After a definite time interval, there was a visual change in the colour of the mixture [Citation32]. The absorption spectrum of the resulting mixture was recorded using a UV-Visible spectrophotometer.
Different experimental parameters, such as pH, time of contact, ionic strength, concentration and selectivity studies using different metallic ion solutions, were optimized during the spectrometric determination of the analyte.
2.8. Real sample analysis
Initially, optimization of experimental parameters was done on the standard solution of cupric ions. Afterwards, reported sensors were employed for the analysis of cupric ions in real water samples using the spike recovery method [Citation33]. Tap water samples were collected from the lab and filtered to remove any suspended impurities in them. Next, water samples were spiked with a definite concentration of cupric ions solution and analysed with Ag and Ag-Ni bimetallic nanoparticles separately. Percent recovery was calculated from their absorbance values. The results are listed in Table .
3. Results and discussion
3.1. Characterization of synthesized nanoparticles
UV–Vis spectroscopic analysis is a widely used technique to monitor the synthesis of monometallic and bimetallic nanoparticles [Citation34,Citation35]. Due to the optical property of nanoparticles, a spectrum is obtained within the UV-visible range. These optical properties are controlled by the size and shape of nanoparticles. Biosynthesized nanoparticles depicted a peak in the UV-visible range, as shown in Figure (a,b).
Figure 1. The UV-visible spectrum of silver nanoparticles (a) and the UV-visible spectrum of Ag-Ni bimetallic nanoparticles (b).
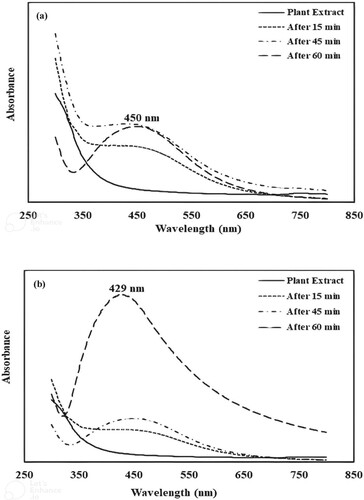
Due to the reduction of silver and nickel ions, the colour of the reaction mixture is changed. At different time intervals, the spectra of monometallic and bimetallic nanoparticles are recorded. Electronic transitions within the nanoclusters resulted due to the surface plasmon resonance phenomenon and confirmed the formation of monometallic and bimetallic nanoparticles [Citation25,Citation31,Citation36].
For silver nanoparticles, the plasmon band at 450 nm is observed, while for silver nickel bimetallic nanoparticles, the band appeared at a wavelength value of 429 nm. In comparison to bimetallic nanoparticles, colloidal silver depicts a peak at a longer wavelength value. These observations support the larger particle size of monometallic nanoparticles. In both cases, the appearance of a broad band suggests poly-dispersed structures and aggregation phenomena. The absorption spectrum of bimetallic nanoparticles depicts a single band elaborating the formation of Ag-Ni nanoparticles rather than the mixture of monometallic nanoparticles. Furthermore, it resembles with UV visible spectrum of silver nanoparticles. This favours the formation of nickel-silver core-shell nanoparticles. Similar results have been reported in the literature [Citation25,Citation37,Citation38].
Different functional groups present in the plant extract of Araucaria bidwilli are responsible for the fabrication of silver and silver nickel bimetallic nanoparticles as depicted by FTIR spectra (Figure (a–c)).
Figure 2. The FTIR spectrum of Araucaria bidwilli plant extract (a); the FTIR spectrum of silver nanoparticles (b) and the FTIR spectrum of Ag-Ni bimetallic nanoparticles (c).
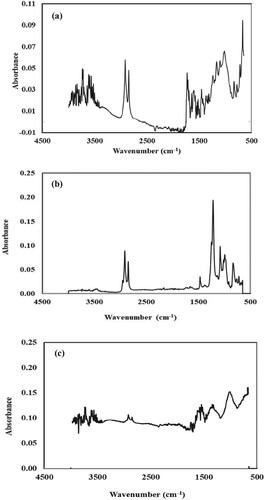
Figure (a) illustrates the FTIR spectrum of plant extract. This spectrum showed various peaks that indicate the presence of different functional groups which act as stabilizing and reducing agents in the synthesis of nanoparticles. The broad absorption band at 3735 and 3723 cm−1 is due to O–H stretching vibrations in H-bonded alcohols. Sharp peaks at 3597 and 3615 cm−1 are also due to the O-H stretching of H- bonded alcohols. The medium peak at 3565 cm−1 shows the N–H stretching of primary amines. The peak at 2916 cm−1 connotes sp3 hybridized carbon which refers to the symmetrical and asymmetrical C–H vibrations present in alkanes [Citation39]. The peak at 2848 cm−1 represents C–H stretching in aldehydes. Another peak at 1731 cm−1 is due to C=O stretching in α, β unsaturated ester. The prominent peak at 1238 cm−1 is due to the stretching of C=O in a carboxylic acid. The peak at 1167 cm−1 is due to the stretching of S=O in sulfonamides. The peak at 1103 cm−1 depicts glycosidic C–O–C linkage. The medium peak at 1018 cm−1 is due to the stretching of C–N in amines. While the medium peak at 834 cm−1 is due to the bending of C=C in alkene and the absorption peak at 720 cm−1 is due to C–H bending vibrations in monosubstituted benzene [Citation40].
FTIR analysis of plant extract demonstrated the presence of biomolecules such as aliphatic alkenes, alkaloids, aliphatic amine, phenolic contents and terpenoids.
FTIR spectrum of silver nanoparticles is shown in Figure (b). In comparison to the above-mentioned spectrum, a sharp peak at 3700–3500 cm−1 disappeared because the OH groups have facilitated the synthesis of silver nanoparticles [Citation41]. Similarly, peaks at 1731 and 1735 cm−1 also disappeared. Some new peaks at 1468, 1081 and 991 cm−1 are also observed which shows the interaction between different functional groups and silver ion solution [Citation42]. The overall result is that most of the functional groups of phytochemical constituents present in the extract have been successfully utilized in the synthesis of nanoparticles.
FTIR spectrum of Ag-Ni bimetallic nanoparticles is presented in Figure (c) This spectrum depicts that some of the peaks in the range of 3400–1600 cm−1 and 834–720 cm−1 disappeared because the various functional groups of these regions have facilitated the synthesis of bimetallic nanoparticles, while some new peaks also appeared at 3838, 3735, 1373, 1575, 1552, 1540, 1522, 1338, 1316 and 1006 cm−1 [Citation43].
All these data show that various functional groups have participated in the reduction and stabilization of metal ions.
SEM images of synthesized Ag-NPs (Figure (a–d)) indicated that the nanoparticles are well dispersed and roughly spherical. In the case of Ag NPs, agglomeration can be seen due to more chances of collision at higher concentrations. Due to different functional groups of phytochemical participants which help in stabilizing the nanoparticles, a few nanoparticles have deviated from their shape [Citation44].
Figure 3. SEM images of silver monometallic nanoparticles (a–d): 500 nm (a); 1 µm (b), 2 µm (c) and 5 µm (d) and SEM images of silver nickel bimetallic nanoparticles (e-h): 500 nm (e); 1 µm (f); 2 µm (g) and 5 µm (h).
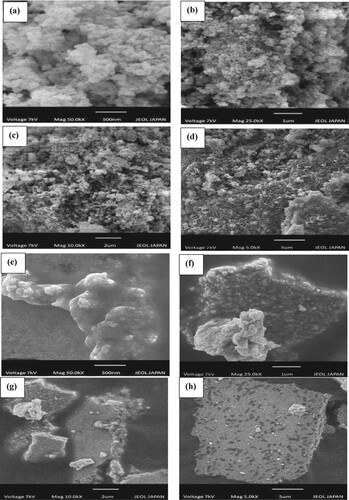
SEM images of Ag-Ni bimetallic nanoparticles (Figure (e–h)) showed that cluster-shaped allied bimetallic nanoparticles are formed [Citation45].
EDX analysis revealed the presence of various fundamental elements in the synthesized nanoparticles. EDX spectrum confirmed the formation of silver nanoparticles (Figure (a)) with distinct peak at 3 keV representing Ag-L emission [Citation46]. The elemental percentage composition of the Ag NPs shows 76.39% silver content and 23.61% oxygen content, as shown in Table .
Figure 4. The EDX spectrum of monometallic nanoparticles (a) and the EDX spectrum of bimetallic nanoparticles (b).
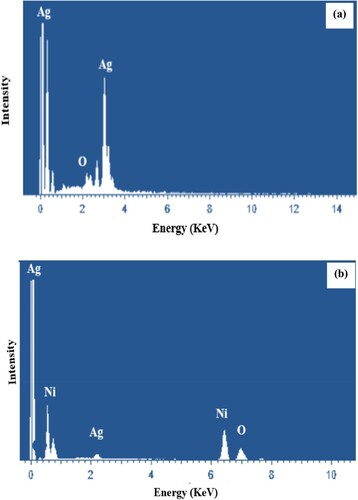
Table 1. Elemental composition percentage of Ag nanoparticles.
While for bimetallic nanoparticles (Figure (b)), distinct peaks for silver and nickel are observed. Silver produced a distinct peak around 3 keV while nickel peaks appeared around binding energy values of 0.9 and 8 keV. These correspond to the Ni-L and Ni-Kα characteristics lines [Citation47]. Elemental percentage composition depicts 56.47% silver, 38.96% nickel and 4.57% oxygen, as shown in Table . Both the EDX spectra depict the oxygen peak referring to the biomolecules preferably bonded to the surface of nanoparticles or present in the vicinity of metallic nanoparticles. No peak of other impurities has been observed.
Table 2. Elemental composition percentage of Ag-Ni bimetallic nanoparticles.
X-ray diffraction is used to determine the crystalline nature of synthesized Ag and Ag -Ni bimetallic nanoparticles. The average size of nanoparticles is calculated using XRD data and Debye-Scherrer's formula. XRD spectra of green synthesized Ag and Ag-Ni bimetallic nanoparticles are shown in Figure (a,b).
Figure 5. X-ray diffractogram of silver monometallic nanoparticles (a) and X-ray diffractogram of silver nickel bimetallic nanoparticles (b).
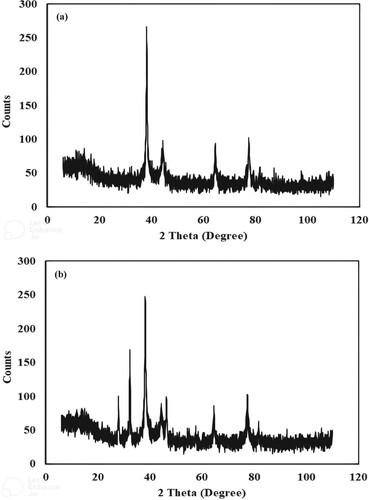
XRD spectrum (Figure (a)) of silver monometallic nanoparticles showed four prominent peaks at 2θ values of 37.0°, 43.0°, 64.0° and 78.0°. These peaks correspond to (111), (200), (220) and (311) crystallographic planes. This depicts face-centred cubic structure for the synthesized nanoparticles. Data are consistent with the powdered diffraction standard (JCPDS) file No (04-0783) [Citation43]. Literature studies reported similar results [Citation44]. The calculated average size of prepared silver nanoparticles is 42 nm.
The XRD spectrum of silver nickel bimetallic nanoparticles prepared using the plant extract of Araucaria bidwilli is shown in Figure (b). This spectrum shows prominent peaks at 2θ values of 27°, 33°, 38° 44°, 46°, 64° and 77°. Few peak values are quite similar to that reported in the above spectrum (Figure (a)). According to a reported study, the XRD spectrum of nickel nanoparticles shows strong Bragg reflections at 2θ values of 38°, 44° and 64° with (003), (012) and (104) planes. This rhombohedral pattern is similar to standard JCPDS card No. ICSD-ID-00-022-1189 [Citation45]. The average size of Ag-Ni bimetallic nanoparticles is 25 nm.
3.2. Optimization of different experimental conditions for the determination of cupric ions in real samples
3.2.1. Effect of pH
Optimum pH plays an important role in the interaction of metal ions with monometallic and bimetallic nanoparticles. In order to check the effect of pH on the sensing of cupric ions. Solutions having different pH values in the range of 2–12 were prepared using 0.1 M HCl and 0.1 M NaOH solution. 0.1 mL Cu+2 solution of a fixed concentration with a definite pH value and 3 mL nanoparticles dispersion was mixed . After a definite time interval (30 min), there is a visible change in the colour of the solution. Absorbance values of these solutionsare given in Figure (a).
Figure 6. (a) Effect of pH on spectrophotometric determination of cupric ions using silver nanoparticles (AgNPs) and silver nickel nanoparticles (Ag-Ni NPs) (Conditions: concentration of cupric ions = 8 µM, volume of cupric ions = 0.1 mL, volume of nanocomposite = 3 mL and time of contact = 30 min); (b) Effect of time on spectrophotometric determination of cupric ions using silver nanoparticles (AgNPs) and silver nickel nanoparticles (Ag-Ni NPs) (Conditions: concentration of cupric ions = 8 µM, volume of cupric ions = 0.1 mL, volume of nanocomposite = 3 mL); (c) Effect of ionic strength on spectrophotometric determination of cupric ions using silver nanoparticles (AgNPs) and silver nickel nanoparticles (Ag-Ni NPs). (Conditions: concentration of cupric ions = 8 µM, volume of cupric ions = 0.1 mL, volume of nanocomposite = 3 mL, volume of NaCl = 0.1 mL and concentration of NaCl = 200–1000 µM); (d) Effect of copper concentration on spectrophotometric determination of cupric ion using silver nanoparticles (AgNPs) and silver nickel nanoparticles (Ag-Ni NPs) (Conditions: volume of cupric ions = 0.1 mL, volume of nanocomposite = 3 mL) and (e) Selectivity studies for spectrophotometric determination of cupric ions using silver nanoparticles (AgNPs) and silver nickel nanoparticles (Ag-Ni NPs) (Conditions: concentration of cupric or other metallic ions = 10 µM, volume of cupric ions or other metallic ions = 0.1 mL and volume of nanocomposite = 3 mL).
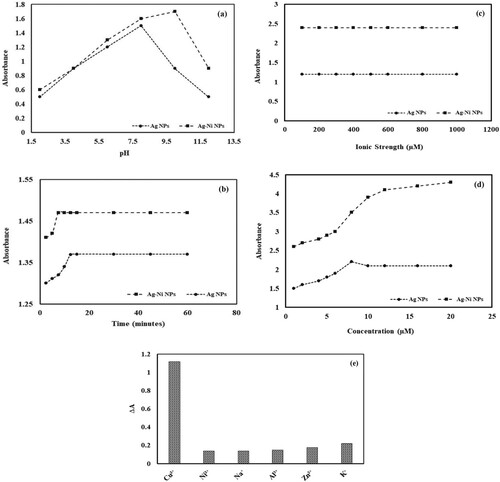
In the case of monometallic nanoparticles, there is an increase in absorbance values within the pH range of 6–8. This is due to the absence of the protonation process. Due to this, more favourable conditions are available for the complex formation between the Cu+2 and the silver nanoparticles. This behaviour can be attributed to the fact that with an increase in pH the process of sorption increases between the analyte and the respective nanoparticle surface. After that, a decrease is observed, because desorption takes place. In more alkaline conditions the sensing of cupric ions decreases because of the formation of copper hydroxide which does not further take part in aggregate formation [Citation48].
In the case of bimetallic nanoparticles, a continuous increase is observed within the pH range of 6–10. While a further increase in pH decreases the absorbance values. This behaviour can be attributed to the fact that with an increase in pH the process of sorption increases between the cupric ions and Ag-Ni NPs. After that decrease can be attributed to the desorption procedure. A pH range of 8–10 is considered optimum for the detection of cupric ions [Citation49].
Keeping in view the above discussion it is concluded that the determination of cupric ions can be carried out at pH 6–8 in the case of Ag nanoparticles, while with Ag-Ni NPs it can be carried out within the pH range of 8–10. However, absorbance values for bimetallic nanoparticles are a bit higher than the monometallic nanoparticles depicting their greater interaction mode with the cupric ions.
3.2.2. Effect of reaction time
During the spectrophotometric determination of cupric ions, optimum reaction time is considered an essential factor [Citation50]. In order to investigate the effect of reaction time on the response of monometallic or bimetallic nanoparticles towards the analyte, the absorption of nanoparticles was measured at different time intervals after the addition of Cu+2. In this experiment, 3 mL of Ag or Ag–Ni nanoparticles was mixed with 0.1 mL of Cu+2 solution (8 µM). Their absorbance values were noted within 2–60 min. Data are presented in Figure (b). It can be seen from Figure (b) that the silver nanoparticles-based probe achieved maximum interaction within 12.5 min. On the other hand, Ag-Ni bimetallic nanoparticles attained optimum response within 7.5 min. This is due to the difference in their particle size. Smaller particle sizes of bimetallic nanoparticles allowed maximum interaction within a short time.
3.2.3. Effect of ionic strength
One of the most important factors is the impact of ionic strength on the spectrophotometric determination of metal ions using NPs. In order to determine the role of ionic strength in sensing cupric ions, NaCl of various concentrations (200, 400, 500, 600, 800 and 1000 µM) was prepared. These solutions were then added to a definite volume of Cu+2 (8 µM) and Ag or Ag-Ni bimetallic nanoparticles dispersion. After a fixed time, their absorbance values were noted using a UV-visible spectrophotometer. Data are illustrated in Figure (c). It shows that there is no positive or negative effect of ionic strength on the determination of Cu+2.
Interaction between the analyte and binding sites of the prepared sensors is sensitive to the changes in ionic strength if the association mode is electrostatic attraction based. Figure (c) depicts that retention of cupric ions is not dependent on electrostatic interaction. In fact, it seems to be more dependent on covalent interaction with the prepared sensors. Further ionic strength can also influence the activity coefficient of cupric ions but this effect also seems to be negligible at the initial concentration used in this study [Citation51].
3.2.4. Effect of analyte concentration
Another factor that plays a crucial role in the sensing of Cu+2 ions using nanoparticles as sensing probes is the concentration of Cu2+. In order to evaluate the effect of concentration, different solutions (1, 2, 4, 6 8, 12, 16 and 20 µM) were prepared. To 0.1 mL of these solutions, 3 mL of monometallic or bimetallic nanoparticle suspension was added. After the optimum time interval, there is a visual change in colour from dark brown to colourless. The absorbance of all these solutions was determined by a UV-Visible spectrophotometer and presented in Figure (d).
It can be seen that in the case of monometallic nanoparticles, the value of absorbance increases with an increase in concentration up to 8 µM. Afterwards, the SPR peak gradually attenuated. This depicts that the rate of aggregation between nanoparticles and cupric ions is proportional to the concentration of cupric ions up to a certain limit (8 µM). On the other hand, bimetallic nanoparticles depict linear relation up to the concentration of 12 µM and afterwards it become almost constant. The limit of detection (LOD) calculated for the linear range of monometallic and bimetallic nanoparticles is 4.31 µM and 6.1 µM, respectively. Bimetallic nanoparticles exhibit linearity over a wide concentration range. However, monometallic nanoparticles depict lower detection limits than bimetallic nanoparticles. This could be because analyte attachment tends to facilitate the probability of aggregation more in bimetallic impairing the achievement of a lower detection limit.
Basically, an increase in the concentration of cupric ions facilitates the aggregation between cupric ions and nanoparticles. However, as the number of nanoparticles remains constant, thus a point reaches where all the binding sites have been pre-occupied. Eventually, a further increase in concentration does not lead to the augmentation of absorbance value [Citation52].
3.2.5. Selectivity studies
In order to determine the selectivity of proposed probes, the interaction of different ions towards mono- or bimetallic nanoparticles is recorded. For this purpose, 3 mL (0.02 mg) mono- or bimetallic nanoparticles was added to the 0.1 mL of solution containing 10 µM concentration of Ni+2, Fe+3, Zn+2, Al+3, K+1, Na+1 or Cu2+. After an optimum time, their absorbance values were recorded. It can be seen from Figure (e) that only Cu+2 caused a significant change in the absorbance value of mono- or bimetallic nanoparticles.
While in the case of all other metallic ions, a small shift in absorbance values is observed. It can be concluded that other metal ions did not cause any considerable change in the SPR peak absorbance value of Ag and Ag-Ni bimetallic nanoparticles in an aqueous solution. This is probably due to the formation of a stable coordination complex of cupric ions with the carboxylate functional moiety of prepared materials. Thus, these nanoparticles can act as suitable spectrophotometric probes for Cu+2.
It can be concluded that bimetallic nanoparticles have depicted better performance than monometallic nanoparticles in standard solutions of cupric ions. This is in accordance with other reported studies [Citation53–55]. In our study, this can be explained on two bases. Firstly this could be due to the smaller particle size of bimetallic nanoparticles. Secondly, bimetallic (Ag-Ni) nanoparticles probably followed the silver core and nickel shell strategy due to the large difference in their reduction potential values. They further experience lattice strain due to differences in their lattice parameters and this could probably contribute to enhanced activity [Citation56].
3.2.6. Determination of Cu+2 in real water samples
Tap water samples were used as real samples to assess the efficiency of monometallic and bimetallic nanoparticles for the spectrometric determination of cupric ions. These tap water samples were spiked with different concentrations of cupric ions from 0.6 to 5 µM. Table depicts that recovery percentage for monometallic nanoparticles falls within the range of 99–105%, while for bimetallic it is 98–103%. This shows that the prepared material acts as a suitable sensing probe for the determination of cupric ions in real samples.
Table 3. Determination of Cu+2 in the real water sample.
4. Conclusion
Mono- and bimetallic nanoparticles are synthesized by rapid, single step and eco-friendly methods using the plant extract of Araucaria bidwilli. Different phytochemicals in the plant extract acted as capping, reducing and stabilizing agents. The UV-Visible spectrum of Ag nanoparticles showed maximum absorption in the range of 450–500 nm and Ag-Ni bimetallic in the range of 430–500 nm. SEM images and XRD revealed cluster-like structures of synthesized monometallic and bimetallic nanoparticles with irregular edges with average sizes of 42 and 25 nm. Elemental composition analysis of synthesized nanoparticles indicated the presence of silver and nickel content. Prepared Ag and Ag-Ni bimetallic nanoparticles are used for the sensing of cupric ions. The efficiency of synthesized nanoparticles is optimized by different parameters. Ag and Ag-Ni bimetallic nanoparticles showed an optimum response in basic medium with a contact time of 12.5 and 7.5 min, respectively. Thus, it can be concluded that these nanoparticles have potential applications in environmental pollutant analysis.
Disclosure statement
No potential conflict of interest was reported by the author(s).
Data availability statement
All data generated or analysed during this study are included in this submitted manuscript.
References
- Feng L, Zhang Y, Wen L, et al. Colorimetric determination of copper (II) ions by filtration on sol–gel membrane doped with diphenylcarbazide. Talanta. 2011;84(3):913–917.
- Peers G, Price MN. Copper-containing plastocyanin used for electron transport by an oceanic diatom. Nature. 2006;441(7091):341–344.
- Awual MR, Hasan MM. Colorimetric detection and removal of copper (II) ions from wastewater samples using tailor-made composite adsorbent. Sens Actuators B: Chem. 2015;206:692–700.
- Valentine JS, Hart JP. Misfolded CuZnSOD and amyotrophic lateral sclerosis. Proc Natl Acad Sci. 2003;100(7):3617–3622.
- Bian WF, Wang H, Zhang H, et al. Fluorescent probe for detection of Cu2+ using core-shell CdTe/ZnS quantum dots. Luminescence. 2015;30(7):1064–1070.
- Fernández-Argüelles MT, Jin JW, Costa-Fernández JM, et al. Surface-modified CdSe quantum dots for the sensitive and selective determination of Cu (II) in aqueous solutions by luminescent measurements. Anal Chim Acta. 2005;549(1–2):20–25.
- Ghaedi MF, Ahmadi F, Shokrollahi A. Simultaneous preconcentration and determination of copper, nickel, cobalt and lead ions content by flame atomic absorption spectrometry. J Hazard Mater. 2007;142(1–2):272–278.
- Akl MAA, Kenawy MMI, Lasheen RR. Organically modified silica gel and flame atomic absorption spectrometry: employment for separation and preconcentration of nine trace heavy metals for their determination in natural aqueous systems. Microchem J. 2004;78(2):143–156.
- Sorouraddin MH, Iranifam M, Imani-Nabiyyi A. A novel captopril chemiluminescence system for determination of copper (II) in human hair and cereal flours. J Fluoresc. 2009;19(4):575–581.
- Larner F, Rehkämper M, Coles JB, et al. A new separation procedure for Cu prior to stable isotope analysis by MC-ICP-MS. J Anal At Spectrom. 2011;26(8):1627–1632.
- Vanatta LE, Vanatta JC, Riviello J. Ion-chromatographic study of the possible absorption of copper and zinc by the skin of Rana pipiens. J Chromatogr A. 2000;884(1–2):143–150.
- Willemse CM, Tlhomelang K, Jahed N, et al. Metallo-graphene nanocomposite electrocatalytic platform for the determination of toxic metal ions. Sensors. 2011;11(4):3970–3987.
- Mir SA. Resorcinol method for colorimetric micro determination of copper in pure forms. Inter J Chem Tech Res. 2011;3(2):661–670.
- Beiraghi A, Babaee S, Roshdi M. A selective optical sensor for beryllium determination based on incorporating of 1, 8-dihydroxyanthrone in a poly (vinyl chloride) membrane. J Hazard Mater. 2011;190(1–3):962–968.
- Oliveira E, Núñez C, Santos MH, et al. Revisiting the use of gold and silver functionalised nanoparticles as colorimetric and fluorometric chemosensors for metal ions. Sens Actuators B. 2015;212:297–328.
- Baig FMM, Chen TC, Chen CY. Photoluminescence determination of aluminum using glutathione capped gold nanoclusters. Anal Lett. 2016;49(14):2246–2258.
- Yang X, Yang L, Dou Y, et al. Synthesis of highly fluorescent lysine-stabilized Au nanoclusters for sensitive and selective detection of Cu2+ ion. J Mater Chem. 2013;1(41):6748–6751.
- Duan J, Jiang X, Ni S, et al. Facile synthesis of N-acetyl-L-cysteine capped ZnS quantum dots as an eco-friendly fluorescence sensor for Hg2+. Talanta. 2011;85(4):1738–1743.
- Komova NS, Serebrennikova KV, Berlina AN, et al. Mercaptosuccinic acid functionalized gold nanoparticles for highly sensitive colorimetric sensing of Fe(III) ions. Chemosensors. 2021;9:290, DOI:10.3390/chemosensors9100290.
- Jin W, Huang P, Wu F, et al. Ultrasensitive colorimetric assay of cadmium ion based on silver nanoparticles functionalized with 5-sulfosalicylic acid for wide practical applications. Analyst. 2015;140:3507–3513.
- Almaquer FEP, Ricacho JSY, Ronquillo RLG. Simple and rapid colorimetric sensing of Ni(II) ions in tap water based on aggregation of citrate-stabilized silver nanoparticles. Sustain Environ Res. 2019;29:23, DOI:10.1186/s42834-019-0026-3.
- Kakhki MR, Rakhshanipour M. Application of nanoparticle modified with crown ether in colorimetric determinations. Arab J Chem. 2019;12(8):3096–3107.
- Priyadarshini E, Pradhan N. Metal-induced aggregation of valine capped gold nanoparticles: an efficient and rapid approach for colorimetric detection of Pb2+ ions. Sci Rep. 2017;7(1):9278, DOI:10.1038/s41598-017-08847-5.
- Yu C, Tang J, Liu X, et al. Green biosynthesis of silver nanoparticles using Eriobotrya japonica (thunb.) leaf extract for reductive catalysis. Materials (Basel). 2019;12(1):189, DOI:10.3390/ma12010189.
- Akinsiku AA, Dare OE, Ajanaku OK, et al. Modeling and synthesis of Ag and Ag/Ni allied bimetallic nanoparticles by green method: optical and biological properties. Inter J Biomater. 2018;2018:9658080, DOI:10.1155/2018/9658080.
- Narayanan KB, Sakthivel N. Green synthesis of biogenic metal nanoparticles by terrestrial and aquatic phototrophic and heterotrophic eukaryotes and biocompatible agents. Adv Colloid Interface Sci. 2011;169(2):59–79.
- Dan Z, Xin-Lei M, Yan G, et al. Green synthesis of metallic nanoparticles and their potential applications to treat cancer. Front Chem. 2020;8:799, DOI: 10.3389/fchem.2020.00799.
- Naikoo AG, Mustaqeem M, Hassan UI, et al. Bioinspired and green synthesis of nanoparticles from plant extracts with antiviral and antimicrobial properties: a critical review. J Saudi Chem Soc. 2021;25(9):101304, DOI:10.1016/j.jscs.2021.101304.
- Frezza C, Venditti A, Vita DD, et al. Phytochemistry, chemotaxonomy, and biological activities of the Araucariaceae family—a review. Plants. 2020;9(7):888, DOI:10.3390/plants9070888.
- Ashraf A, Zafar S, Zahid K, et al. Synthesis, characterization, and antibacterial potential of silver nanoparticles synthesized from Coriandrum sativum L. J Infect Public Health. 2019;12(2):275–281.
- Riaz T, Mughal P, Shahzadi T, et al. Green synthesis of silver nickel bimetallic nanoparticles using plant extract of Salvadora persica and evaluation of their various biological activities. Mater Res Express. 2020;6(12):126452. DOI:10.1088/2053-1591/ab74fc.
- Beiraghi A, Najibi-Gehraz AS. Carbon dots-modified silver nanoparticles as a new colorimetric sensor for selective determination of cupric ions. Sens Actuators B. 2017;253:342–351.
- Zaib M, Malik T, Akhtar N, et al. Sensitive detection of sulphide ions using green synthesized monometallic and bimetallic nanoparticles: comparative study. Biomass Waste Valorization. 2022;13:2447–2459. DOI: 10.1007/s12649-021-01665-x.
- Ambreen J, Al-Harbi FF, Sakhawat H, et al. Fabrication of poly (N-vinylcaprolactam-co-acrylic acid)-silver nanoparticles composite microgel with substantial potential of hydrogen peroxide sensing and catalyzing the reduction of water pollutants. J Mol Liq. 2022;355:118931.
- Siddiq M, Bakhat K, Ajmal M. Stimuli responsive microgel containing silver nanoparticles with tunable optical and catalytic properties. Pure Appl Chem. 2020;92(3):445–459.
- Garibo D, Borbon-Nunez HA, de León JND, et al. Green synthesis of silver nanoparticles using Lysiloma acapulcensis exhibit high-antimicrobial activity. Sci Rep. 2020;10:12805, DOI:10.1038/s41598-020-69606-7.
- Padilla-Cruz AL, Garza-Cervantes JA, Vasto-Anzaldo XG, et al. Synthesis and design of Ag–Fe bimetallic nanoparticles as antimicrobial synergistic combination therapies against clinically relevant pathogens. Sci Rep. 2021;11:5351, DOI:10.1038/s41598-021-84768-8.
- Fakhri A, Tahami S, Naji M. Synthesis and characterization of core-shell bimetallic nanoparticles for synergistic antimicrobial effect studies in combination with doxycycline on burn specific pathogens. J Photochem Photobiol B. 2017;169:21–26.
- Harshiny M, Matheswaran M, Arthanareeswaran G, et al. Enhancement of antibacterial properties of silver nanoparticles–ceftriaxone conjugate through Mukia maderaspatana leaf extract mediated synthesis. Ecotoxicol Environ Safety. 2015;121:135–141.
- Chekin F, Vahdat MS, Asadi JM. Green synthesis and characterization of cobalt oxide nanoparticles and its electrocatalytic behavior. Russ J Appl Chem. 2016;89(5):816–822.
- Khodashenas B, Ghorbani HR. Synthesis of silver nanoparticles with different shapes. Arab J Chem. 2019;12(8):1823–1838.
- Alagumuthu G, Kirubha R. Synthesis and characterization of silver nanoparticles in different medium. Open J Synthesis Theory Applications. 2012;01(02):13–17.
- Khalil HMM, Ismail HE, El-Baghdady ZK, et al. Green synthesis of silver nanoparticles using olive leaf extract and its antibacterial activity. Arab J Chem. 2014;7(6):1131–1139.
- Padalia H, Moteriya P, Chanda S. Green synthesis of silver nanoparticles from marigold flower and its synergistic antimicrobial potential. Arab J Chem. 2015;8(5):732–741.
- Uddin S, Safdar BL, Anwar S, et al. Green synthesis of nickel oxide nanoparticles from Berberis balochistanica stem for investigating bioactivities. Molecules. 2021;26(6):1548, DOI: 10.3390/molecules26061548.
- Femi-Adepoju AG, Dada AO, Otun KO, et al. Green synthesis of silver nanoparticles using terrestrial fern (Gleichenia pectinata (Willd.) C. presl.): characterization and antimicrobial studies. Heliyon. 2019;5(4):e01543, DOI:10.1016/j.heliyon.2019.e01543.
- Zhang Y, Mahdavi B, Hosseini MM, et al. Green synthesis of NiO nanoparticles using Calendula officinalis extract: chemical characterization, antioxidant, cytotoxicity, and anti-esophageal carcinoma properties. Arab J Chem. 2021;14(5):103105, DOI:10.1016/j.arabjc.2021.103105.
- Shang Y, Wu F, Qi L. Highly selective colorimetric assay for nickel ion using N-acetyl-l-cysteine-functionalized silver nanoparticles. J Nanoparticle Res. 2012;14:1169, DOI:10.1007/s11051-012-1169-x.
- Sadollahkhani A, Hatamie A, Nur O, et al. Colorimetric disposable paper coated with ZnO@ ZnS core–shell nanoparticles for detection of copper ions in aqueous solutions. ACS Appl Mater Inter. 2014;6(20):17694–17701.
- Dutta S, Ray C, Sarkar S, et al. Facile synthesis of bimetallic Au-Pt, Pd-Pt, and Au-Pd nanostructures: enhanced catalytic performance of Pd-Pt analogue towards fuel cell application and electrochemical sensing. Electrochim Acta. 2015;180:1075–1084.
- Musso BT, Parolo EM, Pettinari G. Ph, ionic strength, and ion competition effect on Cu (II) and Ni (II) sorption by a Na-bentonite used as liner material. Pol J Environ Stud. 2019;28(4):2299–2309.
- Yuan Z, Cai N, Du Y, et al. Sensitive and selective detection of copper ions with highly stable polyethyleneimine-protected silver nanoclusters. Anal Chem. 2014;86(1):419–426.
- Mahmood K, Amara U, Siddique S, et al. Green synthesis of Ag@CdO nanocomposite and their application towards brilliant green dye degradation from wastewater. J Nanostructure Chem. 2022;12(3):329–341.
- Naeem H, Ajmal M, Khan ZS, et al. Anionic hydrogel fabricated with metal nanoparticles: highly efficient and easily recyclable catalysts. Soft Mater. 2021;19(4):480–494.
- Ajmal M, Siddiq M, Aktas N, et al. Magnetic Co-Fe bimetallic nanoparticle containing modifiable microgels for the removal of heavy metal ions, organic dyes and herbicides from aqueous media. RSC Adv. 2015;5(54):43873–43884.
- Chen D, Li C, Liu H, et al. Core-shell Au@Pd nanoparticles with enhanced catalytic activity for oxygen reduction reaction via core-shell Au@Ag/Pd constructions. Sci Rep. 2015;5:11949, DOI:10.1038/srep11949.