
 ?Mathematical formulae have been encoded as MathML and are displayed in this HTML version using MathJax in order to improve their display. Uncheck the box to turn MathJax off. This feature requires Javascript. Click on a formula to zoom.
Abstract
Currently, statins, the β-hydroxy-β-methyl-glutaryl-CoA reductase (HMG-R) inhibitors, are widely used to lower cholesterol, nevertheless, they have several side effects. Consequently, the present study is designed to unravel the cardioprotective role of selected natural monoterpenoids (carvacrol and geraniol) via in-vitro targeting and molecular informatics study of HMG-R. Computational molecular informatics study revealed that carvacrol and geraniol efficiently occupies the catalytic site of HMG-R with the binding affinity (ΔG) of −4.60, and −1.99 Kcal/mol, respectively, and molecular mechanical-generalized Born surface area (MM-GBSA) free binding energy was depicted as −17.05 and −29.48 Kcal/mol, respectively. Further, molecular dynamics simulation was carried out for 100 ns. Carvacrol and geraniol potentially and competitively inhibit the in-vitro HMG-R activity with an IC50 value of 78.23 ± 2.21 µM, and 72.91 ± 2.92 µM, respectively. Thus, both carvacrol and geraniol exhibited significant anti-hypercholesterolemic activity while the molecular simulation studies depicted that the GR complex showed better stability than the carvacrol complex.
1. Introduction
Amid other progressive and non-communicable diseases; atherosclerotic cardiovascular diseases (ASCVDs) are the major universal health concern as well as the foremost reason for mortalities. However, the average number of ASCVD cases are rising globally every day [Citation1,Citation2]. Several cardiac health-associated risk factors i.e. hypertension, elevated levels of total cholesterol (TC), triglycerides (TG), lipoproteins and inflammation influenced the ASCVD severity [Citation3]. Despite the existence of other risk factors, raised low-density lipoprotein (LDL-C) is still a major cause of cardiac health conditions [Citation2]. The altered LDL-C (oxidized-LDL and glycated LDL) is more efficient in the progression of atherosclerotic plaque than unmodified LDL-C and about 70% of circulatory LDL is cleared by hepatic LDL receptor (LDL-R), and their transcriptional activators, sterol regulatory element binding proteins (SREBPs) [Citation4,Citation5].
Moreover, hepatic 3-hydroxy-3-methyl-glutaryl-CoA reductase (HMG-R) is the rate-limiting enzyme of cholesterol homeostasis, the foremost target for ASCVD management [Citation3,Citation6,Citation7]. Presently, the statins are most widely prescribed inhibitors of HMG-R. However, statins have several side effects like statin intolerance, the most common problem in traditional preclinical practice [Citation1,Citation8]. Even though the mortality rate has dropped, more than 70% of ASCVD events are occurring regardless of statin therapeutic strategies. The adverse event caused by the statins indicates an urgent need for novel and safer drugs for cholesterol-lowering via targeting the HMG-R. Natural compounds, specially, plant-derived secondary metabolites received a lot of attention due to their medicinal properties including their less toxicity and cost efficiency. In this milieu, various plant extracts and phytochemicals have been screened for their hypolipidemic activity via targeting HMG-R [Citation7,Citation9–12].
Moreover, essential oils extracted from aromatic plants are a rich source of bioactive metabolites such as carvacrol (CR) and geraniol (GR), commonly referred to as monoterpenes (Figure ). CR (C10H14O), a monoterpenoid phenol mainly found in the Carum copticum L., Origanum vulgare L., Zataria multiflora Boiss., Thymus vulgaris L., Nigella sativa L., Lepidium flavum Torr. [Citation13–16]. The Federal Drug Administration (FDA) and the Council of Europe have approved its use as an antimicrobial, and flavouring agent in foods [Citation17–20]. Several pharmacological properties of CR are well known like antiviral, antibacterial, anticancer, anti-inflammatory, antidiabetic and insecticides [Citation21–37].
Figure 1. 2D-Schematic chemical structure of Geraniol and Carvacrol.
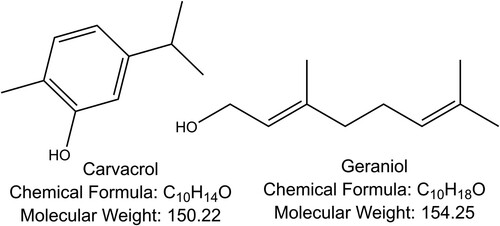
On the other hand, GR (C10H18O), a monoterpene alcohol, is majorly found in Monarda fistulosa, Ninde, Rose, Citronella and Palmarosa oil [Citation38–42]. GR has distinct pharmacological properties such as antioxidative, anti-inflammatory, cardioprotective and neuroprotective [Citation43–45]. Based on the above discussion, the present study is designed to unravel the cardioprotective role of selected natural monoterpenoids (carvacrol and geraniol) via molecular informatics study and in-vitro targeting of HMG-R.
2. Material and methods
2.1. Chemicals
Purified monoterpenoids i.e. CR, GR and HMG-R activity assay kit was procured from Sigma Aldrich, USA. Other chemicals were procured from HiMedia Lab. Pvt. Ltd., India and are of analytical grade.
2.2. Absorption, distribution, metabolism and excretion (ADME) profiling of monoterpenes, carvacrol and geraniol
The physiochemical and pharmacokinetic property of selected ligands was evaluated by using a web server preADME (https://preadmet.qsarhub.com/) [Citation46]. On the basis of whether or not they complied with Lipinski's rule of five, Egan, Veber and Pians rules, the ligands were further examined for their drug-like qualities [Citation47].
2.3. Predicted toxicity of the monoterpenes, carvacrol and geraniol
Toxicity analysis was completed via using the ProTox-II (https://tox-new.charite.de/protox_II/index.php?site = compound_input), a web server that forecasts the toxicity of minor compounds. It offers plentiful details of the compounds including LD50, Carcinogenicity, Immunotoxicity, Mutagenicity Cytotoxicity as well as most important Hepatotoxicity [Citation48].
2.4. Molecular docking simulation study platform
The in-silico investigation and visualizations were accomplished on a personal Lenovo machine with Intel (R) Core-i5, 8th gen processor equipped dedicated 2GB NVIDIA GeForce MX250 graphics card. The following software was utilized for this study GraphPad prism 8, Schrodinger’s (v 12.8) Maestro, and Desmond.
2.5. Ligand’s structure retrieval and preparation
The 3D structure of the CR and GR was retrieved from the PubChem (http://pubchem.ncbi.nlm.nih.gov) database. The retrieved 3D structure.sdf files were incorporated in the Maestro workspace and all the ligands were minimized with the help of the LigPrep module by applying the OPLS_2005 force field for the molecular docking studies. The Epik module was utilized for possible ionization and tautomer of selected structures originated at pH 7.0 +/− 2.0 [Citation49,Citation50].
2.6. Retrieval and preparation of human HMG-R for docking
The 3D structure of the Human HMG-R (PDB-ID: 1HW8, resolution of 2.10Å) [Citation51], protein was downloaded from the Protein Data Bank http://www.rcsb.org/ [Citation52]. We prepared our docking target protein was prepared using the protein preparation wizard's of Schrödinger's Maestro module. The assignment of hydrogen bonds (H-bonds), bond orders, addition of hydrogen atoms, optimization and minimization, removal of water beyond five angstroms from the het group, and conversion of selenomethionines to methionines were important steps in the preparation. Further, pH 7.0 +/− 2.0 was used to fill the loop and then pre-processed with the protein. To refine the targeted protein, the OPLS_2005 force field was applied and converging complete heavy atoms to a root mean square deviation (RMSD) of 0.30 with the help of the protein preparation module Maestro v12.8. Using the SiteMap tool, a highly potential binding pocket of ligands on proteins was identified.
2.7. Receptor grid generation
The sitemap tool in the Maestro v12.8 module was used by means of Goodford's GRID algorithm. This tool provides the available regions in the target binding site for ligands [Citation53,Citation54]. The five-ligand binding site was identified by Sitemap, for generation of the receptor grid, we elect the highest site score and size of the volume to make a grid on the binding site and chosen a van der Waal's radius scaling of 1.0 with 0.25 partial charges cut-off by default. The retrieved receptor (1HW8) has a crystallographic native ligand in the identical binding site. Since both SiteMap's generated active pocket and co-crystalized ligand with IHW8 showed similar active sites. The receptor grid generation was made by using the “pick to identify the ligand molecule” method in the Glide module [Citation55,Citation56].
2.8. Molecular docking studies of carvacrol and geraniol
We used the Maestro’s Glide module to access the binding pattern of CR and GR compounds against the target protein. The previously prepared receptor grid file and prepared ligand file were input in the Glide module of protein–ligand docking and by leaving all the fields in default mode the job was submitted. Post molecular docking, the ligand binding position examination and construction of data were done with the help of Maestro 12.8 [Citation57,Citation58].
2.9. Analysis of MM-GBSA score
The molecular mechanical-generalized Born surface area (MM-GBSA) score for the estimation of binding free energies of selected ligands with the receptor proteins by using the Prime MM-GBSA module of Schrodinger. The OPLS_2005 force field and variable dielectric surface generalized born (VSGB) solvation model were utilized in this process [Citation59,Citation60]. Finally, the binding free energy of a protein–ligand complex was computed using the following equation:
Where, ΔGBind, ΔGCoulomb, ΔGvdW, ΔGCovalent, ΔGH-bond, ΔGSol_Lipo, ΔGSolv_GB, ΔGPacking and ΔGSelf-contact represent total free energy of protein–ligand complex, Coulombic free energy, van der Waals’ interactions free energy, covalent bonds free energy, hydrogen bonds free energy, the free energy of the surface area, Solvation free energy, packing free energy and free energy of self-contact respectively. MM-GBSA has been shown to perform better in scoring congeneric ligands than Glide [Citation61,Citation62].
2.10. Molecular dynamic simulation analysis
MD simulation of CR and GR were performed in complex with its respective targeted enzyme, HMG-R, using “Desmond (Schrodinger 2020, LLC, NY, USA)” as described earlier [Citation62,Citation63]. The receptor–ligand complex was preprocessed using Protein Preparation Wizard of Maestro, which included complex optimization and minimization. All the systems were prepared using the System Builder tool. TIP3P, a solvent model with an orthorhombic box (10 Å), was chosen. In the simulation, the OPLS_2005 force field was used [Citation64]. To make the models neutral, counter ions were introduced. To mimic physiological conditions, 0.15 M sodium chloride (NaCl) was added. The NPT ensemble with 300 K temperature and 1 atm pressure was chosen for the entire simulation. The models were relaxed before the simulation. The trajectories were saved for examination after every 100 ps. The parameters such as RMSD, root mean square fluctuation (RMSF), Radius of gyration (Rg), Solvent Accessible Surface Area (SASA) and protein–ligand interactions were analyzed to establish the stability of protein–ligand complexes. The Principal Component Analysis (PCA) was analyzed by using Bio3D package of R [Citation65]. PCA is calculated using a script written in R [Citation66].
2.11. In-vitro HMG-R inhibitory activity
The HMG-R assay kit for in-vitro study includes human HMG-R catalytic domain (recombinant GST fusion protein expressed in E. coli; 0.52–0.85 mg/mL). The cardioprotective potential of CR and GR on HMG-R catalytic activity was measured as described earlier [Citation7].
2.12. Enzyme kinetics studies
The enzyme kinetic experiments were conducted to evaluate the mechanistic manner of inhibition of HMG-R via CR and GR. Different concentrations of the substrate, HMG-CoA i.e. 66.66, 133.33 and 266.66 µM were added to monitor the HMG-R activity using distinct amounts of CR and GR (100, 200 and 300 µM) as well as pravastatin (0, 50 and 100 nM). Further, the double-reciprocal Lineweaver–Burk plot was designed to unknot the mode of inhibition as described previously [Citation10].
2.13. Statistical analysis
All the in-vitro biochemical assays were carried out in triplicate and data was represented as mean ± SEM. The GraphPad Prism version 4.02 (GraphPad Software, San Di-ego, USA) was used for the statistical analysis.
3. Results and discussion
3.1. Pharmacokinetic profiling and drug-likeness properties of carvacrol and geraniol
Targeting the pathway responsible for the endogenous production of cholesterol is the most preferred course of action against hypercholesterolaemia. Since, HMG-R is the rate-limiting enzyme of cholesterol homeostasis [Citation5] and statins are the most widely used inhibitors of HMG-R but their long-term use causes adverse outcomes as reported by several reports [Citation8,Citation67–70]. In this context, various plant extracts and phytochemicals have been screened for their hypolipidemic activity via targeting HMG-R [Citation1,Citation10]. Natural compounds specially plant-derived secondary metabolites received a lot of attention due to their medicinal properties including their fewer toxicity and cost-effectiveness [Citation71].
We initially executed the pharmacokinetic profile i.e. absorption, distribution, metabolism, excretion and toxicology (ADMET), drug-likeness and predicts the human intestinal absorption, blood–brain barrier (BBB) potential, skin permeability, plasma protein binding (PPB) potential of a chemical entity [Citation46]. while the physiochemical study gives the pharmacological feature of drug candidate such as provide ranges for the lipophilicity, water solubility, topological surface area (TPSA) as well as general feature of drug candidate i.e. molecular weight, number of atoms, number of rotatable bonds, number of hydrogen bonds donor and acceptor.
Since, drug-likeness (i.e. Lipinski’s rule of five), describes the physiochemical ranges of the bioactive compounds to being an oral drug, our results demonstrated that both CR and GR have acceptable scores of Lipinski’s rule of five. On the other hand, CR and GR does not show any violation of Veber and Egan rules and no alerts was predicted against PAINS (pan assay interference structure) rules, that identifies of potentially problematic fragments, as well as one violation (Molecular weight ≤160) was observed in Goshe rule. These properties of CR and GR indicated that they fulfil the criteria of drug-likeness and pharmacological properties (Table ).
Table 1. Chemical and Drug likeness properties of test compounds and standard drug.
Further, our in-silico investigation depicted that the CR and GR showed considerable aq. solubility 180.95 and 665.54 mg/L, respectively (Table ). Moreover, the ligands with BBB scores > 2.0, between 2.0–0.1 and <0.1 show high, modest and low absorption across BBB, respectively [Citation72,Citation73]. While pravastatin and atorvastatin score low BBB absorption. Additionally, the valuation of colorectal adenocarcinoma (Caco-2) and Madin-Darby canine kidney (MDCK) cell penetrability has been a well-known measure for the drug development procedure [Citation73,Citation74]. Results exhibited that CR and GR score Caco-2 permeability with 38.01 and 8.76 nm/s, while 87.33 and 271.03 nm/s were observed in MDCK permeability, respectively. This indicates that CR and GR have the potential capability to pervade across Caco-2 and MDCK cells and are well supported by known permeability ranges across these cellular models [Citation75].
Our selected compounds also showed 100% PPB while, pravastatin, and atorvastatin score 86 and 90% respectively. Further, the predicted human intestinal absorption (HIA) for CR and GR was observed as 100%. Whereas, pravastatin and atorvastatin exhibit 77.95 and 94.65%, respectively. The enhanced HIA exhibits the improved bioavailability of these compounds which can enhance their potent pharmacological activities. In the same way, our results depicted that CR, GR, pravastatin and atorvastatin exhibit non-reactivity toward CYP2D6 inhibitor and substrate which indicates comparatively faster metabolism, instantaneous beneficial actions as well as clearance from the body. These results are well acceptable by the available reports [Citation76,Citation77].
3.2. Toxicity assessment of carvacrol and geraniol compounds
The selected monoterpenes; CR and GR fall under the class 4 and 5 with LD50 of 810 and 2100 mg/kg, respectively. That means these compounds were safe and inactive against all the tested toxicity parameters whereas, pravastatin was active against the immunotoxicity, carcinogenicity and predicted toxicity class was 6 as well as LD50 was 8939 mg/kg. While, atorvastatin showed hepatotoxicity and falls under the toxicity class of 5 and 5000 mg/kg LD50 was predicted (Table ). To the sum of all, the selected test compounds are predicted as non-toxic and safe for further carrying out in the drug development programme.
Table 2. Toxicity assessment of selected compounds.
3.3. In-silico molecular docking revealed that carvacrol and geraniol efficiently binds to the HMG-R active pocket and MM-GBSA analysis
The computer-aided molecular docking studies were executed to determine the binding affinity of CR and GR within the catalytic site of HMG-R. Our results illustrated that CR and GR occupied the active pocket of HMG-R with the binding energies (ΔG) of −4.60 and −1.99 Kcal/mol, respectively (Table ). CR was comparable and showed better ΔG against pravastatin and atorvastatin (−4.21 and −3.26 Kcal/mol, respectively). The result for the standard drug was well corroborated with the previously published studies [Citation7,Citation78]. The involvement of 8 amino acid residues Arg590, Met655, Met657, Asn658, Asp690, Lys691, Asp767 and Gln770 stabilized the CR-HMG-R−complex. The stabilized complex has one conventional H-bond with Asp690 residue along with one pi-cation bond and 2 hydrophobic interactions along with two negative and two positive charge interactions with the target protein (Figure ) (Table ). The pi-cation bond interaction is a crucial participant in the architecture and stability of protein [Citation79–81]. Compared to an H-bond, pi-cation bonds are stronger energetically [Citation82]. In studies, it has been demonstrated that the pi-cation interaction promotes recognition between proteins and ligands and that it can also be regarded as a valuable predictor of drug–receptor interactions [Citation83]. Whereas, GR occupied the active pocket of HMG-R with the 8 identical amino acid residues i.e. Arg590, Met655, Met657, Asn658, Asp690, Lys691, Asp767, Gly807. These interactions incorporated by two conventional H-bonds with Arg590 and Asp690 along with two similar hydrophobic interaction (Met655 and Met657), and two negative and two positive charged interaction (Figure ) (Table ).
Figure 2. 2D-Schematic representation of Carvacrol and Geraniol with the target protein HMG-R. (A) Carvacrol interaction with HMG-R in the binding pocket visualized through the 2D structure. (B) The 2D structure interaction representation of Geraniol with the active pocket amino residues of HMG-R.
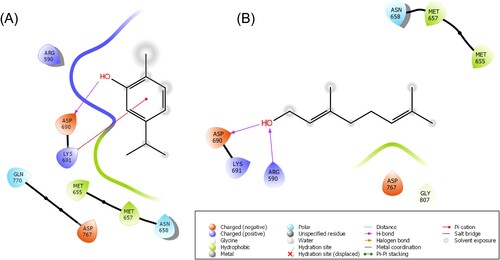
Table 3. Number of residues stabilizing the carvacrol, geraniol and the standard drug atorvastatin and pravastatin-HMG-R-complex.
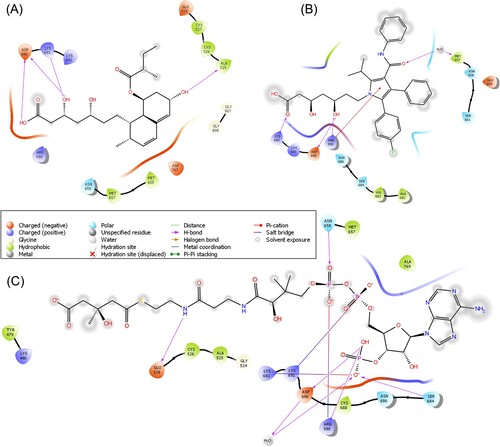
Furthermore, the molecular binding pattern of the substrate (HMG-CoA) and the standard drug pravastatin as well as atorvastatin were also analyzed to compare the binding efficiency of CR and GR with the active pocket of HMG-R. The HMG-CoA interaction with HMG-R showed the highest binding affinity (−5.95 Kcal/mol) in comparison to our tested compounds. It stabilizes the HMG-CoA−HMG-R complex with the formation of 16 amino acid residues i.e. Tyr479, Lys480, Gly524, Ala525, Cys526, Glu528, Arg590, Met657, Asn658, Ser684, Asn686, Cys688, Asp690, Lys691, Lys692 and Ala769 along with five H-bonds, one water mediated H-bond with Asp690 as well as six hydrophobic and three polar interactions were formed.
Whereas, pravastatin occupied the active site of HMG-R with a ΔG of −4.21 Kcal/mol, this complex was stabilized by the participation of 14 amino acid residues (Ala525, Cys526, Cys527, Glu528, Arg590, Met655, Met657, Asn658, Asp690, Lys691, Lys692, Asp767, Gly807 and Gly808) that lied within the active pocket of the enzyme, 4 conventional H-bonds, five hydrophobic, three positive, three negative and one polar interaction. On the other hand, atorvastatin−HMG-R−complex was formed by 12 amino acids (Arg590, Met657, Asn658, Ser661, Glu665, Val682, Val683, Ser684, Asn686, Asp690, Lys691 and Lys692), this interaction stabilized by three H-bonds, three hydrophobic interaction, four polar, two positive and three negative interactions (Figure ). Pravastatin and atorvastatin are quite bigger molecules than the CR and GR compounds that contain a greater number of carbons, hydrogen and oxygen, which provides the feasibility of the interaction with the target. Whereas, the binding affinity of standard molecules was influenced by hydrogen bonding and other interactions. The bonding pattern with the amino acid and binding energy also depends upon the bond type, number of rotatable, hydrogen donor, acceptor bonds and topological surface area. Each molecule has its own physiochemical properties that are responsible for their interaction with the targeted protein [Citation84,Citation85].
Figure 3. 2D-Schematic representation of pravastatin, atorvastatin and HMG-CoA with the target protein HMG-R. (A) 2D interaction representation of pravastatin with the active pocket of HMG-R. (B) Representation of atorvastatin with HMG-R (C) HMG-CoA interaction with HMG-R in the binding site is visualized through the 2D structure.
It has been found that Prime MM-GBSA investigation improves the binding energy calculations as compared with molecular docking energies. As a result, MM-GBSA analysis discloses that the ligands bind more strongly to the receptors. Our study unveiled that the MM-GBSA scores of CR and GR complexes are −17.05 and −29.48 Kcal/mol respectively (Table ). Instead, the MM-GBSA score for the HMG-CoA-HMG-R complex is −18.70 Kcal/mol. Moreover, the binding free energy of pravastatin and atorvastatin of −39.47 and −35.89 Kcal/mol, respectively. Thus, GR showed stronger binding free energy which is closer to atorvastatin and pravastatin, while CR exhibited a lower MM-GBSA score among others.
Table 4. Components of free energy of target protein (HMG-R) with the identified inhibitor using Prime/MMGBSA approach. All the energies are reported in Kcal/mol−1.
3.4. Molecular dynamics simulation study of carvacrol and geraniol
It is a critical approach to discover the stability of protein–ligand complexes and analyze the intermolecular interactions. The molecular dynamic simulation (MDS) provides insight into the intermolecular interactions present in the protein–ligand complexes within the given reference time interval. In our case, the complexes of the selected compounds with the target, (HMG-R), were analyzed by using the MDS approach to envisage the complex stability, conformational changes and intermolecular interactions at the atomic level of the selected CR and GR complexes, against the time interval of 100 ns. MDS trajectories of each complex were then analyzed using the simulation interaction diagram (SID) module of the Desmond interface and simulation results were analyzed including RMSD, root mean square fluctuation (RMSF) and protein–ligand interaction mapping of the complexes. The RMSD parameter is used to measure the average distance generated due to the removal of the selected atoms in the complex during the simulation interval for a specific time interval concerning the reference time frame. The RMSD of a docked complex of selected compounds with the target, HMG-R, were studied for the C-α backbone, side chain and heavy atoms. The RMSD of the protein fit ligand from all time frames concerning the reference time is calculated.
3.4.1. RMSD of protein
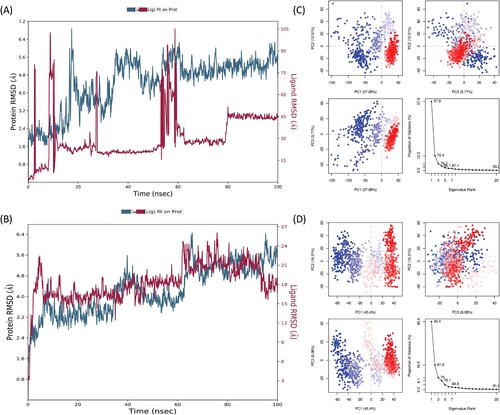
The RMSD values between 1 and 3 within the reference protein structure are acceptable, but the larger value indicates significant conformational changes or fluctuations in the protein–ligand complex. The more considerable conformational changes in protein refer to the unstable and nonequilibrium state of the system during the simulation interval. The RMSD analysis of CR and GR shows that the C-α atoms of the target protein, exhibit some oscillation in RMSD values in both complexes. The RMSD values of both complexes were mostly around 0−6
, which is higher than the acceptable range. In CR−HMG-R complex protein RMSD were stable from starting to 18 ns, after that (19−30 ns) showed some fluctuation in RMSD values, and later (30−100 ns) the RMSD values of protein stabilized in between 4 and 6
. Similarly, the GR−HMG-R complex protein RMSD value mostly lies between 3 and 5
(Figure ).
Figure 4. The Root Mean Square Deviation (RMSD) plot of (A); carvacrol and (B); geraniol with HMG-R complex. The RMSD is used to measure the average change in displacement of a selection of atoms for a particular frame with respect to a reference frame. It is calculated for all frames in the trajectory. (C); Principal Component Analysis eigenvalue plotted versus the percentage of variance CR−HMG. The varying areas are displayed in three separate sections. Variations in PC1, PC2 and PC3 add up to 57.89%, 12.51% and 5.77%, respectively. (D); Principal Component Analysis eigenvalue plotted versus the percentage of variance (CR−HMG-R). The varying areas are displayed in three separate sections. Variations in PC1, PC2 and PC3 add up to 45.4%, 16.51% and 8.08%, respectively.
3.4.2. RMSD of ligand
After analyzing the RMSD data obtained from the protein fit ligands, we found that all the docked proteins with the selected compounds were favoured by RMSD values <3 Å. The CR and GR compounds exhibited higher RMSD values throughout the simulation of 100 ns. The CR showed higher RMSD values which extend up to 5−105 Å at some intervals when compared to favoured RMSD value, which showed structural modification and less stabilization in ligands throughout the simulation (Figure ). A similar pattern was also observed in GR−HMG-R-complex, where the ligand RMSD values stretched over the favoured region at the initial simulation time, and it deviated between 16−20 in the RMSD values throughout the simulation period.
3.4.3. Principle component analysis
Principal Component Analysis (PCA) is a statistical technique that can be used to identify the essential dynamics of proteins, which describe the change in molecular structure or conformation over time [Citation86]. The graph of eigenvalues (protein) against eigenvector index (eigenmode) for the first 20 modes of motion (CR−HMG-R and GR−HMG-R) (Figure C,D, respectively) represents stability. The eigenvalues depicted the hyperspace eigenvector fluctuations. In simulations, the eigenvectors with the highest eigenvalues control the total mobility of the target protein. The CR−HMG-R and GR−HMG-R, top 5 eigenvectors in utilized systems displayed dominant movements and had higher eigenvalues (57.9−87.1%), and (45.4−84.4%) respectively, than the other eigenvectors. All changes were recorded and plotted on three PCs (PC1, PC2 and PC3). PC1 clusters had the largest variability (57.89% and 45.4% respectively), PC2 showed variability (12.51% and 16.51% respectively) and PC3 had the lowest variability (5.77%, and 8.08% respectively). Because of its low variability, PC3 has a more compact structure than PC1 and PC2, as well as was thought to be a more stabilized protein–ligand binding complex. The simple clustering in the PC subspace revealed conformational variations across all the groups. Blue signifies the most significant mobility; white shows intermediate movement; and red suggests less flexibility [Citation87].
3.4.4. Root mean square fluctuation (RMSF)
Typically, we observe that the N and C terminal residues fluctuate more from the rest of the protein parts. Such fluctuations can be ignored during the simulation and RMSF analysis. In the complex of CR−HMG-R, all the residues of HMG-R i.e. from Ile531 to Val863 exhibited about <3 Å fluctuation in RMSF values. While, a higher fluctuation (3−6.3 Å) was observed between Leu462 to Val530 throughout the 100 ns simulation time. While the amino acids Gln469, Asn472, His475, Ile476, Glu482, Asp516, Tyr517, Ser520, Val522, His524, Ala525, Cys526 and Cys527 interacted with ligand but showed high fluctuation (5.54, 5.91, 6.3, 6.09, 5.76, 3.60, 3.05, 4.53, 4.85, 5.31, 4.51, 4.53 and 3.81Å respectively). On the other hand, most of the protein–ligand contacts were observed in the favoured RMSF region. As shown in Figure , in the GR−HMG-R-complex, the fluctuation in most of the residues occurs between 1 and 3.5 Å. The highest fluctuation was observed in the loop region of HMG-R 7.78 Å, while the peak showed that the following amino acid residues i.e. Ser500, Lys501, Lys502, Leu503, Ser504, Glu505, Pro506, Ser507, Ser508 with fluctuation of 4.31, 5.71, 6.01, 6.17, 7.78, 6.32, 5.07, 4.42 and 4.34Å, respectively was observed. Comparing the RMSF of all the complexes, it has been depicted that GR exhibited more stability than the CR complex through the simulation. The GR can be considered a stable compound as compared to CR because carvacrol has a higher RMSF value.
Figure 5. RMSF plot of representation of (A); carvacrol, and (B); geraniol with HMG-R. RMSF plot defines characterizing local fluctuations along the protein chain. In the above plot, peaks represent regions of the protein that fluctuate most during the simulation. Typically, N- and C-terminal fluctuate more than any other part of the protein. Secondary structure elements like alpha helices and beta strands are usually more rigid than the unstructured part of the protein, and thus fluctuate less than the loop regions. Dependency of (C and E); radius of gyration (Rg) of CR−HMG-R and GR−HMG-R, respectively, and (D and F); solvent accessible surface area (SASA) of target protein of HMG-R in the presence of CR and GR, respectively on simulation time.
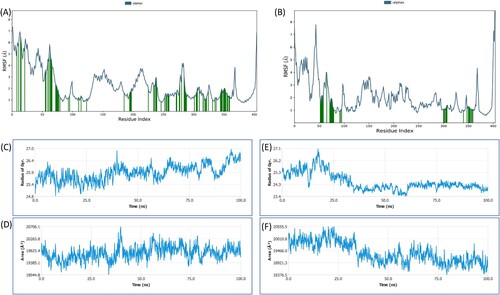
3.4.5. The radius of gyration (Rg) and solvent-accessible surface area (SASA)
The radius of gyration measures the protein–ligand complex’s compactness, and the solvent-accessible surface area determines its exposure to solvent molecules. Each of these characteristics sheds light on the protein–ligand complex’s stability throughout the simulation in this study, the Rg of HMG-R was determined in the presence of CR and GR during 0–100 ns, as shown in Figure C,E. The Rg of CR-HMG-R and GR-HMG-R complexes varied in the range of 23.4−26.0 Å and 24.8−26.4 Å respectively, with an average value of 24.5 ± 0.67 Å and 25.89 ± 0.37 Å, respectively. The Rg values indicate how compact or extended the complexes are. Smaller Rg values typically suggest a more compact or folded structure, while larger Rg values suggest a more extended or unfolded structure. Similarly, the SASA of HMG-R was determined in the presence of CR and GR during 0–100 ns (Figure D,F). The SASA of CR-HMG-R and GR-HMG-R complexes fluctuated in the range of 18,500−20,500 Å2 and 18,300−20,200 Å2, respectively, with an average value of 19,362.92 ± 469.00 Å2 and 19,744.82 ± 253.38 Å2, respectively. Higher SASA values often indicate that more of the protein's surface is exposed to solvent molecules, which might be indicative of increased conformational flexibility or greater solvent accessibility. Conversely, lower SASA values can suggest a more compact or stable protein–ligand complex. The above findings display the increased conformational flexibility or greater solvent accessibility of protein–ligand complexes by showing that fluctuations in Rg and SASA of the protein of interest in the presence of CR and GR diverge significantly.
3.4.6. Protein–ligand contacts
Numerous types of contacts between protein and ligands, including H-bonding have an essential role in drug metabolism, absorption and drug specificity. Besides H-bond interactions, the π–π interactions, ionic or polar interactions, and water bridge contacts are also responsible for the stability of the protein–ligand complex. Furthermore, CR and GR compounds form many intermolecular contacts like H-bond interactions, hydrophobic interactions and water bridge interactions, thus exhibiting moderate stability throughout the simulation interval.
In the CR−HMG-R complex, there is the presence of ionic interaction established by Gly776 having an interaction fraction of 0.001. Besides H-bond, hydrophobic and water bridge interaction also formed during simulation, which might contribute towards the stability of the complex. The active site residues establish major H-bond interactions such as Lys715, Glu719 and Gly747 with interaction fractions of 0.011, 0.021 and 0.036, respectively. On the other hand, major hydrophobic interactions were exhibited by Val538, Lys715, Pro535, Tyr533, Trp698, Val716, Ile778, Pro813 and Ala816 amino acids; as well as water bridge interactions also formed during simulation (Figure ).
Figure 6. The properties of both ligands (carvacrol and geraniol) during the 100 ns simulation. (A, B) The carvacrol and geraniol interaction with HMG-R. (B, D) The histogram of both ligands (carvacrol and geraniol) displayed bonds with amino acids of HMG-R.
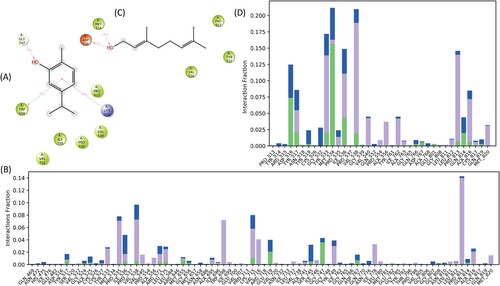
In the GR−HMG-R complex, several H-bond, hydrophobic and water bridge interaction was formed during the simulation. The major H-bonds were formed in between the Asp516, Tyr517, Tyr533, Met534, Ile536, Val538 and Gln814 with the interaction fraction of 0.074, 0.021, 0.021, 0.157, 0.043, 0.019 and 0.020 respectively. While, the major hydrophobic interaction was formed by similar amino acids which were involved in H-bond i.e. Tyr517, Tyr533 Ile536, Val538, Val540, Ala556, Ile762, Pro813, Ala816 and Met820 with the respective interaction fraction of 0.034, 0.118, 0.068, 0.017, 0.043, 0.037, 0.041, 0.133, 0.066 and 0.031. Similarly, a large number of water bridges with high interaction fractions were also exhibited between those above-mentioned amino acids such as, Asp516, Tyr517, Tyr533, Met535, Ile536, Val538, Gln814 etc. (Figure ). The overall results exhibited that various parameters described above like RMSD, RMSF and protein–ligand contacts were analyzed by the Desmond simulation interaction diagram module and we depicted that the GR complex showed better stability than the CR complex during the simulation interval of 100 ns.
3.5. Carvacrol and geraniol potentially inhibit the HMG-R activity and enzyme kinetics study
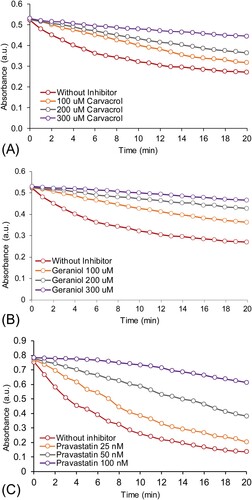
The above in-silico data was further validated through the in-vitro analysis. In order to validate the cardioprotective effect of CR and GR, in-vitro HMG-R inhibitory assay was performed following the standard protocol [Citation10]. Our results demonstrated that CR and GR have potent inhibitory potential of HMG-R with an IC50 value of 78.23 ± 2.21 µM, and 72.91 ± 2.92 µM, respectively (Figure A,B). However, the standard drug pravastatin showed lower IC50 (58.12 ± 3.01 nM) than these monoterpenes. The spectrophotometric time scans of CR and GR (100−300 µM), and pravastatin (25−100 nM) suggested the direct interaction of these monoterpene drug candidates with HMG-R (Figure ). It is obvious from our results that the IC50 value of our tested compounds against HMG-R is quite higher but nevertheless, they are from natural sources [Citation1]. The toxicity analysis already depicted that pravastatin and atorvastatin are active against carcinogenicity, immunotoxicity and hepatotoxicity (Table ).
Figure 7. The bar graphs (upper panels, 7A) represent the % inhibition of in-vitro HMG-R activity in the presence or absence of carvacrol (IC50 = 78.23 µM), geraniol (IC50 = 72.91 µM) and pravastatin (IC50 = 58.12 nM). The values of % inhibition are expressed as mean ± SEM from triplicate assays for each concentration. The Significance was defined as ***p < 0.001. The lower panel 7B represents the Lineweaver–Burk plot for the inhibition of HMG-R in the absence and presence of inhibitor at varying concentrations (100, 200 and 300 µM) and substrate at varying concentrations (i.e. 66.66, 133.33 and 266.66 µM). Note: The concentration of pravastatin is in nM.
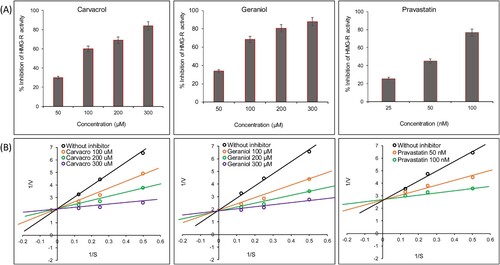
Figure 8. The spectrophotometric time scans showing the progress of the reaction catalyzed by HMG-R either in the presence or absence of test compounds, (panel A): time scan for carvacrol; (panel B): for geraniol and, (panel C): for pravastatin at the different concentration.
In addition, to depict the mode of inhibition of HMG-R activity via these compounds, enzyme kinetics studies were conducted. The Lineweaver–Burk double reciprocal plot that is 1/V vs 1/S plotted, where V represents the velocity of enzyme activity (absorbance change) and S stands for the concentration of substrate. The competitive inhibitor (all trendlines intersect at the same position on the Y axis) shows no change in the Vmax and an increase in the Km value, and for the non-competitive inhibitor (all the trendlines intersect at the same position on the X axis); Vmax decreases and Km remain same. Our results demonstrated that presence of different concentrations of inhibitor (CR & GR), the Km was increased and there is no significant change was observed in the Vmax (Figure B). Thus, we concluded that both the monoterpenes CR and GR are competitive inhibitors of HMG-R. However, pravastatin is a well-established competitive inhibitor of HMG-R (Figure B) [Citation8,Citation88]. Therefore, we can say that CR and GR occupy the active site of the HMG-R via hydrophobic as well as hydrophilic interactions.
4. Conclusion
Our pharmacokinetic profiling and drug-likeness analysis demonstrated that these monoterpenes (CR and GR) followed Lipinski’s rule of five and were inactive against the toxicity assessment. However, pravastatin and atorvastatin were active against carcinogenicity and immunotoxicity. In addition, the molecular docking studies demonstrated that CR and GR actively occupied the catalytic site of the HMG-R which is comparable to the pravastatin. The MDS exhibited high RMSD and RMSF for both the complex of CR and GR. Due to the high RMSD and RMSF, we can say that both the complexes undergo some structural modification, but GR showed lower RMSD and RMSF values as compared to CR, which in turn depicted that GR complex showed better stability than CR complex. Furthermore, the in-vitro inhibition and kinetic study revealed that CR and GR have potent inhibitory activity of HMG-R with IC50 values of 78.23 ± 2.21 µM, and 72.9 ± 2.92 µM, respectively. Additionally, our enzyme kinetics analysis depicted that both CR and GR competitively blocked HMG-R activity. Based on combined in-vitro and in-silico data, our results suggested that both CR and GR exhibited significant anti-hypercholesterolemic activity while the molecular simulation studies depicted that GR complex showed better stability than CR complex. Further, a broader in-vivo study is needed for the better understanding of the cardioprotective effect of these compounds.
Acknowledgments
The authors would like to thank the Deanship of Scientific Research at Majmaah University for supporting this work under project no. R-2023-886.
Disclosure statement
No potential conflict of interest was reported by the author(s).
Data availability statement
All the data supporting the findings are included in the article.
References
- Waiz M, Alvi SS, Khan MS. Potential dual inhibitors of PCSK-9 and HMG-R from natural sources in cardiovascular risk management. EXCLI J. 2022;21:47–76. doi:10.17179/EXCLI2021-4453
- Ahmad P, Alvi SS, Iqbal D, et al. Insights into pharmacological mechanisms of polydatin in targeting risk factors-mediated atherosclerosis. Life Sci. 2020;254:117756. doi:10.1016/j.lfs.2020.117756
- Alvi SS, Ansari IA, Khan I, et al. Potential role of lycopene in targeting proprotein convertase subtilisin/kexin type-9 to combat hypercholesterolemia. Free Radic Biol Med. 2017;108:394–403. doi:10.1016/j.freeradbiomed.2017.04.012
- Horton JD, Goldstein JL, Brown MS. SREBPs: activators of the complete program of cholesterol and fatty acid synthesis in the liver. J Clin Invest. 2002;109:1125–1131. doi:10.1172/JCI0215593
- Goldstein JL, Brown MS. A century of cholesterol and coronaries: from plaques to genes to statins. Cell. 2015;161:161–172. doi:10.1016/j.cell.2015.01.036
- Ahmad P, Alvi SS, Khan MS. Functioning of organosulfur compounds from garlic (Allium sativum Linn) in targeting risk factor-mediated atherosclerosis: a cross talk between alternative and modern medicine. In: MS Akhtar, MK Swamy, UR Sinniah, editors. Nat. Bio-active compd. Singapore: Springer; 2019. p. 561–585. doi:10.1007/978-981-13-7154-7_20
- Ahmad P, Alvi SS, Iqbal J, et al. Target-based virtual and biochemical screening against HMG-CoA reductase reveals Allium sativum-derived organosulfur compound N-acetyl cysteine as a cardioprotective agent. Rev Bras Farmacogn. 2022;32:962–973. doi:10.1007/s43450-022-00330-1
- Ward NC, Watts GF, Eckel RH. Statin toxicity. Circ Res. 2019;124:328–350. doi:10.1161/CIRCRESAHA.118.312782
- Iqbal D, Khan MS, Khan MS, et al. An In vitro and molecular informatics study to evaluate the antioxidative and β-hydroxy-β-methylglutaryl-CoA reductase inhibitory property of Ficus virens Ait. Phyther Res. 2014;28:899–908. doi:10.1002/ptr.5077
- Alvi SS, Iqbal D, Ahmad S, et al. Molecular rationale delineating the role of lycopene as a potent HMG-CoA reductase inhibitor: in vitro and in silico study. Nat Prod Res. 2016;30:2111–2114. doi:10.1080/14786419.2015.1108977
- Ahmad P, Alvi SS, Iqbal J, et al. Identification and evaluation of natural organosulfur compounds as potential dual inhibitors of α-amylase and α-glucosidase activity: an in-silico and in-vitro approach. Med Chem Res. 2021;30:2184–2202. doi:10.1007/s00044-021-02799-2
- Akhter F, Alvi SS, Ahmad P, et al. Therapeutic efficacy of Boerhaavia diffusa (Linn.) root methanolic extract in attenuating streptozotocin-induced diabetes, diabetes-linked hyperlipidemia and oxidative-stress in rats. Biomed Res Ther. 2019;6:3293–3306. doi:10.15419/bmrat.v6i7.556
- Khazdair MR, Ghorani V, Alavinezhad A, et al. Pharmacological effects of Zataria multiflora Boiss L. and its constituents focus on their anti-inflammatory, antioxidant, and immunomodulatory effects. Fundam Clin Pharmacol. 2018;32:26–50. doi:10.1111/fcp.12331
- Boskabady MH, Alitaneh S, Alavinezhad A. Carum copticum L.: a herbal medicine with various pharmacological effects. Biomed Res Int. 2014;2014:1–11. doi:10.1155/2014/569087
- Fachini-Queiroz FC, Kummer R, Estevão-Silva CF, et al. Effects of thymol and carvacrol, constituents of thymus vulgaris L. essential oil, on the inflammatory response. Evidence-Based Complement Altern Med. 2012;2012:1–10. doi:10.1155/2012/657026
- Periago PM, Moezelaar R. Combined effect of nisin and carvacrol at different pH and temperature levels on the viability of different strains of Bacillus cereus. Int J Food Microbiol. 2001;68:141–148. doi:10.1016/S0168-1605(01)00461-5
- Manou I, Bouillard L, Devleeschouwer MJ, et al. Evaluation of the preservative properties of Thymus vulgaris essential oil in topically applied formulations under a challenge test. J Appl Microbiol. 1998;84:368–376. doi:10.1046/j.1365-2672.1998.00353.x
- Andersen A. Final report on the safety assessment of sodium p -chloro- m -cresol, p -chloro- m -cresol, chlorothymol, mixed cresols, m -cresol, o -cresol, p -cresol, isopropyl cresols, thymol, o -cymen-5-ol, and Carvacrol1. Int J Toxicol. 2006;25:29–127. doi:10.1080/10915810600716653
- Ultee A, Bennik MHJ, Moezelaar R. The phenolic hydroxyl group of carvacrol is essential for action against the food-borne pathogen bacillus cereus. Appl Environ Microbiol. 2002;68:1561–1568. doi:10.1128/AEM.68.4.1561-1568.2002
- De Vincenzi M, Stammati A, De Vincenzi A, et al. Constituents of aromatic plants: carvacrol. Fitoterapia. 2004;75:801–804. doi:10.1016/j.fitote.2004.05.002
- Wang L, Wang D, Wu X, et al. Antiviral mechanism of carvacrol on HSV-2 infectivity through inhibition of RIP3-mediated programmed cell necrosis pathway and ubiquitin-proteasome system in BSC-1 cells. BMC Infect Dis. 2020;20:832. doi:10.1186/s12879-020-05556-9
- Pilau MR, Alves SH, Weiblen R, et al. Antiviral activity of the Lippia graveolens (Mexican oregano) essential oil and its main compound carvacrol against human and animal viruses. Braz J Microbiol. 2011;42:1616–1624. doi:10.1590/S1517-83822011000400049
- Park J-H, Jeon Y-J, Lee C-H, et al. Insecticidal toxicities of carvacrol and thymol derived from Thymus vulgaris Lin. against Pochazia shantungensis Chou & Lu., newly recorded pest. Sci Rep. 2017;7:40902. doi:10.1038/srep40902
- Khan I, Bahuguna A, Kumar P, et al. In vitro and in vivo antitumor potential of carvacrol nanoemulsion against human lung adenocarcinoma A549 cells via mitochondrial mediated apoptosis. Sci Rep. 2018;8:144. doi:10.1038/s41598-017-18644-9
- Fan K, Li X, Cao Y, et al. Carvacrol inhibits proliferation and induces apoptosis in human colon cancer cells. Anticancer Drugs. 2015;26:813–823. doi:10.1097/CAD.0000000000000263
- Sampaio LA, Pina LTS, Serafini MR, et al. Antitumor effects of carvacrol and thymol: a systematic review. Front Pharmacol. 2021;12:702487. doi:10.3389/fphar.2021.702487.
- Kara M, Uslu S, Demirci F, et al. Supplemental carvacrol can reduce the severity of inflammation by influencing the production of mediators of inflammation. Inflammation. 2015;38:1020–1027. doi:10.1007/s10753-014-0066-0
- Cicalău G, Babes P, Calniceanu H, et al. Anti-Inflammatory and antioxidant properties of carvacrol and magnolol. in periodontal disease and diabetes mellitus. Molecules. 2021;26:6899. doi:10.3390/molecules26226899
- Bayramoglu G, Senturk H, Bayramoglu A, et al. Carvacrol partially reverses symptoms of diabetes in STZ-induced diabetic rats. Cytotechnology. 2014;66:251–257. doi:10.1007/s10616-013-9563-5
- Rathod NB, Kulawik P, Ozogul F, et al. Biological activity of plant-based carvacrol and thymol and their impact on human health and food quality. Trends Food Sci Technol. 2021;116:733–748. doi:10.1016/j.tifs.2021.08.023
- Mediouni S, Jablonski JA, Tsuda S, et al. Oregano oil and its principal component, carvacrol, inhibit HIV-1 fusion into target cells. J Virol. 2020;94:10–1128. doi:10.1128/JVI.00147-20.
- Memar MY, Raei P, Alizadeh N, et al. Carvacrol and thymol: strong antimicrobial agents against resistant isolates. Rev Med Microbiol. 2017;28:63–68. doi:10.1097/MRM.0000000000000100
- Gavaric N, Mozina SS, Kladar N, et al. Chemical profile, antioxidant and antibacterial activity of thyme and oregano essential oils, thymol and carvacrol and their possible synergism. J Essent Oil Bear Plants. 2015;18:1013–1021. doi:10.1080/0972060X.2014.971069
- Magi G, Marini E, Facinelli B. Antimicrobial activity of essential oils and carvacrol, and synergy of carvacrol and erythromycin, against clinical, erythromycin-resistant group A streptococci. Front Microbiol. 2015;6:165. doi:10.3389/fmicb.2015.00165.
- Wijesundara NM, Lee SF, Cheng Z, et al. Carvacrol exhibits rapid bactericidal activity against streptococcus pyogenes through cell membrane damage. Sci Rep. 2021;11:1487. doi:10.1038/s41598-020-79713-0
- Kachur K, Suntres Z. The antibacterial properties of phenolic isomers, carvacrol and thymol. Crit Rev Food Sci Nutr. 2020;60:3042–3053. doi:10.1080/10408398.2019.1675585
- Natal CM, Fernandes MJG, Pinto NFS, et al. New carvacrol and thymol derivatives as potential insecticides: synthesis, biological activity, computational studies and nanoencapsulation. RSC Adv. 2021;11:34024–34035. doi:10.1039/D1RA05616F
- Simon DZ, Beliveau J, Aube C. Extraction by hydrodiffusion of the essential oil of Monarda fistulosa grown in the province of Quebec: assay of geraniol in the hydrodiffused oil. Int J Crude Drug Res. 1986;24:120–122. doi:10.3109/13880208609060888
- Baser KHC, Kürkçüoglu M, Demirci B. Ninde oil (Aeollanthus myrianthus Taylor) revisited: analysis of a historical oil. J Essent Oil Res. 2005;17:137–138. doi:10.1080/10412905.2005.9698856
- Baydar H, Baydar NG. The effects of harvest date, fermentation duration and tween 20 treatment on essential oil content and composition of industrial oil rose (Rosa damascena Mill.). Ind Crops Prod. 2005;21:251–255. doi:10.1016/j.indcrop.2004.04.004
- Dubey VS, Luthra R. Biotransformation of geranyl acetate to geraniol during palmarosa (Cymbopogon martinii. Roxb. wats. var. motia) inflorescence development. Phytochemistry. 2001;57:675–680. doi:10.1016/S0031-9422(01)00122-4
- Rajeswara Rao BR, Bhattacharya AK, Mallavarapu GR, et al. Yellowing and crinkling disease and its impact on the yield and composition of the essential oil of citronella(Cymbopogon winterianus Jowitt.). Flavour Fragr J. 2004;19:344–350. doi:10.1002/ffj.1313
- Prasad SN, Muralidhara M. Analysis of the antioxidant activity of geraniol employing various in-vitro models: relevance to neurodegeneration in diabetic neuropathy. Asian J Pharm Clin Res. 2017;10:101. doi:10.22159/ajpcr.2017.v10i7.18564
- Farokhcheh M, Hejazian L, Akbarnejad Z, et al. Geraniol improved memory impairment and neurotoxicity induced by zinc oxide nanoparticles in male wistar rats through its antioxidant effect. Life Sci. 2021;282:119823. doi:10.1016/j.lfs.2021.119823
- Lei Y, Fu P, Jun X, et al. Pharmacological properties of geraniol. A review. Planta Med. 2019;85:48–55. doi:10.1055/a-0750-6907
- Daina A, Michielin O, Zoete V. SwissADME: a free web tool to evaluate pharmacokinetics, drug-likeness and medicinal chemistry friendliness of small molecules. Sci Rep. 2017;7:42717. doi:10.1038/srep42717
- Lipinski CA, Lombardo F, Dominy BW, et al. Experimental and computational approaches to estimate solubility and permeability in drug discovery and development settings 1PII of original article: S0169-409X(96)00423-1. Adv Drug Deliv Rev. 2001;46:3–26. The article was originally published in Advanced Drug Delivery Reviews 23 (1997). doi:10.1016/S0169-409X(00)00129-0
- Banerjee P, Eckert AO, Schrey AK, et al. ProTox-II: a webserver for the prediction of toxicity of chemicals. Nucleic Acids Res. 2018;46:W257–W263. doi:10.1093/nar/gky318
- Sheikh SY, Ansari WA, Hassan F, et al. Drug repositioning to discover novel ornithine decarboxylase inhibitors against visceral leishmaniasis. J Mol Recognit. 2023;36(7):e3021. doi:10.1002/jmr.3021.
- David TI, Adelakun NS, Omotuyi OI, et al. Molecular docking analysis of phyto-constituents from cannabis sativa with pfDHFR. Bioinformation. 2018;14:574–579. doi:10.6026/97320630014574
- Istvan ES, Deisenhofer J. Structural mechanism for statin inhibition of HMG-CoA reductase. Science (80-.). 2001;292:1160–1164. doi:10.1126/science.1059344
- Berman HM. The protein data bank. Nucleic Acids Res. 2000;28:235–242. doi:10.1093/nar/28.1.235
- Mutlu O. In silico molecular modeling and docking studies on the leishmanial tryparedoxin peroxidase. Brazilian Arch Biol Technol. 2014;57:244–252. doi:10.1590/S1516-89132014000200013
- Goodford PJ. Drug design by the method of receptor fit. J Med Chem. 1984;27:557–564. doi:10.1021/jm00371a001
- Patschull AOM, Gooptu B, Ashford P, et al. In silico assessment of potential druggable pockets on the surface of α1-antitrypsin conformers. PLoS One. 2012;7:e36612. doi:10.1371/journal.pone.0036612
- Ansari WA, Rizvi F, Khan MA, et al. Computational study reveals the inhibitory effects of chemical constituents from Azadirachta indica (Indian Neem) against delta and omicron variants of SARS-CoV-2. Coronaviruses. 2022;3(5):62–72. doi:10.2174/2666796703666220827100054.
- Casalvieri KA, Matheson CJ, Backos DS, et al. Molecular docking of substituted pteridinones and pyrimidines to the ATP-binding site of the N-terminal domain of RSK2 and associated MM/GBSA and molecular field datasets. Data Br. 2020;29:105347. doi:10.1016/j.dib.2020.105347
- Kalirajan R, Sankar S, Jubie S, et al. Molecular docking studies and in-silico ADMET screening of some novel oxazine substituted 9-anilinoacridines as topoisomerase II inhibitors. Indian J Pharm Educ Res. 2017;51:110–115. doi:10.5530/ijper.51.1.15
- Li J, Abel R, Zhu K, et al. The VSGB 2.0 model: A next generation energy model for high resolution protein structure modeling. Proteins Struct Funct Bioinforma. 2011;79:2794–2812. doi:10.1002/prot.23106
- Guimarães CRW, Cardozo M. MM-GB/SA rescoring of docking poses in structure-based lead optimization. J Chem Inf Model. 2008;48:958–970. doi:10.1021/ci800004w
- Dasmahapatra U, Kumar CK, Das S, et al. In-silico molecular modelling, MM/GBSA binding free energy and molecular dynamics simulation study of novel pyrido fused imidazo[4,5-c]quinolines as potential anti-tumor agents. Front Chem. 2022;10:991369. doi:10.3389/fchem.2022.991369.
- Iqbal D, Rehman MT, Alajmi MF, et al. Multitargeted virtual screening and molecular simulation of natural product-like compounds against GSK3β, NMDA-receptor, and BACE-1 for the management of Alzheimer’s disease. Pharmaceuticals. 2023;16:622. doi:10.3390/ph16040622.
- Bowers KJ, Chow DE, Xu H, et al. Scalable algorithms for molecular dynamics simulations on commodity clusters. In: ACM/IEEE SC 2006 Conf., IEEE; 2006. p. 43. doi:10.1109/SC.2006.54
- Shivakumar D, Williams J, Wu Y, et al. Prediction of absolute solvation free energies using molecular dynamics free energy perturbation and the OPLS force field. J Chem Theory Comput. 2010;6:1509–1519. doi:10.1021/ct900587b
- Grant BJ, Skjaerven L, Yao X-Q. The Bio3D packages for structural bioinformatics. Protein Sci. 2021;30:20–30. doi:10.1002/pro.3923
- Palma J, Pierdominici-Sottile G. On the uses of PCA to characterise molecular dynamics simulations of biological macromolecules: basics and tips for an effective use. Chem Phys Chem. 2023;24:e202200491. doi:10.1002/cphc.202200491.
- Newman CB, Preiss D, Tobert JA, et al. Statin safety and associated adverse events a scientific statement from the American Heart Association. Arterioscler Thromb Vasc Biol. 2019;39:E38–E81. doi:10.1161/ATV.0000000000000073
- Norata GD, Tibolla G, Catapano AL. Statins and skeletal muscles toxicity: from clinical trials to everyday practice. Pharmacol Res. 2014;88:107–113. doi:10.1016/j.phrs.2014.04.012
- Reiner Ž. Resistance and intolerance to statins. Nutr Metab Cardiovasc Dis. 2014;24:1057–1066. doi:10.1016/j.numecd.2014.05.009
- Thompson PD, Panza G, Zaleski A, et al. Statin-associated side effects. J Am Coll Cardiol. 2016;67:2395–2410. doi:10.1016/j.jacc.2016.02.071
- Atanasov AG, Zotchev SB, Dirsch VM, et al. Natural products in drug discovery: advances and opportunities. Nat Rev Drug Discov. 2021;20:200–216. doi:10.1038/s41573-020-00114-z
- Ma X, Chen C, Yang J. Predictive model of blood-brain barrier penetration of organic compounds1. Acta Pharmacol Sin. 2005;26:500–512. doi:10.1111/j.1745-7254.2005.00068.x
- Leão RP, Cruz JV, da Costa GV, et al. Identification of new rofecoxib-based cyclooxygenase-2 inhibitors: a bioinformatics approach. Pharmaceuticals. 2020;13:209. doi:10.3390/ph13090209
- Bittermann K, Goss K-U. Predicting apparent passive permeability of Caco-2 and MDCK cell-monolayers: A mechanistic model. PLoS One. 2017;12:e0190319. doi:10.1371/journal.pone.0190319
- Yamashita S, Furubayashi T, Kataoka M, et al. Optimized conditions for prediction of intestinal drug permeability using Caco-2 cells. Eur J Pharm Sci. 2000;10:195–204. doi:10.1016/S0928-0987(00)00076-2
- Zanger UM, Schwab M. Cytochrome P450 enzymes in drug metabolism: regulation of gene expression, enzyme activities, and impact of genetic variation. Pharmacol Ther. 2013;138:103–141. doi:10.1016/j.pharmthera.2012.12.007
- Neves Cruz J, Santana de Oliveira M, Gomes Silva S, et al. Insight into the interaction mechanism of nicotine, NNK, and NNN with cytochrome P450 2A13 based on molecular dynamics simulation. J Chem Inf Model. 2020;60:766–776. doi:10.1021/acs.jcim.9b00741
- Ram H, Jaipal N, Charan J, et al. Phytoconstituents of an ethanolic pod extract of Prosopis cineraria triggers the inhibition of HMG-CoA reductase and the regression of atherosclerotic plaque in hypercholesterolemic rabbits. Lipids Health Dis. 2020;19:6. doi:10.1186/s12944-020-1188-z
- Dougherty DA. Cation-π interactions in chemistry and biology: a new view of benzene, Phe, Tyr, and Trp. Science (80-.). 1996;271:163–168. doi:10.1126/science.271.5246.163
- Ma JC, Dougherty DA. The Cationminus signpi interaction. Chem Rev. 1997;97:1303–1324. doi:10.1021/cr9603744
- Wintjens R, Liévin J, Rooman M, et al. Contribution of cation-pi interactions to the stability of protein-DNA complexes. J Mol Biol. 2000;302:395–410. doi:10.1006/jmbi.2000.4040
- Gallivan JP, Dougherty DA. Cation-pi interactions in structural biology. Proc Natl Acad Sci USA. 1999;96:9459–9464. doi:10.1073/pnas.96.17.9459
- Zacharias N, Dougherty DA. Cation-pi interactions in ligand recognition and catalysis. Trends Pharmacol Sci. 2002;23:281–287. doi:10.1016/S0165-6147(02)02027-8
- Banerjee P, Erehman J, Gohlke B-O, et al. Super natural II—a database of natural products. Nucleic Acids Res. 2015;43:D935–D939. doi:10.1093/nar/gku886
- Istvan ES, Palnitkar M, Buchanan SK, et al. Crystal structure of the catalytic portion of human HMG-CoA reductase: insights into regulation of activity and catalysis. EMBO J. 2000;19:819–830. doi:10.1093/emboj/19.5.819
- David CC, Jacobs DJ. Principal component analysis: a method for determining the essential dynamics of proteins. Methods Mol Biol. 2014;1084:193–226. doi:10.1007/978-1-62703-658-0_11.
- Ashraf N, Asari A, Yousaf N, et al. Combined 3D-QSAR, molecular docking and dynamics simulations studies to model and design TTK inhibitors. Front Chem. 2022;10:1003816. doi:10.3389/fchem.2022.1003816
- Iqbal D, Khan MS, Khan A, et al. In vitro screening for β -hydroxy- β -methylglutaryl-CoA reductase inhibitory and antioxidant activity of sequentially extracted fractions of Ficus palmata Forsk. Biomed Res Int. 2014;2014:1–10. doi:10.1155/2014/762620