
 ?Mathematical formulae have been encoded as MathML and are displayed in this HTML version using MathJax in order to improve their display. Uncheck the box to turn MathJax off. This feature requires Javascript. Click on a formula to zoom.
Abstract
A novel poly (glutamic acid)-modified graphene carbon paste sensor (PGMGCPS) was developed by the electro-polymerization technique for the analysis of Pyridoxine (PYX). Scanning electron microscopy (SEM), X-ray diffraction (XRD), Energy dispersive X-ray (EDX) and Electrochemical impedance spectroscopy (EIS) were employed to gain a deep insight into the surface modification and elemental analysis of the unmodified graphene carbon paste sensor (UGCPS) and PGMGCPS. The study of the impact of scan rate on the PYX analysis at the PGMGCPS surface revealed that the oxidation process is diffusion-controlled and at an optimum pH of 6.0 of PBS (phosphate buffer solution, 0.2 M) , the sensor demonstrated a detection limit (DL) of 0.09 × 10⁻⁷ M and 0.35 × 10⁻⁶ M through CV and DPV methods, respectively. A probe into the crucial attributes like repeatability, reproducibility, stability and concurrent analysing capacity signified the designed sensor as an efficient electrochemical tool to analyse PYX in food and pharmaceutical samples.
1. Introduction
A healthy lifestyle emphasize the importance of a balanced diet which provides the necessary vitamins, nutrients and minerals for the maintenance of cells, tissues and other organs of the human body [Citation1]. Vitamins are organic micronutrients with various biological roles in human nutritional and metabolic processes [Citation2]. PYX, commonly known as Vitamin B6, is one form of water-soluble Vitamin B which is converted into an active form called Pyridoxal 5′ – phosphate [Citation3]. This active form has a role of a crucial cofactor in several enzymes-induced physiological processes like biosynthesis of sphingolipids, gluconeogenesis, neurotransmitters and metabolism of various amino acids [Citation4]. PYX has various medical applications such as in the treatment of anaemia, pregnancy sickness and radiation sickness and for various pathological disorders [Citation5,Citation6]. PYX is an essential vitamin which is vital for the brain and immune system functioning, transportation of oxygen around the body, neurotransmitter production and assists in other physiological processes as well. PYX is supplied through both processed and unprocessed foods which are fortified to improve people’s health [Citation7]. The growing interest has given rise to the development of many methods for the quantitative and qualitative analysis and detection of the PYX in various food and pharmaceutical samples [Citation8]. The deficiency of PYX causes central nervous system-related serious diseases such as Parkinson’s and Schizophrenia [Citation9].
The rising requirement and production of both known and novel derivatives with pharmaceutical action involves the call for developing and implementing simplistic and reliable methods for the analysis and detection of the naturally present and manufactured PYX derivatives. Spectrophotometric methods [Citation10], HPLC (high-performance liquid chromatography) [Citation11,Citation12], RP-HPLC (reversed-phase high-performance liquid chromatography) [Citation13–15], the chemiluminescent method [Citation16], liquid chromatography [Citation17], potentiometric methods [Citation18] have been employed to determine PYX in various food and pharmaceutical samples. However, these techniques are expensive and laborious and hence cannot be applied for the determination and analysis of all compounds [Citation19]. Among the extensively used analytical techniques, the electrochemical methods are almost certainly the most rapid, the most modest and those exhibit greatest performance [Citation20–24]. The voltammetric methods like CV and DPV are very adaptable and reliable as they provide ample experimental details and insights into both the thermodynamic and kinetic aspects of various chemical systems [Citation25–27]. In addition, these techniques are simple and sensitive and provide great results within a shorter analysis time than conventional methods in the detection of various biological and pharmaceutical samples [Citation28,Citation29].
Large surface area, high chemical and thermal stability, superior conductivity, high mechanical strength and biocompatibility of carbonaceous materials are attributed to their widespread applications in electro-analytical techniques [Citation30]. The morphological structure of carbonaceous materials can be altered and elements contained in its chemical structure can be modified [Citation31,Citation32]. This can be achieved by chemical methods and the modification results in an amorphous carbon material with enhanced surface area with larger pores [Citation33–36]. Graphene, an allotrope of carbon with a two-dimensional nanostructure network, possesses a large surface area with exceptional thermal conductivity [Citation37,Citation38]. These qualities contribute to the enhanced sensitivity of the sensors comprising graphene as electrode material, resulting in superior catalytic activity and improved kinetics of the electrochemical process [Citation39,Citation40].
This novel approach towards the effective determination and analysis of PYX involves the electro-polymerization of GA on the graphene-carbon composite electrode surface. The outcome of the various assessments proves the designed electrode to be affordable, efficient, reliable and practically sensitive towards PYX detection.
2. Materials and methods
2.1. Reagents and their procurement
PYX (99.9% pure) and glutamic acid (99% pure) were bought from Molychem, Mumbai, India. Graphite powder (94% pure), disodium hydrogen phosphate (purity of 99.5%,), monosodium dihydrogen phosphate (99% pure) and Silicone oil (90% pure) were obtained from Nice Chemicals, Cochin, India. Graphene nanoplatelets (6–8 nm thick, 5 µm wide) were procured from the Tokyo chemical industry, Tokyo, Japan. All the reagents and chemicals utilized in the analysis were of analytical reagent grade. The necessary solutions were freshly made by dissolving a calculated amount of chemicals in double distilled water (DDW). DDW required for the analysis was obtained from a VITSIL-VBSD/VBDD purification chamber.
2.2. Real sample preparation
PYX tablets bought from the local medical store were crushed and dissolved in DDW. Whatman filter paper was used to filter the solution and the filtrate obtained was centrifuged. The clear supernatant solution was used for the analysis.
Potatoes procured from the local market were peeled and then ground separately to extract the juice. The juice obtained was diluted with DDW and Whatman filter paper was used to filter the solution and the filtrate obtained was centrifuged. The clear supernatant solution was used for the analysis.
2.3. Instrumentation
Voltammetric measurements were recorded in a computer-equipped electrochemical analyzer, CHI-6038E (USA). This is configured with three electrodes, a calomel electrode (reference electrode), a platinum electrode (counter electrode) and a working electrode (PGMGCPS/ UGCPS). The surface characterizations of the sensors were performed using SEM, EDX and XRD instruments at the Research Laboratory, Vijnana Bhavan, University of Mysore.
2.4. Sensor fabrication
The preferred sensors were developed using the conventional and established approach.
UGCPS: The composite was prepared by hand mixing the graphene nanoplatelets and graphite powder. Silicone oil is added to the composite mixture as a binder and blended well in an agate mortar for around 15 min to obtain a well-mixed paste. This paste was meticulously pressed into the 3 mm groove of the Teflon tube and rubbed on a soft tissue paper to achieve an even surface. Electrical connectivity is established by the insertion of a copper wire through the Teflon tube.
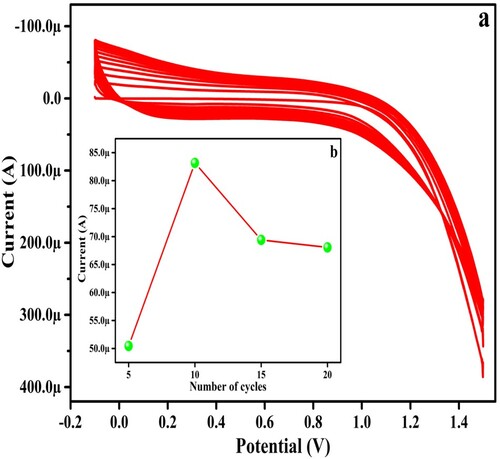
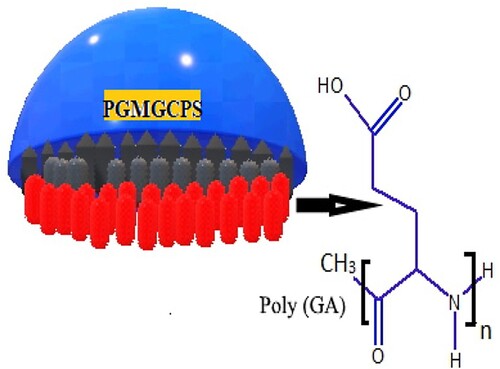
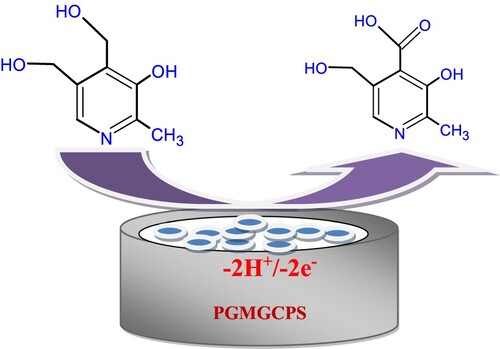
PGMGCPS: The UGCPS was subjected to electro-polymerization with 1 mM GA in supporting electrolyte (pH 5.5, 0.2 M PBS) at 0.1 V/s scan rate by the CV method in the potential gap of −0.1 to 1.5 V for 20 segments (10 cycles), as depicted in Figure (a). The developed PGMGCPS surface was rinsed carefully with DDW to remove the unabsorbed GA if any. Before this, the number of cycles was optimized by recording CV for 5, 10, 15 and 20 cycles. The number of polymerization cycles highly influences the electrochemical conduct of PYX at the developed electrode surface. The result portrayed that the electro-polymerization for 10 cycles yielded the highest anodic peak current for PYX in pH 6.0 (Figure (b)). During the process, the monomer GA progressively forms a poly (GA) layer on UGCPS transforming it into a highly conductive polymer-based sensor (as depicted in Scheme 1). This conductive polymer layer shows a strong covalent and hydrophobic interaction with the UGCPS surface [Citation41]. The formation of a poly (GA) layer on the amalgamated nano-structured graphene and the graphite powder yields a sensor which is highly porous with amplified electro-active sites and an enlarged electro-active surface area. These attributes of the proposed PGMGCPS contribute to excellent and impressive electrocatalytic activities.
Figure 1. CV response for (a) electro polymerization of GA on UGCPS at −0.2 to 1.5 V potential window (b) number of cycles versus peak current.
Scheme 1. Pictorial representation of poly (GA) layer on the PGMGCPS surface.
Bare carbon paste sensor (BCPS): BCPS was prepared by blending graphite powder and silicone oil in a ratio of 70:30 for 15 min in an agate mortar. The obtained homogeneous paste was filled into a Teflon tube, as mentioned in the above procedure (fabrication of UGCPS). The resulting sensor was used to compare the effectiveness of the sensor material.
3. Results and discussions
3.1. Influence of electrode material on oxidation peak current of PYX
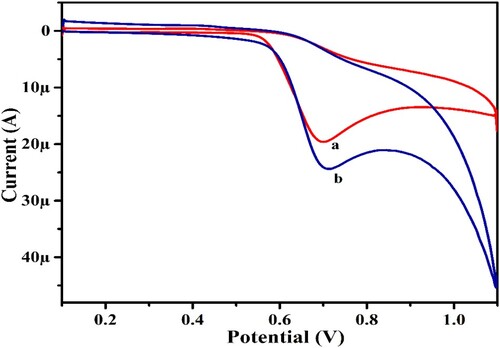
The electrocatalytic performance of PYX was investigated at BCPS and UGCPS surfaces to compare the sensing capacity of the sensor material. Figure symbolizes the CV recorded for 1.0 mM PYX in 0.2 M PBS at a scan rate of 0.1 V/s at BCPS (curve “a” with an oxidation peak current of 19.69 µA) and UGCPS (curve “b” with an oxidation peak current of 24.46 µA) surfaces. The UGCPS, a composite sensor material made of graphene nanoplatelets and graphite powder, exhibits higher current sensitivity than the BCPS made of graphite powder alone. This comparative analysis prompted us to select the composite as the sensor material and electro-polymerization of UGCPS further increased the efficacy and sensitivity for the analysis of PYX (discussed in Section 3.3).
Figure 2. CV output for PYX at BCPS (curve a) and UGCPS (curve b) at a scan rate of 0.1 V/s.
3.2. Morphological study of the electrode surface and active surface area calculation
SEM, XRD, EIS, EDX and CV methods were applied to investigate the morphology of the electrode surfaces and elemental composition and to calculate the active surface area of UGCPS and PGMGCPS.
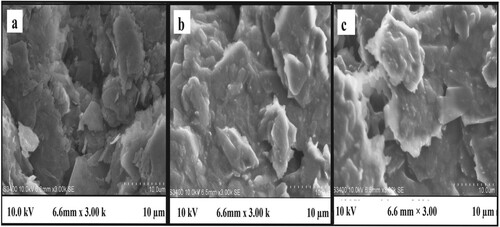
SEM analysis: Figure (a) depicts the external structure of bare carbon paste, Figure (b,c) represents the SEM images which reveal the difference in the surface morphology of UGCPS and PGMGCPS, respectively. The unmodified sensor shows an even and thick film of carbon on the surface and the modified sensor surface displays the deposition of dense spongy-like structures. The variation in the surface morphology accounts for the proliferated surface area and the enhanced electro-catalytic performance.
Figure 3. SEM images of (a) carbon paste, (b) graphene-carbon paste composite (c) PGMGCPS.
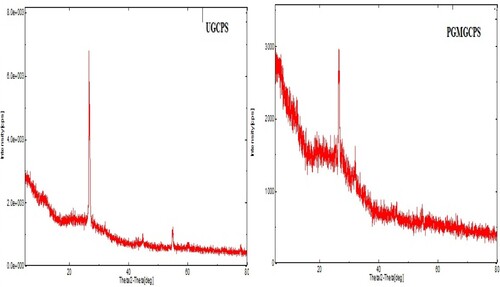
XRD analysis: Figure depicts the XRD images of the working electrode material which provides a profound insight into the crystal structure of the components. The analysis was performed at 5° to 80° and the UGCPS revealed peaks at 2θ = 26.6, 26.9, 32.05 and 54.64 at high intensity. These intense peaks symbolize the crystalline structure of graphite and graphene composite. Contrarily, the PGMGCPS showed diffraction patterns at 2θ = 26.5 and 32.08 at lower intensity. It is evident from the images that the diffraction patterns are asymmetric due to the scattering of the polymer matrix with slightly amorphous structures [Citation42,Citation43].
Figure 4. XRD images of UGCPS and PGMGCPS.
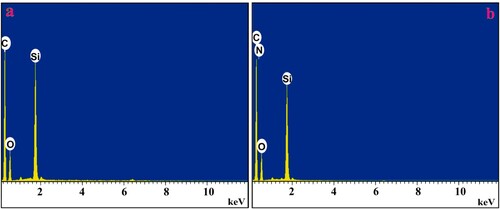
EDX analysis: The elemental composition of the working electrodes was analysed by the EDX technique. The outcome revealed that the UGCPS comprises carbon (C), oxygen (O) and silicon (Si), as represented in Figure (a). In Figure (b), the composition of PGMGCPS portrays the presence of an additional element Nitrogen (N) which is purely due to the poly (GA) layer. Hence, the analysis authenticates the successful electro-polymerization in attaining the desired PGMGCPS sensor.
Figure 5. EDX images of (a) UGCPS and (b) PGMGCPS.
EIS: EIS, an efficient method, was utilized to examine the electro-catalytic behaviour and conductivity of the working electrodes. The investigation was carried out at optimum conditions with K4[Fe(CN)6] (1.0 mM) in KCl (0.1 M, supporting electrolyte). The Nyquist plot was derived from the values obtained and an equivalent electric circuit, comprising salient parameters such as Rs (solution resistance), Rct (charge transfer resistance), CPE (constant phase element) and W (Warburg impedance), was fitted according to the Nyquist plot (Figure (b)). The Nyquist plot displays the larger semicircle with a higher Rct value (220 Ω) for UGCPS and the comparatively smaller semicircle with a lower Rct value (165 Ω) for PGMGCPS and these data authenticate that the effective activation of the UGCPS surface via electro-polymerization (with GA) was successfully achieved. This modification elevated the electro-catalytic performance and conductive nature of PGMGCPS.
Figure 6. (a) CV output of 1 mM K4 [Fe (CN)6], curve a for UGCPS and curve b for PGMGCPS in 0.1 M KCl, (b) Nyquist plots, curve a for UGCPS and curve b for PGMGCPS with an equivalent electric circuit.
![Figure 6. (a) CV output of 1 mM K4 [Fe (CN)6], curve a for UGCPS and curve b for PGMGCPS in 0.1 M KCl, (b) Nyquist plots, curve a for UGCPS and curve b for PGMGCPS with an equivalent electric circuit.](/cms/asset/4faa222c-138c-42a1-b9ab-6fae141b2670/tusc_a_2359209_f0006_oc.jpg)
CV was recorded for 1.0 mM K4[Fe (CN)6] in 0.1 M KCl as a supporting electrolyte at the surface of UGCPS and PGMGCPS at a potential range of −0.2 V to 0.6 V (at 0.1 V/s scan rate). Figure (a) shows the current sensitivity for UGCPS (curve a) and PGMGCPS (curve b). The modified sensor exhibits a fine peak with high current sensitivity compared to the unmodified sensor. The electro-active surface area (A) of UGCPS and PGMGCPS was evaluated by employing the Randles-Sevcik equation,
(1)
(1) where “Ipa” is the peak current at the anode (µA), “n” represents the number of electrons, “D” is the diffusion co-efficient (7.6 × 10⁻⁶ cm2/s), C is the concentration of PYX (mM) and “ν” denotes the scan rate (V/s). The active surface area was 0.0112 cm2 for UGCPS and 0.1027 cm2 for PGMGCPS. The higher active surface area for the electro-chemically modified sensor confirms the GA polymer layer formation on UGCPS elevating the sensing power and resulting in superior electro-catalytic activity.
3.3. Electro-catalytic action of the sensors towards PYX
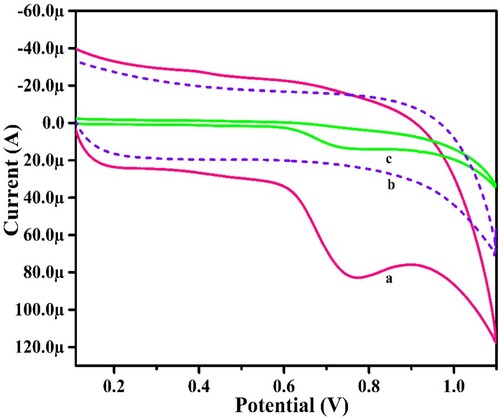
The electro-catalytic activities of UGCPS and PGMGCPS towards the oxidation of PYX were assessed using the CV technique. CV measurements were made for both the sensors in the presence of PYX in 0.2 M PBS (pH of 6.0) at 0.1 V/s scan rate and in the absence of PYX as well. Figure shows that the PGMGCPS (curve a) generates a highly sensitive and elevated anodic peak current than that of the UGCPS (curve c) for PYX. PGMGCPS surface does not disclose any electrochemical behaviour for only PBS (without PYX, curve b). According to the obtained CV data, the greater electrochemical response of PYX with a faster rate of electron transfer at the PGMGCPS surface is due to the electrochemical modification which enhanced the active surface area resulting in high conductivity.
Figure 7. CV depiction of PYX in 0.2 M PBS (pH 6.0) at UGCPS (curve c) and at PGMGCPS (curve a), only PBS at PGMGCPS (curve b) at a scan rate of 0.1 V/s.
3.4. Influence of accumulation time
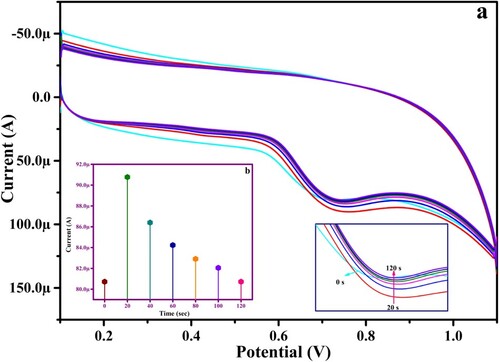
The accumulation time of PYX on the PGMGCPS surface greatly affects the electro-chemical activity and this was studied at optimal conditions. Figure (a,b) portrays the anodic peak current of 1.0 mM PYX versus the accumulation time which indicates the upliftment of the current sensitivity from 0 s (s) to 20 s and then the sensitivity decreases with time. The accumulation time of 20 s displays a very definite anodic peak with high current due to the saturation of PYX at the 20th second on the surface of the fabricated sensor. Further analysis of PYX at PGMGCPS was conducted by considering the accumulation time of 20 s.
Figure 8. (a) CV output of PYX (1.0 mM in PBS of pH 6.0) at PGMGCPS at varied time intervals (b) plot of anodic peak current versus accumulation time.
3.5. Study of the effect of pH on peak current
The pH of the PBS has a great influence on the electro-catalytic activities of the target molecules at the surface of the sensor. This was examined by recording the CVs for 0.1 mM PYX in PBS (0.2 M) in various pH solutions ranging from 5.5 to –8.0 (Figure (a)). This variation is due to the difference in the electrostatic attraction and repulsion between the PYX and the surface of the proposed sensor. Figure (c) depicts the Epa versus pH graph, from which it is evident that Epa values decline from 0.8199 to 0.5935 V as the pH is varied from 5.5 to –8.0. The linear regression equation (LRE) is represented as
(2)
(2)
Figure 9. (a) CV for 1.0 mM PYX at PGMGCPS surface at different pH, (b) plot of Ipa versus pH, (c) Epa versus pH graph.
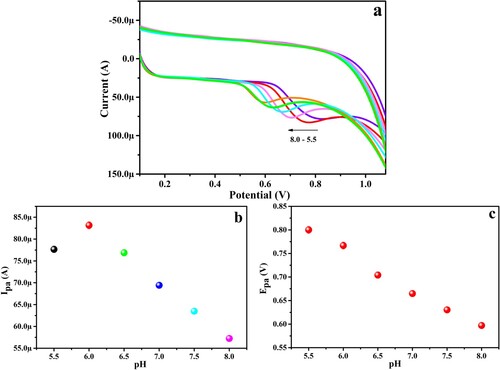
The slope value of 0.0825 in the above equation is approximately closer to the theoretically existent slope value and this indicates that the oxidation of PYX on the surface of PGMGCPS involves an equal number of electrons and protons. The augmentation of the oxidation peak current is observed for pH 6.0 and at lower and higher pH the peak current degrades. Hence, pH 6.0 is considered the optimal pH for the analysis of PYX at the PGMGCPS surface.
3.6. Influence of potential sweep rate on anodic peak current
CVs recorded for various scan rates altered from 0.025 – 0.325 V/s for 1.0 mM PYX in pH 6.0 at the surface of PGMGCPS as depicted in Figure (a). The current peak at the anode (Ipa) enhances with the ascending potential sweep rates and the peak potential (Epa) shifts towards the positive values. Figure (b) represents the linearity of Ipa with the square root of the scan rate and LRE can be represented as
(3)
(3)
Figure 10. CV output of (a) anodic peak current versus peak potential at varying scan rate from 0.025 to 0.325 V/s (b) plot of Ipa versus ν1/2 (c) plot of log Ipa versus log ν (d) graph of Epa versus log ν.
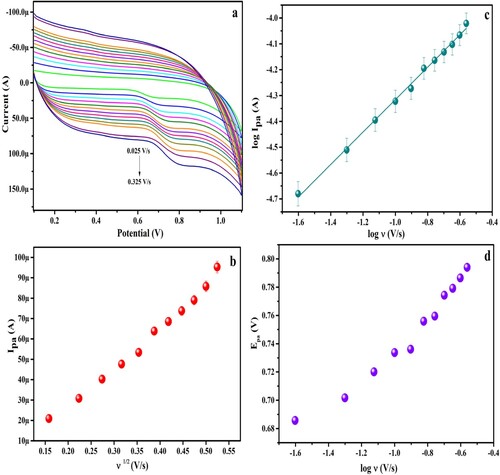
The LRE for log Ipa versus log ν graph (Figure (c)) can be written as
(4)
(4)
The R2 value of 0.9967 (≈1) in Equation (3) and slope value of 0.62 (approximately close to 0.5) in Equation (4) reveals that the electron transfer process is diffusion-controlled kinetics. Figure (d) portrays the graph of Epa versus log ν and LRE can be expressed as below
(5)
(5)
The slope obtained from Equation (5) was applied in Laviron’s equation [Citation44] to evaluate the number of electrons involved in the electrochemical oxidation of PYX.
(6)
(6) where “n” represents the electron count involved in the oxidation of PYX, “E0” denotes the standard redox potential, “α” denotes the charge transfer co-efficient, k0 is the heterogeneous rate constant (/s), “R” is the universal gas constant (8.314 J/mol/K), “T” is the absolute temperature (298 K), “Epa” is the peak potential, “ν” is the scan rate and “F” is the Faraday’s constant (96,485 C/mol). Upon substitution, the number of electrons “n” was 1.99 ≈ 2 and the possible electrochemical oxidation of PYX has been depicted in Scheme 2.
Scheme 2. Oxidation of PYX on the PGMGCPS surface.
Furthermore, the surface coverage area (Γ) of PGMGCPS was calculated using the below equation
(7)
(7) where “Q” is the charge availed from the area under the peak, “n” denotes the number of electrons, “F” represents Faraday’s constant and “A” is the electro-active surface area. The corresponding values were substituted in Equation (7) and the obtained surface coverage area was 10.12 ÅM cm−2.
3.7. Limit of detection, limit of quantification and sensitivity
At optimal conditions, DL and QL of PYX of the modified and developed sensor were evaluated with DPV and CV methods. CV and DPV were recorded by increasing the concentration of PYX in 0.2 M PBS (pH 6.0), as represented in Figure (a,c), respectively. The linear relationship between varied concentrations and Ipa of PYX was studied and has been depicted in Figure (b,d). The LRE can be expressed as below
(8)
(8)
(9)
(9)
Figure 11. Peak current versus peak potential for various concentrations of PYX ranging from 0.1 to 1.0 µM (a) CV response, (c) DPV response, (b) & (d) corresponding calibration curves.
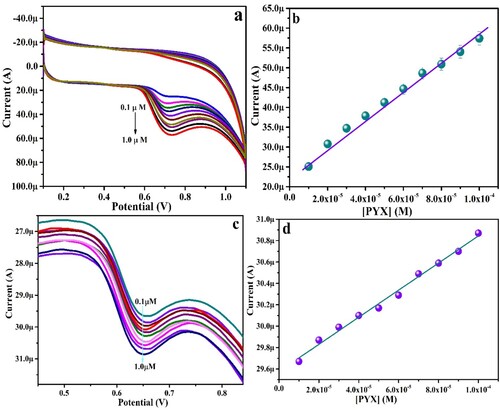
The DL and QL values were calculated by the equations, DL = 3 S/N and QL = 10 S/N, where, “S” is the standard deviation of the blank and “N” is the slope of Ipa versus [PYX]. The DL and QL were 0.35 and 1.17 µM by DPV and 0.009 and 0.03 µM, respectively by CV. A comparison of the developed sensor with a few earlier reported works for PYX detection is tabulated in Table . From the available information, it can be concluded that the fabricated sensor in the current work exhibits an improved electro-catalytic response for PYX assessment by the DPV and CV method with a lower DL.
Table 1. Techniques, electrodes and DLs of reported works.
3.8. Concurrent analysis of PYX and Rutin (RTN)
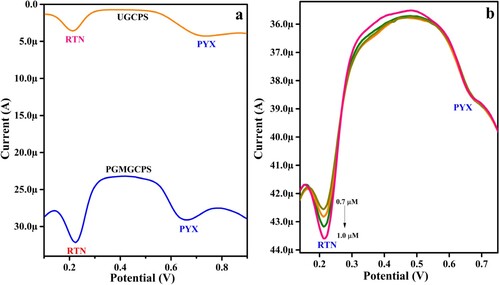
DPV technique was employed to assess the selectivity of the PGMGCPS in the detection of PYX even in the presence of other molecules. The selectivity of both UGCPS and PGMGCPS was inspected and compared towards the oxidation of 1 mM PYX in the presence of 1 mM RTN. Both PYX and RTN vitamins are present in various fruits and vegetables. These molecules readily undergo electrochemical oxidation in the same potential window and hence exhibit excellent electrochemical activity when analysed simultaneously. It is evident from Figure (a) that UGCPS displays less sensitive anodic peaks for PYX and RTN. Contrarily, PGMGCPS reveals well-defined anodic oxidation peaks with relatively elevated current for both PYX and RTN. The DPV data demonstrates that the electro-catalytic performance of PGMGCPS in PYX analysis in the presence and absence of RTN is similar, thus validating the efficiency of PGMGCPS in selectively detecting PYX even in the presence of similar chemical species. Furthermore, the concentration of RTN varied from 0.7 µM to 1.0 µM (keeping the PYX concentration constant). The analysis (as depicted in Figure (b)) resulted in increased oxidation peak current as the RTN concentration was increased, thus authenticating the potentiality of the proposed sensor in PYX detection.
Figure 12. DPV depicting (a) simultaneous detection of PYX and RTN at the UGCPS and PGMGCPS surface in 0.2 PBS and (b) concentration variation of RTN with constant PYX.
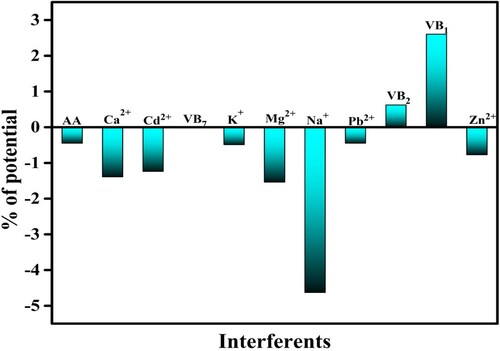
3.9. Impact of interfering ions and vitamins
The impact of the interfering metal ions and other vitamins on the oxidation peak potential was examined. The investigation was carried out for 1 mM PYX in PBS (0.2 M, pH 6.0) at 0.1 V/s scan rate at the PGMGCPS surface. The outcome revealed that the peak potential values were affected and varied to some extent but did not exceed the ±5% limit which has been represented in Figure . This indicates that the presence of interfering molecules will not have an effect on PYX detection at the PGMGCPS surface.
Figure 13. CV response depicting the variation of potential versus interfering species.
3.10. Food and pharmaceutical sample analysis
For validating the applicability of PGMGCPS in real samples, the CV technique was applied for the detection of PYX in pharmaceutical and food samples. The PGMGCPS produced recoveries of approximately 97% (in food samples) and 95% to 97% (in pharmaceutical samples) through the spike addition method and the same has been represented in Table . These data reveal that PGMGCPS is an apt tool for PYX analysis in food and pharmaceutical samples as well, with an excellent recovery rate.
Table 2. Recovery rate of real samples.
3.11. Reproducibility, repeatability and stability of PGMGCPS
The reproducibility of the PGMGCPS was assessed by documenting CV with the same PYX in 0.2 M PBS with five developed sensors. A relative standard deviation (RSD) of 4.88% was exhibited by PGMGCPS, signifying superior reproducibility. Additionally, the repeatability of the projected sensor was assessed by recording CV with five different PYX in 0.2 M PBS with the same PGMGCPS. The sensor provided a relative standard deviation (RSD) of 4.60%, suggesting higher repeatability. The proposed sensor’s stability in PYX detection was done by recording CV for 30 cycles. The results reveal that 98.58% of the initial peak current was restored, hence validating the appreciable stability of the sensor.
4. Conclusion
The present work constitutes the development of a highly sensitive, selective, reliable, electrochemically polymerized sensor for the analysis of PYX. The proposed PGMGCPS in this work exhibits an enhanced electro-catalytic behaviour compared to the UGCPS in the PYX analysis employing CV and DPV techniques. The EIS study enabled the evaluation of the electro-active surface area to be 0.0112 cm2 for UGCPS and 0.1027 cm2 for PGMGCPS. The surface coverage area (Γ) was 10.12 ÅM cm−2 and the augmentation in the electro-active surface area substantiates the increased electrochemical performance of PGMGCPS. An insight into the impact of pH and scan rate discloses the diffusion-controlled kinetics involving two electrons and two protons transfer in the oxidation of PYX in 0.2 M PBS. Furthermore, a low DL of 0.09 × 10⁻⁷ M and 0.35 × 10⁻⁶ M was obtained for PGMGCPS through CV and DPV methods, respectively, with good linearity. The developed sensor shows high reproducibility (RSD = 4.88%), repeatability (RSD = 4.60%) and stability (with 98.58% of the initial current restoration) making it an efficient device for the analysis of PYX in pharmaceutical and food samples with a convincing rate of recovery.
Ethical issues
No ethical issues for this work.
Acknowledgements
J.G. Manjunatha gratefully acknowledges the financial support from VGST, Bangalore under the Research project. No. KFIST(L2)/GRD-1020/2021-22/430. Sameh M. Osman gratefully acknowledges the financial support from Researchers Supporting Project Number (RSP2024R405), King Saud University, Riyadh, Saudi Arabia.
Disclosure statement
No potential conflict of interest was reported by the author(s).
Additional information
Funding
References
- Dede AN. Study on awareness of nutritional balanced diet and eating practices among college students. IJRCS. 2020;4(4):305–310.
- Hueda MC. Functional food – improve health through adequate food; 2017. Available from: doi:10.5772/66263
- EFSA panel members. Scientific opinion on the safety and efficacy of vitamin B6 as a feed additive for all animal species. EFSA J. 2011;9(5):1–14. doi:10.2903/j.efsa.2011.2171
- National Center for Biotechnology Information. PubChem compound summary for CID 6019, pyridoxine hydrochloride; 2023. [cited 2023 Oct 4]. Available from: https://pubchem.ncbi.nlm.nih.gov/compound/PYXridoxine-Hydrochloride.
- Zeng Q, Chen L, Song X, et al. Determination of vitamin B6(Pyridoxine hydrochloride) based on a novel BZ oscillating reaction system catalyzed by a macrocyclic complex. Cent Eur J Chem. 2014;12(3):325–331. doi:10.2478/s11532-013-0383-4
- Atty SA, El-Hadi HRA, Eltanany BM. Analytical eco-scale for evaluating the uniqueness of voltammetric method used for determination of antiemetic binary mixture containing doxylamine succinate in presence of its toxic metabolite. Electrocatalysis. 2022;13:731–746. doi:10.1007/s12678-022-00751-5
- Westmacott KL, Crew A, Doran O, et al. A novel electroanalytical approach to the measurement of B vitamins in food supplements based on screen-printed carbon sensors. Talanta. 2018;181:13–18. doi:10.1016/j.talanta.2017.12.074
- Söderhjelm P, Lindquist J. Voltammetric determination of pyridoxine by use of a carbon paste electrode. Analyst. 1975;100:349. doi:10.1039/an9750000349
- Rocha JB, Benetti MAG, Matsubara TEA, et al. Voltammetric determination of vitamin B6 using carbon paste electrode with Cu(II) and intercalated in lamellar crystalline compound. Braz J Dev. 2022;8:54769–54779. doi:10.34117/bjdv8n8-005
- Habib NM, Abdelwhab NS, Abdelrahman MM, et al. Spectrophotometric methods for analysis of different dosage forms containing pyridoxine hydrochloride. Eur J Chem. 2016;7(1):30–36. doi:10.5155/eurjchem.7.1.30-36.1350
- Marszałl ML, Lebiedzińska A, Czarnowski W, et al. High-performance liquid chromatography method for the simultaneous determination of thiamine hydrochloride, pyridoxine hydrochloride and cyanocobalamin in pharmaceutical formulations using coulometric electrochemical and ultraviolet detection. J Chromatogr A. 2005;1094(1–2):91–98. doi:10.1016/j.chroma.2005.07.091
- Mahmood HS, Ahmad RR. Determination of vitamin B6 (pyridoxine hydrochloride) in pharmaceutical preparations using high performance liquid chromatography. Iraqi J Sci. 2019;60(5):943–951. doi:10.24996/ijs.2019.60.5.2
- Nawaz MS. A new validated stability indicating RP-HPLC method for simultaneous estimation of pyridoxine hydrochloride and meclizine hydrochloride in pharmaceutical solid dosage forms. Chromatogr Res Int. 2013;2013:1–7. doi:10.1155/2013/747060
- Bartzatt R, Gajmer P, Nguygen MHC, et al. Assay of vitamin B6 (pyridoxine hydrochloride) utilizing isocratic reversed phase high performance liquid chromatography. In: S Tuzemen, F Khan, editors. Advances in applied science and technology. Omaha: Chemistry Faculty Publications; 2019. p. 12–26. doi:10.9734/bpi/aast/v3
- Lebiedzińska A, Marszałł ML, Grembecka M. Detection of B6 vitamers in grain products: experimental and computational studies. Food Anal Methods. 2018;11:725–732. doi:10.1007/s12161-017-1045-5
- Alwarthan AA, Aly FA. Chemiluminescent determination of pyridoxine hydrochloride in pharmaceutical samples using flow injection. Talanta. 1998;45(6):1131–1138. doi:10.1016/s0039-9140(97)00223-3
- Goldschmidt RJ, Wolf WR. Determination of pyridoxine in dietary supplements by liquid chromatography with UV, fluorescence, and mass spectrometric detection: single-laboratory validation. J AOAC Int. 2013;96(2):265–275. doi:10.5740/jaoacint.12-030
- Vaze VD, Srivastava AK. Determination of pyridoxine hydrochloride in pharmaceutical preparations by calixarene based potentiometric sensor. J Pharm Biomed Anal. 2008;47(1):177–182. doi:10.1016/j.jpba.2007.12.030
- Kocak B. A selective and sensitive electrochemical sensor for pyridoxine hydrochloride (vitamin B6) in pharmaceutic tablet. ChemistryEurope. 2023;8(39):45. doi:10.1002/slct.202303112
- Nejad HS, Nejad GF, Beitollahi H. Development of a highly sensitive voltammetric sensor for the detection of folic acid by using MoS2 and ionic liquid-modified carbon paste electrode. ADMET DMPK. 2023;11(3):361–371. doi:10.5599/admet.1823
- Beigmoradi F, Beitollahi H. Fe3O4/GO nanocomposite modified glassy carbon electrode as a novel voltammetric sensor for determination of bisphenol A: original scientific paper. J Electrochem Sci Eng. 2022;12(6):1205–1214. doi:10.5599/jese.1482
- Beitollahi H, Tajik S, Aflatoonian MR, et al. Glutathione detection at carbon paste electrode modified with ethyl 2-(4-ferrocenyl-[1,2,3]triazol-1-yl)acetate, ZnFe2O4 nanoparticles and ionic liquid: original scientific paper. J Electrochem Sci Eng. 2022;12(1):209–217. doi:10.5599/jese.1230
- Beitollahi H, Tajik S, Aflatoonian MR, et al. A sensitive Cu(salophen) modified screen-printed electrode for simultaneous determination of dopamine and uric acid: original scientific paper. J Electrochem Sci Eng. 2022;12(1):199–208. doi:10.5599/jese.1231
- David IG, Buleandra M, Popa DE, et al. Recent developments in voltammetric analysis of pharmaceuticals using disposable pencil graphite electrodes. Processes. 2022;10:472. doi:10.3390/pr10030472
- Taewhan K, Woosung C, Heon – Cheol S, et al. Applications of voltammetry in lithium ion battery research. J Electrochem Sci Technol. 2020;11(1):14–25. doi:10.33961/jecst.2019.00619
- Manjunatha JG. A surfactant enhanced graphene paste electrode as an effective electrochemical sensor for the sensitive and simultaneous determination of catechol and resorcinol. Chem Data Coll. 2020;25:100331. doi:10.1016/j.cdc.2019.100331
- Bond AM, Compton RG, Fiedler DA, et al. Guide to experiments and applications. In: F Scholz, editor. Electroanalytical methods. New York: Springer; 2010. p. 57–106.
- Beitollahi H, Tajik S, Nejad FG, et al. Electroanalytical performance of hierarchical nanostructures of MgCo2O4 on reduced graphene oxide modified screen-printed electrode for the sensitive determination of Sudan I. IJEC. 2023;103(19):7647–7665. doi:10.1080/03067319.2021.1974422
- Tajik S, Beitollahi H, Shahsavari S, et al. Simultaneous and selective electrochemical sensing of methotrexate and folic acid in biological fluids and pharmaceutical samples using Fe3O4/ppy/Pd nanocomposite modified screen printed graphite electrode. Chemosphere. 2022;291:132736. doi:10.1016/j.chemosphere.2021.132736
- Mamidi N, Delgadillo RMV, Barrera EV, et al. Carbonaceous nanomaterials incorporated biomaterials: The present and future of the flourishing field. Compos Part B: Eng. 2022;243:110150. doi:10.1016/j.compositesb.2022.110150
- Cho S, Lee JS. Recent development of morphology controlled conducting polymer nanomaterial-based biosensor. Appl Sci. 2020;10:5889. doi:10.3390/app10175889
- Nguyen TD, Nguyen MTN, Lee JS. Carbon-based materials and their applications in sensing by electrochemical voltammetry. Inorganics. 2023;11:81. doi:10.3390/inorganics11020081
- El-Hossary FM, Ghitas A, El-Rahman AMA, et al. Cold RF oxygen plasma treatment of graphene oxide films. J Mater Sci Mater Electron. 2021;32(12):15718–15731. doi:10.1007/s10854-021-06123-x
- Ali S, Shah IA, Ahmad A, et al. Ar/O2 plasma treatment of carbon nanotube membranes for enhanced removal of zinc from water and wastewater: a dynamic sorption-filtration process. Sci Total Environ. 2019;655:1270–1278. doi:10.1016/j.scitotenv.2018.11.335
- Manjunatha JG. A new electrochemical sensor based on modified carbon nanotube- graphite mixture paste electrode for voltammetric determination of resorcinol. Asian J Pharm Clin Res. 2017;10(12):295. doi:10.22159/ajpcr.2017.v10i12.21028
- Tigari G, Manjunatha JG, Hareesha N, et al. Poly (riboflavin)/NaOH/graphene nanoplatelets modified graphite composite paste electrode for the determination of antioxidant rutin. J Food Meas Charact. 2023;18(2):1–15. doi:10.1007/s11694-023-02253-4
- Kamalasekaran K, Magesh V, Atchudan R, et al. Development of electrochemical sensor using iron (III) phthalocyanine/gold nanoparticle/graphene hybrid film for highly selective determination of nicotine in human salivary samples. Biosensors. 2023;13(9):839. doi:10.3390/bios13090839
- Nagarajan RD, Kavitha J, Atchudan R, et al. Electrochemical analysis of narcotic drugs using nanomaterials modified electrodes – a review. Curr Anal Chem. 2023;19(6):440–447. doi:10.2174/1573411019666230622153225
- Preethika M, Sundramoorthy AK, Nagarajan RD, et al. Electrochemical detection of H2O2 on graphene nanoribbons/cobalt oxide nanorods-modified electrode. J Nanomater. 2022;2022:1–10. doi:10.1155/2022/9866111
- Rajendran J, Kannan TS, Dhanasekaran LS, et al. Preparation of 2D graphene/MXene nanocomposite for the electrochemical determination of hazardous bisphenol A in plastic products. Chemosphere. 2022;287:132106. doi:10.1016/j.chemosphere.2021.132106
- Hareesha N, Manjunatha JG, Amrutha BM, et al. A fast and selective electrochemical detection of vanillin in food samples on the surface of poly (glutamic acid) functionalized multiwalled carbon nanotubes and graphite composite paste sensor. Colloids Surf A: Physicochem Eng Asp. 2021;626:127042. doi:10.1016/j.colsurfa.2021.127042
- Popova AN. Crystallographic analysis of graphite by X-ray diffraction. Coke Chem. 2017;60:361–365. doi:10.3103/S1068364X17090058
- Batakliev T, Petrova-Doycheva I, Angelov V, et al. Effects of graphene nanoplatelets and multiwall carbon nanotubes on the structure and mechanical properties of poly(lactic acid) composites: a comparative study. Appl Sci. 2019;9(3):469. doi:10.3390/app9030469
- Amrutha BM, Manjunatha JG, Bhatt AS, et al. Sensitive and selective electrochemical detection of vanillin at graphene based poly (methyl orange) modified electrode. J Sci: Adv Mater Devices. 2021;6(3):415–424. doi:10.1016/j.jsamd.2021.05.002
- Qu W, Wu K, Hu S. Voltammetric determination of pyridoxine (vitamin B6) by use of a chemically-modified glassy carbon electrode. J Pharm Biomed Anal. 2004;36(3):631–635. doi:10.1016/j.jpba.2004.07.016
- Kuzmanović D, Khan M, Mehmeti E, et al. Determination of pyridoxine (vitamin B6) in pharmaceuticals and urine samples using unmodified boron-doped diamond electrode. Diam Relat Mater. 2016;64:184–189. doi:10.1016/j.diamond.2016.02.018
- Cottica SM, Nozaki J, Nakatani HS, et al. Voltammetric determination of pyridoxine (vitamin B6) in drugs using a glassy carbon electrode modified with chromium (III) hexacyanoferrate (II). J Braz Chem Soc. 2009;20(3):496–501. doi:10.1590/S0103-50532009000300014
- Teisxeira MFS, Glimaldo M, Dockal ER, et al. Voltammetric determination of pyridoxine (vitamin B6) at a carbon paste electrode modified with vanadyl (IV)–salen complex. Anal Chim Acta. 2004;508(1):79–85. doi:10.1016/j.aca.2003.11.046
- Teisxeira MFS, Segnini A, Moraes FC, et al. Determination of vitamin B6 (pyridoxine) in pharmaceutical preparations by cyclic voltammetry at a copper(II) hexacyanoferrate(III) modified carbon paste electrode. J Braz Chem Soc. 2003;14(2):316–321. doi:10.1590/s0103-50532003000200021
- Moustafa A, El-Kamel RS, Abdelgawad S, et al. Electrochemical determination of vitamin B6 (pyridoxine) by reformed carbon paste electrode with iron oxide nanoparticles. Ionics. 2022;28:4471–4484. doi:10.1007/s11581-022-04673-6
- David IG, Florea MA, Cracea OG, et al. Voltammetric determination of B1 and B6 vitamins using a pencil graphite electrode. Chem Pap. 2015;69(7):901–910. doi:10.1515/chempap-2015-0096
- Habibi B, Phezhhan H, Pournaghi Azar MH. Voltammetric determination of vitamin B6 (pyridoxine) using multi wall carbon nanotube modified carbon-ceramic electrode. J Iran Chem Soc. 2010;7:S103–S112. doi:10.1007/BF03246189
- Jahani PM, Jafari M, Ahmadi SA. Voltammetric determination of vitamin B6 in the presence of vitamin C based on zinc ferrite nano-particles modified screen-printed graphite electrode. ADMET DMPK. 2023;11(2):251–261. doi:10.5599/admet.1702
- Kassem MA, Hazazi OA, Ohsaka T, et al. Electroanalysis of pyridoxine at copper nanoparticles modified polycrystalline gold electrode. Electroanalysis. 2016;28(3):539–545. doi:10.1002/elan.201500209
- Zhang Y, Zhou Y, Chen S, et al. Analysis of the overlapped electrochemical signals of hydrochlorothiazide and pyridoxine on the ethylenediamine-modified glassy carbon electrode by use of chemometrics methods. Molecules. 2019;24(14):2536. doi:10.3390/molecules24142536
- Desai PB, Kotkar RM, Srivastava AK. Electrochemical behaviour of pyridoxine hydrochloride (vitamin B6) at carbon paste electrode modified with crown ethers. J Solid State Elctrochem. 2008;12:1067–1075. doi:10.1007/s10008-007-0435-9
- Mohammad MM, Beitollahi H, Tajik S, et al. Nanostructure electrochemical sensor for voltammetric determination of vitamin C in the presence of vitamin B6: application to real sample analysis. Int J Electrochem Sci. 2016;11(9):7849–7860. doi:10.20964/2016.09.60
- Zhang Y, Wang Y. Voltammetric determination of vitamin B6 at glassy carbon electrode modified with gold nanoparticles and multi-walled carbon nanotubes. Am J Anal Chem. 2011;2(2):194–199. doi:10.4236/ajac.2011.22022