
Abstract
The Beijing–Tianjin–Hebei urban agglomeration is currently facing severe complex air pollution. In this paper, simultaneous observations conducted in 2014 show that the annual mean concentration of fine particulate matter (PM2.5) was 84 ± 70, 86 ± 60, and 118 ± 95 μg m−3 in Beijing, Tianjin, and Shijiazhuang, respectively. The mean O3_8 h max in the summer was 171 ± 43, 147 ± 45, and 146 ± 44 μg m−3, respectively. This research indicates that PM2.5 and O3 are positively correlated when the temperature exceeds 20 °C, and the urban agglomeration shows characteristics of complex air pollution consisting of superimposed O3 and PM2.5. In summer, when the humidity was less than 55%, secondary particles and O3 also increased in a coordinated manner (y = 1.35x + 29.85; R2 = 0.61), which demonstrates severe complex pollution. However, the mean PM2.5 (y) and mean O3_8 h max (x) in summer showed a negative correlation (y = −1.3x + 245; R2 = 0.61) in the three regions, indicating high concentrations of PM2.5 pollution partially inhibit O3 generation.
摘要
目前京津冀地区夏季面临非常严重的大气复合污染。2014年北京、天津、石家庄观测资料分析表明,京津冀地区PM2.5年平均超过国家二级标准的2–3倍,夏季O3八小时滑动平均值超过标准1–2倍。当温度超过20 °C、湿度低于55%时,O3与PM2.5协同增长,大气复合污染显著。同时,对比三个地区同步观测发现,当高浓度PM2.5下降时,太阳辐射增强,臭氧浓度将进一步上升。这使得京津冀地区大气污染治理面临更大挑战,当治理首要颗粒物污染时,臭氧浓度将会快速上升,造成严重的光化学污染。
1. Introduction
The rapid development of cities generates economic development, but it is also accompanied by the aggravation of urban pollution. Complex air pollution has become increasingly severe since the twentieth century (Fang et al. Citation2016). Complex air pollution occurs when atmospheric pollutants couple under specific meteorological conditions, forming a complex air pollution system. The characteristics of the system include pollution from high concentrations of O3 and high concentrations of particulate matter, leading to substantial adverse impacts on the environment and human health (Li et al. Citation2005). Most parts of China are experiencing varying degrees of atmospheric pollution (Cheng et al. Citation2007; Chan and Yao Citation2008; Leng et al. Citation2015). The number of vehicles has been rising continuously in recent years in Beijing, Tianjin, and Hebei (Yang et al. Citation2012), and atmospheric oxidation is also increasing (Tang et al. Citation2009). High concentrations of particles and O3 combine and the consequential compound pollution over the entire area is becoming increasingly severe. Many researchers have conducted studies on this subject. For example, Xin et al. (Citation2010) monitored the air pollution characteristics of Beijing and its surrounding areas during the 2008 Olympic Games, and the data showed that the region experienced highly oxidizing regional contamination. Du et al. (Citation2010) observed pollutants in Shijiazhuang in summer and found the level of particulate matter was exceedingly high.
This paper uses observations of the characteristics of complex atmospheric pollutants in the Beijing–Tianjin–Hebei region to discuss the pollution levels of O3, fine particulate matter (PM2.5), and coarse particulate matter (PM10). In doing so, we analyze the effect of particulate pollution on the formation of O3 under different temperature conditions, and provide specific theoretical support for regional photochemical pollution prevention and control.
2. Methods and data
The pollution data in this paper are derived from the hourly observation data of the Ministry of Environmental Protection of the People’s Republic of China. The hourly data are the mean values of 13 state-controlled stations, 15 national control stations, and 8 national control stations in the localities of Beijing, Tianjin, and Shijiazhuang in clear days, respectively. The sites represent the typical air pollution of the selected regions. The meteorological data are the routine daily data for the corresponding site. The corresponding routine meteorological data are derived from the China Meteorological Data Network (http://data.cma.cn/). The observation instruments are automatic continuous observation instruments produced by the Thermo Electron Corporation of the United States, which are regularly calibrated to ensure data accuracy. The O3 observation instrument is the 9C, 49I Ultraviolet Photometric O3 analyzer, with a minimum detection limit of 1 ppb, zero drift of <1 ppb/24 h and 2 ppb/7 days, cross drift of <1%/month, and a response time of 20 s. Particle concentration is monitored by an RP1400 Environmental Particle Monitor with an accuracy of ±2.0 μg m−3 h−1 and ±1.0 μg m−3/24 h, and with a resolution of 0.1 μg m−3 h−1.
3. Analysis and discussion
Figure (a)–(d) show the daily mean of temperature and pollutant concentration during the observation time. According to the ‘Ambient Air Quality Standards (GB3095-2012)’ National Ambient Air Quality Standard II (NAAQS-II), O3_8 h max levels cannot exceed 160 μg m−3, and the annual mean concentrations of PM2.5 and PM10 cannot exceed 35 μg m−3 and 70 μg m−3, respectively. During all clear days in 2014, the annual mean temperature was 13 ± 10 °C in the Beijing area; the annual mean concentration of O3_8 h max was 98 ± 65 μg m−3, with a mean summer concentration of 173 ± 42 μg m−3; the PM2.5 annual mean concentration was 84 ± 70 μg m−3; and the annual mean PM10 concentration was 120 ± 77 μg m−3. In the Tianjin area, the annual mean temperature was 14 ± 10 °C; the annual mean O3_8 h max concentration was 80 ± 54 μg m−3, with a summer mean concentration of 146 ± 43 μg m−3; the annual mean PM2.5 concentration was 86 ± 60 μg m−3; and the annual mean PM10 concentration was 137 ± 74 μg m−3. The annual mean temperature for Shijiazhuang was 15 ± 10 °C; the annual mean O3 level was 79 ± 53 μg m−3, with a summer mean concentration of 150 ± 31 μg m−3; the annual mean PM2.5 concentration was 118 ± 95 μg m−3; and the annual mean PM10 concentration was 212 ± 136 μg m−3. The annual mean concentration of PM2.5 for Beijing, Tianjin, and Shijiazhuang was 2.4, 2.4, and 3.4 times that specified by NAAQS-II, respectively. The annual mean PM10 concentration was 1.70, 1.95, and 3.02 times that specified by NAAQS-II, respectively. The annual mean PM2.5 and PM10 concentrations reported for these three typical cities were substantially higher than the respective national secondary standards. The data indicate that particulate pollution is severe and that O3 pollution is mainly concentrated in summer.
Figure 1. Daily average concentrations of (a) PM2.5, (b) PM10, (c) O3, and (d) temperature, and monthly average concentrations of (e) PM2.5/PM10, (f) PM2.5, (g) PM10, and (h) O3, in Beijing, Tianjin, and Shijiazhuang during 2014.
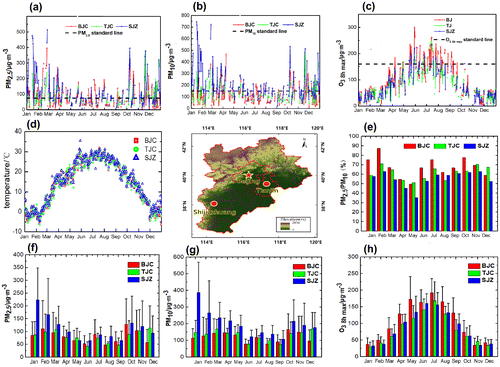
Figure (e)–(h) show the monthly mean of PM2.5, PM10, O3 and the ratio of PM2.5 and PM10 in Beijing, Tianjin, and Shijiazhuang in 2014. For the effective observation clear days during 2014, there were 68 days in which PM2.5 exceeded the NAAQS-II in the Beijing region at a standard rate of 30.6% and with a maximum daily concentration of 395 μg m−3, which is approximately 5.2 times that of NAAQS-II. There were 88 days in which PM2.5 exceeded NAAQS-II in Tianjin at a standard rate of 48.6% and with a maximum daily concentration of 379 μg m−3. There were 113 days in which PM2.5 exceeded NAAQS-II in Shijiazhuang at a standard rate of 60.1%. High PM2.5 continued to occur in Shijiazhuang during winter, with levels reaching 514 μg m−3 during one day. The observed PM2.5 pollution in Shijiazhuang in winter was much higher than in the other two cities; however, the pollution was substantially lower in November and December than in January and February because the government of Shijiazhuang issued emergency emission reduction measures during APEC in November, which effectively reduced the concentrations of PM2.5. The number of days in which PM10 concentrations exceeded NAAQS-II was 82 days, 63 days, and 116 days for the Beijing, Tianjin, and Shijiazhuang regions, at standard rates of 27.2%, 35%, and 61.3%, respectively. The PM2.5/PM10 levels for Beijing were higher than in the other two cities, indicating PM2.5 pollution in Beijing is more severe. For O3, there were 49 days in which the levels reported for Beijing exceeded NAAQS-II, at a standard rate of 20.7%. The level of O3 was exceeded on 27 days during summer (June, July, and August), with a maximum O3 level of 299 μg m−3. There were 23 days during the observation period in which the O3 levels reported for Tianjin exceeded NAAQS-II, at a standard rate of 10.3%. Twelve of the O3 exceedance days occurred during summer. The levels of O3 reported for Shijiazhuang exceeded NAAQS-II on 19 days during the observation period, including 11 exceedance days in summer.
Figure (a)–(d) show the daily variation of PM2.5 and diurnal change in PM2.5/PM10. The PM2.5 concentrations reported for the three stations were highest in winter and autumn, and there was a trend of low concentrations in spring and summer. The concentrations of particulate matter increased in winter due to large volumes of coal combustion associated with winter heating. The highest PM2.5 concentrations were observed at night and decreased during the day, reaching a minimum concentration between 1200 and 1400 (If there is no special explanation, the time zone of this paper is UTC+8), and then gradually increasing to high levels between 2200 and 2400. The high concentration observed at night was due to low temperatures, during which the existence of associated inversion layers caused the PM2.5 to accumulate continuously. The height of the mixed layer increased with the increasing temperature during the daytime. The rising mixed layer was conducive to the diffusion of pollutants, and the PM2.5 gradually decreased to its lowest level in the afternoon. In spring and summer, the PM2.5 reported by the three stations each indicated a single peak. They all reached a maximum value between 0800 and 1000, and then gradually reduced to a minimum value between 1600 and 1800. The PM2.5 concentrations then rose to higher levels at nighttime. The period between 0800 and 1000 corresponded to rush-hour traffic. The PM2.5 concentrations were highest during this period, indicating that increases in PM2.5 are closely related to human activities in the three regions, with the notable formation of secondary aerosol.
Figure 2. Diurnal variation of (a–d) PM2.5 and PM2.5/PM10, (e–h) PM10, and (i–l) O3 in the Beijing, Tianjin, and Shijiazhuang regions during four seasons in 2014: (a,e,i) spring, (b,f,j) summer, (c,g,k) autumn, and (d,h,l) winter.
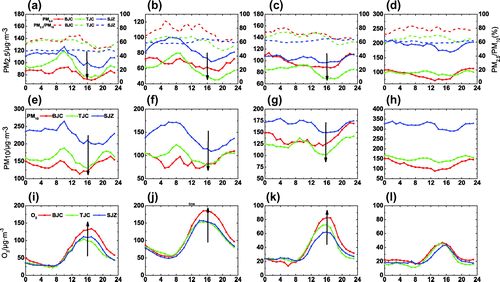
Figure (e)–(h) show the daily variation in PM10. The PM10 in the three regions reached maximum concentrations in winter, followed by spring, and lowest levels in autumn and summer. The PM10 data for the three cities exhibited double peaks for spring, summer and autumn. Pollutant levels were highest between 0800 and 1000, indicating that PM10 concentrations are closely related to human activities — similar to the observed PM2.5 concentrations. The average PM10 concentration in winter for Shijiazhuang was approximately 1.3 times higher than that for Beijing and Tianjin, while the contribution of fine particles was far greater than that of coarse particles. It showed that the contribution rates for biomass combustion, coal combustion, and industrial emissions were high, and that secondary aerosol pollution was severe. Dust control measures implemented in winter had minimal effects on the control of particulate pollution. PM2.5/PM10 represents the proportion of fine particles in PM10. The ratio of fine particles indicates the severity of fine particle pollution. WHO studies have shown that, in general, the PM2.5/PM10 ratio is approximately 50% in developing countries. However, the PM2.5/PM10 ratio exceeded 50% in all three regions of the study area — especially in Beijing, where the PM2.5/PM10 ratio reached 75.6% in winter. In contrast, the PM2.5/PM10 ratio was lower in spring because of dust and sand, which have increased proportions of large particles; therefore, the contribution of PM2.5 to particulate matter decreased. The PM2.5/PM10 ratios for the three regions were similar in spring and autumn, indicating they had similar meteorological conditions and sources of pollution in the same season.
Figure (i)–(l) show the diurnal variation of O3 in the three cities during the four seasons. The daily variation in O3 showed a similar single peak in the three stations. O3 reached its lowest level at approximately 0600 because there was no O3 generation at night. The remaining O3 continued to react with automobile exhaust and had been in a state of depletion. As the sun rose, photochemical reactions began to occur and the O3 increased continuously, reaching its highest value at approximately 1600.
Some scholars have shown that there is a clear linear relationship between PM2.5 and O3 in summer. Aerosol particles have an influence on O3 formation (Shao et al. Citation2017). Figure (a) is a scatter plot of PM2.5 and O3_8 h max at different temperatures in summer (June, July, August) in Beijing, Tianjin, and Shijiazhuang. When the temperature was greater than 20 °C, the O3_8 h max (y) and PM2.5 (x) dispersion lines in the three cities were y = 0.86x + 117.53 (R2 = 0.4) (line 1), y = 0.87x + 89.35 (R2 = 0.2) (line 2), and y = 0.14x + 132.11 (R2 = 0.01) (line 3), respectively. Under high temperature conditions (>20 °C), the O3_8 h max and PM2.5 showed a positive correlation, and atmospheric chemical processes were occurring in which high-concentration O3 and fine particles were combining. When PM2.5 elevated, O3 concentrations also elevated. High temperatures were conducive to the superposition of PM2.5 and O3_8 h max to form discernable compound pollution. Because of rainy days, Tianjin’s data were partly deleted, meaning there were fewer days to be analyzed compared to Beijing and Shijiazhuang. On the remaining sunny days, O3 and particulate matter concentrations were relatively low; however, in general, there was a trend that both PM2.5 and O3 increased in tandem. Figure (d) is a scatter plot of PM2.5/PM10 and O3_8 h max at different temperatures for the three stations in summer. When t > 20 °C, the O3_8 h max (y) and PM2.5/PM10 (x) dispersion lines in Beijing, Tianjin, and Shijiazhuang were y = 134.33x + 83 (R2 = 0.17) (line 1), y = 42.3x + 120 (R2 = 0.01) (line 2), and y = −27.93x + 163 (R2 = 0.004) (line 3), respectively. The O3 indicated an upward trend for Beijing and Tianjin, with an increase in the proportion of PM2.5/PM10. This suggests that an increase in the concentration of fine particles promotes O3 formation under high temperature conditions.
Figure 3. Scatter plot and fitting lines for PM2.5 (a), PM10 (b), coarse particles (c), PM2.5/PM10 (d) and O3_8 h max at different temperatures in Beijing, Tianjin, and Shijiazhuang.
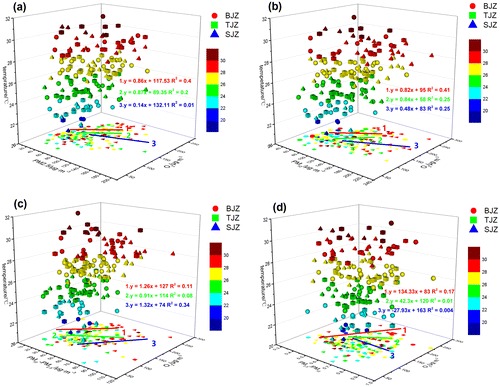
Figure (c) is a scatter plot of coarse particles (PM10 minus PM2.5) and O3_8 h max at different temperatures in summer. When the temperature was greater than 20 °C, the O3_8 h max (y) and coarse particle (x) dispersion lines were y = 1.26x + 127 (R2 = 0.11) (line 1) in Beijing, y = 0.91x + 114 (R2 = 0.08) (line 2) in Tianjin, and y = 1.32x + 74 (R2 = 0.34) (line 3) in Shijiazhuang. The levels of coarse particles and O3 increased synergistically at higher temperatures and the synergistic effect increased with increasing temperature. The PM2.5 and high-concentration O3 were superimposed to form severe compound pollution. The O3 and coarse particles in Shijiazhuang increased synergistically faster than in Beijing and Tianjin. This indicated that the synergistic effect of coarse particles on O3 was more obvious than that at the other two stations.
Figure (b) is a scatter plot of PM10 and O3_8 h max at different temperatures in summer. When the temperature was greater than 20 °C, the O3_8 h max (y) and PM10 (x) dispersion lines were y = 0.82x + 95 (R2 = 0.41) (line 1), y = 0.84x + 58 (R2 = 0.25) (line 2), and y = 0.48x + 83 (R2 = 0.25) (line 3) in Beijing, Tianjin, and Shijiazhuang, respectively. In these three stations, the O3_8 h max and PM10 data showed a positive correlation when temperatures were greater than 20 °C. The fine particles coexisted with O3, producing high-concentration O3 pollution accompanied by high concentrations of secondary particles.
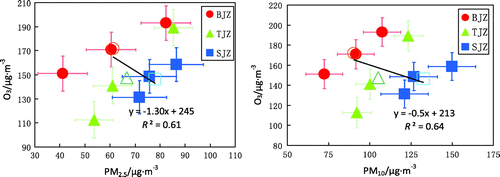
Figure is a seasonal (open circles) and monthly (solid circles) mean scatter plot of PM2.5, PM10, and O3 in summer (June, July, and August). The dispersion line of O3_8 h max (y) and PM2.5 (x) was y = −1.3x + 245 (R2 = 0.61). The dispersion line of O3_8 h max (y) and PM10 (x) was y = −0.5x + 213 (R2 = 0.64). When the photochemical activity was strongest in this year, i.e., when O3 production was most intense, the levels of O3 and particulate matter exhibited negative correlations in Beijing, Tianjin, and Shijiazhuang. The decrease in particle concentrations resulted in enhanced ultraviolet radiation, leading to an increase in O3. When the PM2.5 level decreased to 75 μg m−3, the O3 level increased to 147.5 μg m−3; and when the PM2.5 level decreased to 35 μg m−3, the O3 level increased to 199.5 μg m−3. This suggests substantial difficulty in comprehensively treating air pollution because particulate pollution will increase and photochemical pollution will intensify.
Figure 4. Scatter plot and fitting line for monthly mean PM2.5, PM10 and O3 in summer in Beijing, Tianjin, and Shijiazhuang.
Since the formation of secondary particles and photochemical reactions are closely related to atmospheric oxidation, O3 can be used to as a marker of photochemical activity (Rodriguez et al. Citation2002; Na et al. Citation2004). To study the effect of photochemical reactions on the formation of secondary aerosol particles, we introduce a formula for estimating primary particle and secondary particles (Chang and Lee Citation2007). CO can be used as a tracer of primary particles, and O3 represents the level of photochemical activity. When the level of photochemical activity is relatively low (O3_8 h max < 100 μg m−3), the value of PM2.5/CO represents the primary emission level for aerosol. When the level of photochemical activity is relatively high (O3_8 h max > 100 μg m−3), the primary aerosol concentration is estimated by PM2.5/CO multiplied by the CO concentration under the corresponding condition of O3. The secondary aerosol concentration is estimated by subtracting the estimated PM2.5 concentration from the observed PM2.5 concentration.
The estimating formulae for primary aerosol are:(1)
(2)
where the subscripts ‘p’ and ‘h’ represent primary aerosol and the time of day, respectively; ‘L’ represents O3_8 h max < 100 μg m−3; ‘M’ represents 100 μg m−3 ≤ O3_8 h max ≤ 160 μg m−3; and ‘LH’ represents O3_8 h max > 160 μg m−3.
The estimating formulae for secondary aerosol are:
(3)
(4)
where the subscript ‘sec’ represents secondary aerosol and ‘obs’ represents the observation value.
Figure shows the concentrations of primary aerosol and secondary aerosol under different chemical activity and the ratio of secondary aerosol to total aerosol emissions in summer during 2014. Under minor PM2.5 pollution conditions (100 μg m−3 ≤ O3_8 h max ≤ 160 μg m−3), the secondary aerosol accounted for 34.8%, 6.5%, and 15.3% of the total aerosol in Beijing, Tianjin, and Shijiazhuang, respectively. Under heavy PM2.5 pollution conditions (O3_8 h max > 160 μg m−3), the secondary aerosol accounted for 51.5%, 33.7%, 20.3% of the total aerosol, respectively. Secondary aerosol levels increased at different levels when atmospheric oxidation was enhanced. These results indicated that high oxidation in the three regions could promote production of secondary aerosol and that the increase in O3 levels can substantially promote secondary aerosol concentrations. Moreover, the Beijing region had the largest increase in secondary particles, which indicates Beijing pollution is more intensely controlled by secondary particles under high oxidation conditions.
Figure 5. Estimated concentrations of primary aerosol and secondary aerosol under different photochemical activity.
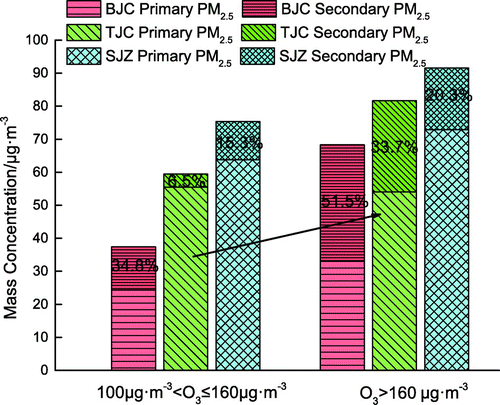
Figure 6. Scatter plot and fitting line for PM2.5 and O3 anomalies in summer in Beijing, Tianjin, and Shijiazhuang at different temperatures and humidity.
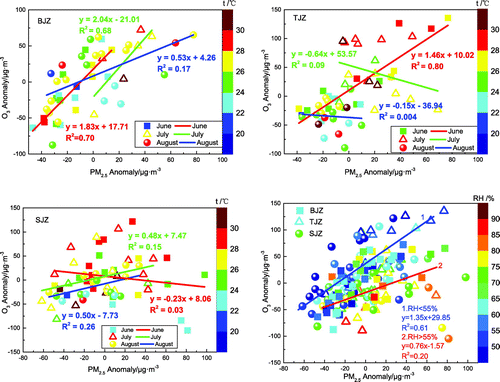
In order to further study the relationship between secondary particles and O3, we calculated the relationship between the PM2.5 anomaly (difference between the mean of summer and the daily mean) and the O3 anomaly at the three stations in summer (June, July, and August). After excluding cloudy and rainy days, the data were calculated. In Beijing, the O3_8 h max anomaly (y) and PM2.5 anomaly (x) dispersion lines in June, July, and August were y = 1.83x + 17.71 (R2 = 0.70), y = 2.04x − 21.01 (R2 = 0.68), and y = 0.53x + 4.26 (R2 = 0.17). In summer, secondary particles and O3 increased together, and the complex air pollution was the most obvious. In August, the humidity was the highest (~66%), and the complex air pollution was the weakest, relatively. In Tianjin, the O3_8 h max anomaly (y) and PM2.5 anomaly (x) dispersion lines in June, July and August were y = 1.46x + 10.02 (R2 = 0.80), y = −0.64x + 53.57 (R2 = 0.09), and y = −0.15x − 36.94 (R2 = 0.004), respectively. In June, secondary particles and O3 had a very good correlation: as particulate matter rose, O3 also rose significantly, both of which exhibited similar characteristics of complex air pollution to those in Beijing. However, in the months of high humidity, which are July (~68%) and August (~71%), O3 was affected by water vapor, and the formation was inhibited, so there was no obvious fitting relationship between PM2.5 and O3. This indicates that the relationship between particulate matter and O3 is not applicable under high humidity. In Shijiazhuang, the O3_8 h max anomaly (y) and PM2.5 anomaly (x) dispersion lines in June, July, and August were y = −0.23x + 8.06 (R2 = 0.03), y = 0.48x + 7.47 (R2 = 0.15), and y = 0.50x − 7.73 (R2 = 0.26), respectively. Besides the few number of days, the O3 concentrations in summer were all above 100 μg m−3 and, combined with Figure , we found that the emission of primary particulates in Shijiazhuang was higher, accounting for 79.3% of the total particulate matter, and the proportion of the secondary particles was relatively lower. Therefore, the correlation between secondary particles and O3 was less than that of Beijing, and the complex pollution was relatively low. In general, when the humidity was less than 55%, secondary particles had a good correlation with O3 in the three regions (y = 1.35x + 29.85; R2 = 0.61), and the complex pollution was obvious in summer.
4. Conclusion
The Beijing–Tianjin–Hebei urban agglomeration is currently experiencing moderately severe complex air pollution. The mean concentration of particulate matter was found to be two to three times that specified by NAAQS-II. The combination of O3 and particulate matter increased rapidly, especially when the temperature exceeded 20 °C, and the complex pollution was particularly significant. Based on simultaneous observations in three regions, the concentration of O3 increased when the particles were dissolving. When the concentration of particulate matter decreased to 75 μg m−3, O3 increased to 147.5 μg m−3. This will cause problems in curbing air pollution in Beijing, Tianjin, and Shijiazhuang. When primary particulate matter pollution was under control, O3 concentrations rose rapidly, causing serious photochemical pollution. Therefore, there will still be extreme challenges in the long-term governance of air pollution in this region.
Funding
This work was partially supported by the National Basic Research Program of China [grant numbers 2016YFC0202001; 973 Program 2014CB441200]; and National Earth System Science Data Sharing Infrastructure, National Science & Technology Infrastructure of China (http://www.geodata.cn).
Disclosure statement
No potential conflict of interest was reported by the authors.
References
- Chan, C. K., and X. Yao. 2008. “Air Pollution in Mega Cities in China.” Atmospheric Environment 42: 1–42.10.1016/j.atmosenv.2007.09.003
- Chang, S. C., and C. T. Lee. 2007. “Secondary Aerosol Formation through Photochemical Reactions Estimated by Using Air-quality Monitoring Data in Taipei City from 1994 to 2003.” Atmospheric Environment 41: 4002–4017.
- Cheng, S., D. Chen, J. Li, X. Guo, and H. Wang. 2007. “An ARPS-CMAQ Modeling Approach for Assessing the Atmospheric Assimilative Capacity of the Beijing Metropolitan Region.” Water, Air, and Soil Pollution 181: 211–224.10.1007/s11270-006-9294-8
- Du, W. P., Y. S. Wang, T. Song, J. Y. Xin, and Y. S. Cheng. 2010. “Characteristics of Atmospheric Pollutants During the Period of Summer and Autumn in Shijiazhuang.” Environmental Science 31 (7): 1409–1416.
- Fang, D., Q. Wang, H. Li, Y. Yu, Y. Lu, and X. Qian. 2016. “Mortality Effects Assessment of Ambient PM2.5 Pollution in the 74 Leading Cities of China.” Science of The Total Environment s569–s570: 1545–1552.10.1016/j.scitotenv.2016.06.248
- Leng, C. P., J. Y. Duan, C. Xu, H. F. Zhang, Y. F. Wang, Y. Y. Wang, X. Li, et al. 2015. “Insights into a Historic Severe Haze Weather in Shanghai: Synoptic Situation, Boundary Layer and Pollutants.” Atmospheric Chemistry and Physics 15: 32561–32605.
- Li, G., R. Zhang, J. Fan, X. Tie. 2005. “Impacts of Black Carbon Aerosol on Photolysis and Ozone.” Journal of Geophysical Research 110 (D23). doi:10.1029/2005JD005898.
- Na, K., A. Sawant, C. Song, and D. Cocker. 2004. “Primary and Secondary Carbonaceous Species in the Atmosphere of Western Riverside County, California.” Atmospheric Environment 38: 1345–1355.
- Rodriguez, S., X. Querol, A. Alastuey, and E. Mantilla. 2002. “Origin of High Summer PM10 and TSP Concentrations Atrural Sites in Eastern Spain.” Atmospheric Environment 36: 3101–3112.
- Shao, P., J. Xin, J. An, J. Wang, F. Wu, D. Ji, and Y. Wang. 2017. “An Analysis on the Relationship between Ground-level Ozone and Particulate Matter in an Industrial Area in the Yangtze River Delta during Summertime [J].” Chinese Journal of Atmospheric Sciences 41 (3): 618–628 (in Chinese). doi:10.3878/j.issn.1006-9895.1609.16173.
- Tang, G., X. Li, Y. Wang, J. Xin, and X. Ren. 2009. “Surface Ozone Trend Details and Interpretations in Beijing, 2001–2006.” Atmospheric Chemistry and Physics 9: 8813–8823.10.5194/acp-9-8813-2009
- Xin, J. Y., Y. S. Wang, G. Q. Tang, et al. 2010. “Variability and Reduction of Atmospheric Pollutants in Beijing and its Surrounding Area during the Beijing 2008 Olympic Games.” Chinese Science Bulletin 55: 25. doi: 10.1007/s11434-010-3216-2.
- Yang, J. Y., J. Y. Xin, D. S. Ji, and B. Zhu. 2012. “variation Analysis of Background Atmospheric Pollutants in North China during the Summer of 2008 to 2011.” Environmental Science 33 (11): 3693–3704.