
ABSTRACT
This study investigates the major patterns of large-scale tilted ridges (LSTRS) over the Eurasian continent and their connections with large-scale surface air temperature during boreal winter. A total number of 134 LSTR events with zonal extent exceeding 90° of longitude on the peak day are identified. Using self-organizing map (SOM), the LSTRs are classified into five clusters that are characterized by different spatial distributions and orientations. The leading two clusters are closely associated with extensive and persistent cold events over different places. Considering the first cluster, LSTRs extend from the Ural Mountains to Northeast Asia and are favorable for the amplification and southeastward extension of the Siberian high. Therefore, this cluster is closely associated with the occurrence of extensive and persistent cold events in china. In comparison with the first cluster, the LSTRs of second group are situated to the west, with starting points from the Kola Peninsula, and cause extensive and persistent cold events over Eastern Europe, central Asia, and central Siberia. The results suggest that the vertical coupling between LSTRs and the corresponding anomalous sea level pressure is crucial for the persistent cold temperature events associated with the leading two SOM clusters.
Graphical Abstract

摘要
本文研究了冬季欧亚大陆大型斜脊系统(LSTR)的类型及其对大范围持续性极端低温事件(EPECE) 的影响。结果表明,依据斜脊位置和空间形态,LSTR可分为五类,其中前两类与欧亚大陆EPECE密切相关。第一类LSTR起于乌拉尔山,有利于我国EPECE的发生;第二类LSTR起于科拉半岛,位置偏西,有利于中欧至中西伯利亚一带EPECE的发生。LSTR与西伯利亚高压之间的垂直耦合作用是EPECE发生的重要原因。这些结论对我国EPECE的中期—延伸期预报有一定的指导意义。
1. Introduction
Wintertime extensive and persistent extreme cold events (EPECEs) in China have become more recurrent in the early 21st century, during the so-called ‘global warming hiatus’ period (Chen and Zhang Citation2016). An unprecedented EPECE hit China with rainy, snowy, and icy weather in South China during January 2008, posing a substantial threat to human lives, traffic, societies, and economies (Tao and Wei Citation2008; Ji et al. Citation2008; Zhou et al. Citation2009). Given their importance, EPECEs have received increasing attention from the public and scientists alike (Ding et al. Citation2009; Wang, Yang, and Zhou Citation2017; Song and Wu Citation2017).
Unlike ordinary cold waves, EPECEs are characterized by broader areal coverage and longer duration of cold surface air temperature (SAT) (Peng and Bueh Citation2011, Citation2012; Xie and Bueh Citation2015; Song and Wu Citation2017; Bueh et al. Citation2018). In the troposphere, large-scale tilted ridges (LSTRs) over the mid- and high-latitude Eurasian continent are the key circulation system for EPECEs in China (Fu and Bueh Citation2013; Bueh, Fu, and Xie Citation2011; Bueh, Shi, and Xie Citation2011). Xie and Bueh (Citation2015) showed that an LSTR consists of an ordinary ridge, an isolated high and an anticyclonic wave breaking, and thus exhibits a planetary-scale feature. However, knowledge regarding LSTRs is still lacking.
LSTRs over the Eurasian continent exhibit a variety of types in terms of their location and wave-breaking feature, thus having different influences on weather (Bueh and Xie Citation2015). Although it has been recognized that the key circulation for EPECEs is the LSTR, not all LSTRs are conducive to the occurrence of large-extent cold-air activities in China. For example, even though an LSTR system maintained stably during 15–22 February 2016, the SAT was above normal in China. From the dynamic perspective, the impacts of different types of LSTRs on the surface Siberian high (SH) vary considerably (Bueh et al. Citation2018). Therefore, it is necessary to classify LSTRs over the Eurasian continent and clarify the association of large-extent cold air activities with different LSTR groups.
This paper seeks to answer the following two questions: (1) How many LSTR patterns are there over the Eurasian continent? (2) What is the relationship between the LSTR patterns and SAT over the Eurasian continent? The answers to these two questions could provide a basis for the medium- and extended-range forecasting of wintertime large-scale cold air activities (ordinary cold waves and EPECEs) in China.
2. Data and methods
The data used in this study are daily mean reanalys data from the National Centers for Environmental Prediction and National Center for Atmospheric Research (Kalnay et al. Citation1996) for the winters (1 November to 31 March) of 1948–2017. The meteorological fields include geopotential height, horizontal wind, sea level pressure (SLP), and 2-m air temperature. Here, we chose the 2-m air temperature to represent SAT.
We adopt the objective detection method of LSTRs developed by Bueh and Xie (Citation2015) to identify all wintertime LSTRs over the Eurasian continent (10°–80°N, 0°–180°E). This detection isolates each contour and identifies each ridge point of the contour. The ridge axes are identified by successively connecting the nearest ridge points of the neighboring contours under a minimum distance constraint. Therefore, each LSTR is represented by a set of grid points with longitudes and latitudes.
In the present study, an LSTR event is identified at 500 hPa if the following three criteria are satisfied simultaneously: (1) the ridge slope is positive (i.e., the ridge is tilted in a southwest–northeast orientation); (2) the zonal extent of the ridge is larger than 90° of longitude; (3) the ridge lasts for at least five consecutive days. A total number of 134 LSTR events are identified during the 69 winters. The average duration of an LSTR event is 9.8 days. For each LSTR event, we define the peak day as the day when the zonal extent is largest.
We use the self-organizing map (SOM) technique (Kohonen Citation1990, Citation1997) to categorize the LSTR events based on the ridge axes on their peak days. SOM is a neural network analysis tool characterized by an unsupervised training process with its networks learning to self-classify clusters from training data without external help. For more detailed descriptions, refer to Kohonen (Citation1990, Citation1997) and Liu, Weisberg, and Mooers (Citation2006). The SOM procedure in the present study is analogous to the one that Kim and Seo (Citation2016) designed for tropical cyclone tracks. In this clustering method, all input ridge axes are interpolated into those with the same number of segments. Here, we chose 30 equal segments for each LSTR. The input data for the SOM are vectors of longitudes and latitudes, which correspond to all LSTRs on the peak days. At the same time, we provide the number of nodes as an input parameter. For each LSTR, the best matching SOM pattern can be identified in terms of the smallest distance between itself and a specific SOM pattern (Lee et al. Citation2017). Obviously, the SOM patterns would capture the patterns of the LSTR cases more accurately with a higher number of SOM patterns. However, in practice the number of SOM patterns is expected to be sufficiently small. To determine the appropriate number of SOM patterns, we repeat the SOM procedure with the number of nodes ranging from 2 to 20, and calculate the average correlations between LSTRs and their best matching SOM pattern as well as the Ward’s distances between different SOM patterns, as in Lee et al. (Citation2017).
Composite analysis is applied to derive the SAT and circulation anomaly fields. An ‘anomaly’ is defined by removing its annual cycle (1948–2017). The Student’s t-test (Wilks Citation1995) is employed to assess the statistical significance of the results in the composite analysis.
3. Results
3.1. SOM patterns
displays the mean correlations between the LSTRs and their best matching SOM pattern and the Ward’s distances between SOM patterns as a function of the number (N) of SOM clusters. The correlation increases () and the Ward’s distance decreases () with the increase of N. Specifically, the average correlation increases markedly as N increases from three to five, and increases slightly after five. Simultaneously, the distance decreases notably as N increases from two to five, and thereafter decreases slightly. Thus, the appropriate number of SOM clusters would be five. With five clusters, SOM patterns are accurate enough to represent the LSTR patterns, and differences among SOM patterns are big enough to distinguish themselves from one another.
Figure 1. (a) Mean pattern correlations between the LSTRs and their corresponding SOM pattern. (b) Mean Ward’s distances between each SOM pattern with other SOM patterns as a function of the number of SOM clusters.
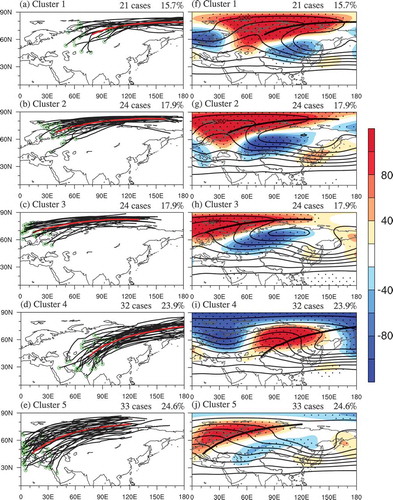
shows five SOM patterns of LSTRs and their corresponding 500-hPa geopotential height (Z500) fields. The leading three patterns have close numbers of LSTR cases (21, 24, and 24). Their LSTRs locate along the sub-Arctic coast (–), and they are less tilted than those of the fourth and fifth SOM patterns (,). It is shown that the average starting points of LSTRs in the leading three clusters are situated over the Ural Mountains, the Kola Peninsula, and the Norwegian coast, respectively, being arranged longitudinally from east to west. A significant negative Z500 anomaly band is seen to the southeastern side of the LSTRs for the leading three patterns (–h)), while such a negative anomaly band is absent for the fourth patterns and weak for the fifth patterns (,j)). On the one hand, the LSTR and trough pairing is conducive to a more meridional distribution for the leading three patterns. On the other hand, the LSTR and trough pairing favors more pronounced vertical coupling between the LSTR and the corresponding anomalous SLP, which is discussed below. The starting points of LSTRs in the fourth and fifth patterns distribute around Lake Balkhash and in southern Europe, respectively (,).
Figure 2. SOM clusters of LSTR events: (a–e) ridges on the peak day of LSTR events (black lines) and their average position (red line); (f–j) 500-hPa geopotential height (contours; drawn every 100 gpm) and its anomaly (color-shaded). The thick black line is the same as the red line in (a–e) ((a, f) Cluster 1; (b, g) cluster 2; (c, h) cluster 3; (d, i) cluster 4; (e, j) cluster 5).
The average onset day, ending day, and duration of LSTR events have been calculated for each SOM pattern. For brevity, day 0 denotes the peak day and day m (−m) refers to the day that is m days after (before) the peak day. The average onset days of the first and second clusters are day −4.2 and −2.7, respectively. On average, they persist for 9.2 days and 10.7 days, both showing a long-lived feature.
To identify the influence of LSTRs on SAT anomalies over China, we define LSTR indices based on the composite results and calculate their correlation with SAT anomalies over eastern China. First, an LSTR index is constructed by projecting each daily Z500 pattern (Z’) upon the composite Z500 anomaly of each SOM pattern (ZSOM) over the domain (10°–90°N, 0°–180°E) according to
Second, linear regression maps of Z500 anomaly patterns based upon the five daily LSTR indices (not shown) are consistent with the composite result shown in . Third, the correlation coefficients are calculated between the LSTR indices and the SAT anomaly averaged over days 0 to 4 and over eastern China (20°–50°N, 100°–130°E). The correlation coefficients for clusters 1–5 are −0.43, 0.31, 0.18, −0.29, and 0.14, respectively. Therefore, the leading two clusters are more closely associated with the SAT anomalies over China. Moreover, 42.9% of the first cluster is associated with EPECEs in China. Given the primary concern of the linkage between LSTR events and SAT in China, we focus on the leading two SOM patterns to analyze their individual impacts.
3.2. First SOM cluster
displays composite daily evolutions of Z500 (–e)), SAT (–j)), and SLP (–o)) fields for the first group of LSTR events. The composite analyses are performed according to the peak day (day 0) of each LSTR event. On day −4, a ridge locates over the Ural Mountains, with the corresponding amplitude of the Z500 anomaly center reaching 120 gpm ()). On day 0, the ridge becomes a southwest–northeast-oriented LSTR and extends from the Ural Mountains to the East Siberian Sea. To the south of the LSTR, there is a zonally elongated trough over Mongolia, which yields the meridional configuration ()). After the peak day, the ridge and trough move slowly southeastward and gradually weaken (–e)). After day 4, the zonal extent of the ridge decreases considerably, and thus the LSTR is replaced by an ordinary ridge ()).
Figure 3. Composite meteorological fields for the first SOM pattern: (a–e) 500-hPa geopotential height (contours; drawn every 100 gpm) and its anomaly (color-shaded; units: gpm); (f–j) 925-hPa horizontal wind anomaly (vectors; units: m s−1) and the 2-m temperature anomaly (color-shaded; units: °C); (k–o) SLP (contours; drawn every 5 hPa) and its anomaly (color-shaded; units: hPa). Areas above 90% confidence level are dotted; green lines in (k–o) represent 1025 hPa; (a, f, k) day −4; (b, g, l) day 0; (c, h, m) day 4; (d, i, n) day 8; (e, j, o) day 12.
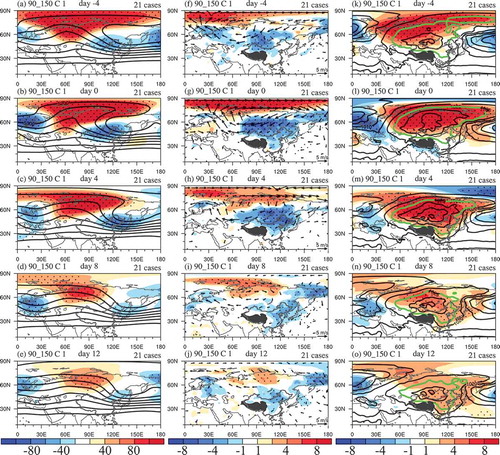
In line with the evolution of Z500, the SH also experiences a process of gradual amplification and decay (–o)). The SH amplifies remarkably from day −4 to 4, and then weakens and displaces southward afterwards. Consequently, the whole of China is dominated by positive SLP anomalies from day 4 to 12. As shown in ,, the cold air mass is accumulated and expanded around Lake Baikal from day −4 to 0. After becoming strong enough, the accumulated cold air spills out southwards and dominates China (–). With the control of the SH, China experiences a persistent cold SAT event from day 0 to 12 (–).
A natural question that immediately arises is how the LSTR is associated with the amplified SH and thus the persistent cold SAT over China. Takaya and Nakamura (Citation2005) investigated the amplification process of the SH using the potential vorticity (PV) inversion technique. They pointed out that an upper-tropospheric blocking ridge over western and central Siberia acts to reinforce the SH via the cold air advection by the upper-tropospheric blocking ridge. It suggests that the LSTR, an even larger-scale system of the upper troposphere, could possibly cause an extensive amplification of the SH. In fact, this hypothesis is further supported by observational evidence (Bueh and Xie Citation2015). On the other hand, Bueh et al. (Citation2018) verified that an amplified and expanded SH also maintains the LSTR, making it even more long-lived. Next, we look at how the SH anomaly in turn intensifies the LSTRs of the first SOM cluster from the PV perspective (Hoskins, Mcintyre, and Robertson Citation1985). As shown in ,h), with the amplification and expansion of the SH, the intensified anomalous southerly in the western portion of the SH at 925 hPa can extend upward to the upper troposphere, advecting a low PV from south to the LSTR at 500 hPa (Hoskins, Mcintyre, and Robertson Citation1985). As a result, the low PV advection serves to replenish the southwestern portion of the LSTRs and also keeps the anisotropic disturbance feature of the LSTR (Bueh et al. Citation2018). This dynamical process is crucial for the barotropic development of LSTRs, because once the disturbance becomes isotropic, the LSTR starts to decay (Black and Dole Citation2000; Bueh et al. Citation2018). Therefore, the amplified and westward-expanded SH is essential for a long-lived LSTR event. In short, LSTRs extending from the Ural Mountains provide a key mid-tropospheric circulation system for the development and southward invasion of the SH, facilitating the occurrence of persistent cold air activity in China. In turn, the amplified and westward-expanded SH helps to maintain the LSTRs. Such a vertical coupling process is closely associated with EPECEs in China.
3.3. Second SOM cluster
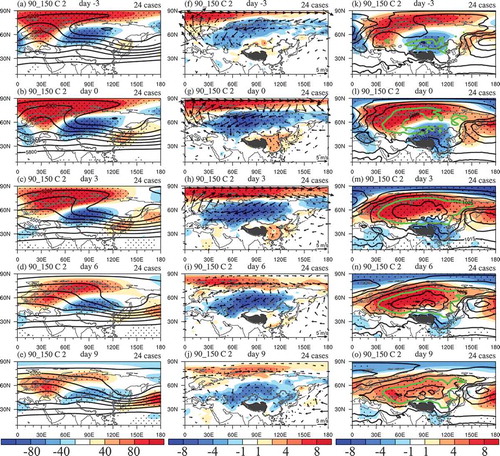
displays composite daily evolutions of Z500 (–), SAT (–) and SLP (–) fields for the second cluster of LSTR events. Since the average onset day in this cluster is day −2.7, the time interval in this figure is three days, instead of four days in . From day −3 to 6, a significant LSTR dominates over the northwestern Eurasia and sub-Arctic region (–). To the southeast of LSTRs, a pronounced negative Z500 anomaly band extends from the Caspian Sea to Northeast Asia (–). In response, negative SAT and northerly wind anomalies prevail over the northern Eurasian continent (–i)). The life cycle of LSTR events in the second SOM cluster is relatively similar to that of the first SOM cluster, except that the starting points of LSTRs are over the Kola Peninsula. In other words, the LSTRs are located too far west with respect to the LSTRs of the first SOM cluster. In contrast with the first SOM cluster (,c)), a moderate positive Z500 anomaly can be observed over the Sea of Japan (,c), bringing southerly wind anomalies to North China (,h)). In accordance with the westward distribution of LSTRs, the SH center and the corresponding positive SLP anomaly center exhibit westward positions, compared to those of the first SOM groups (–m)). The southeastward extension of the SH to China is substantially weak, and the SAT in China is abnormally warm, from day 0 to 3 (,h)). Instead, an extensive and persistent cold SAT anomaly can be found over a broad region extending from eastern Europe, via central Asia, to central Siberia (–i)). In this situation, the vertically coupled dynamical process between the LSTRs and the corresponding anomalous SLP, which has been presented in Section 3.2, is also true for the extensive cold SAT anomalies over eastern Europe–central Asia–central Siberia (–i)).
Figure 4. Composite meteorological fields for the second SOM pattern: (a–e) 500-hPa geopotential height (contours; drawn every 100 gpm) and its anomaly (color-shaded; units: gpm); (f–j) 925-hPa horizontal wind anomaly (vectors; units: m s−1) and the 2-m temperature anomaly (color-shaded; units: °C); (k–o) SLP (contours; drawn every 5 hPa) and its anomaly (color-shaded; units: hPa). Areas above 90% confidence level are dotted; green lines in (k–o) represent 1025 hPa; (a, f, k) day −3; (b, g, l) day 0; (c, h, m) day 3; (d, i, n) day 6; (e, j, o) day 9.
It is interesting to compare the first and second SOM clusters and their SAT influences. They share many common features, such as the LSTR pattern, related persistent SAT anomaly, and vertical coupling between the LSTRs and the anomalous SLP. In these two clusters, the mid-tropospheric circulation patterns, which primarily consist of the LSTRs and the accompanying large-scale tilted troughs, are phase shifted. Therefore, their influences on SAT differ in different regions. For example, the first cluster is associated with persistent cold SAT in China, whereas the second cluster with above-normal SAT in China.
4. Conclusions and discussion
This study systematically investigates the wintertime LSTR patterns over the Eurasian continent and their individual SAT influences over the period 1948–2017. We identify 134 LSTR events with the zonal extent exceeding than 90° of longitude. By applying the SOM method to the LSTRs on the peak day of each event, the LSTRs are categorized into five SOM clusters. The LSTRs of the leading three clusters exhibit a less tilted structure compared with the fourth and fifth groups. Moreover, an evident negative Z500 height anomaly band is seen in the leading three clusters, whereas the negative Z500 anomaly is absent in the fourth group and relatively weak in the fifth group. The configuration of the LSTR and trough on the one hand yields the circulation having a more meridional distribution; whilst on the other hand, such a configuration favors a more pronounced vertical coupling between LSTRs and the corresponding anomalous SLP. For the first cluster, the LSTRs extend from the Ural Mountains to Northeast Asia. During the amplification of these LSTRs, the cold SAT anomalies are accumulated over Siberia, which intensifies the SH. Afterwards, the SH extends southeastward to China with a cold SAT outbreak. As a result, this cluster is closely associated with the occurrence of EPECEs in China. Compared with the first cluster, the LSTRs of the second SOM cluster are displaced westward, with starting points from the Kola Peninsula, and are thus closely associated with persistent cold temperature events over eastern Europe, central Asia, and central Siberia. The LSTRs of this cluster are concurrent with an abnormally warm SAT condition in China. For both clusters, the vertical coupling between the LSTRs and the corresponding anomalous SLP is crucial.
Although the LSTR is considered to be the key circulation system for EPECEs in China (Bueh, Fu, and Xie Citation2011; Bueh et al. Citation2018), the results of this study suggest their occurrence does not always guarantee the appearance of an EPECE in China. We speculate that the close link between the wintertime mid-tropospheric LSTR system and EPECEs in China depends on at least two prerequisite conditions: (1) LSTRs must be positioned appropriately, being not too far west or too far north from mainland China; (2) the prior cold-air accumulation over the key region must be sufficiently strong and large enough in extent to cover central Asia and central Siberia. These two conditions are necessary for an effective vertical coupling between the LSTR and the corresponding anomalous SH. However, the detail of the corresponding physical mechanisms needs to be elucidated in future work.
This study has mainly focused on LSTR patterns and their SAT influence on the intraseasonal time scale. The related dynamics, including internal atmospheric processes and remote forcing, responsible for LSTRs, remain unexplored. Our follow-up research in the future will explore these aspects.
Disclosure statement
No potential conflict of interest was reported by the authors.
Additional information
Funding
References
- Black, R. X., and R. M. Dole. 2000. “Storm Tracks and Barotropic Deformation in Climate Models.” Journal of Climate 13: 2712–2728. doi:10.1175/1520-0442(2000)013<2712:STABDI>2.0.CO;2.
- Bueh, C., X. Y. Fu, and Z. W. Xie. 2011. “Large-Scale Circulation Features Typical of Wintertime Extensive and Persistent Low Temperature Events in China.” Atmospheric and Oceanic Science Letters 4: 235–241. doi:10.1080/16742834.2011.11446935.
- Bueh, C., J. B. Peng, Z. W. Xie, and L. R. Ji. 2018. “Recent Progresses on the Studies of the Wintertime Extensive and Persistent Extreme Cold Event in China and the Large-Scale Tilted Ridges and Troughs over the Eurasian Continent.” [In Chinese] Chinese Journal of Atmospheric Sciences 42: 656–676. doi:10.3878/j.issn.1006-9895.1712.17249.
- Bueh, C., N. Shi, and Z. W. Xie. 2011. “Large-Scale Circulation Anomalies Associated with Persistent Low Temperature over Southern China in January 2008.” Atmospheric Science Letters 12: 273–280. doi:10.1002/asl.333.
- Bueh, C., and Z. W. Xie. 2015. “An Objective Technique for Detecting Large-Scale Tilted Ridges and Troughs and Its Application to an East Asian Cold Event.” Monthly Weather Review 143: 4765–4783. doi:10.1175/MWR-D-14-00238.1.
- Chen, J., and Y. Zhang. 2016. “Regional Differences of Land Extreme Precipitation and Temperature Changes under Climate Change Condition.” [In Chinese] Plateau Meteorology 35: 955–968. doi:10.7522/j.issn.1000-0534.2015.00075.
- Ding, Y., X. Jia, Z. Wang, and L. Chen. 2009. “A Contrasting Study of Freezing Disasters in January 2008 and in Winter of 1954/1955 in China.” Frontiers of Earth Science in China 3: 129–145. doi:10.1007/sl1707-009-0028-2.
- Fu, X. Y., and C. Bueh. 2013. “Wintertime Extensive and Persistent Low-Temperature Events of China and Anomalous Precipitation over Southern China.” [In Chinese] Chinese Journal of Atmospheric Sciences 37: 1247–1260. doi:10.3878/j.issn.1006-9895.2012.12131.
- Hoskins, B. J., M. E. Mcintyre, and A. W. Robertson. 1985. “On the Use and Significance of Isentropic Potential Vorticity Maps.” Quarterly Journal of the Royal Meteorological Society 111: 877–946. doi:10.1256/smsqj.47001.
- Ji, L. R., C. Bueh, N. Shi, and Z. W. Xie. 2008. “On the Medium-Range Process of the Rainy, Snowy and Cold Weather of South China in Early 2008 Part III: Pressure Trough over the Tibetan Plateau/Bay of Bengal.” [In Chinese] Climatic and Environmental Research 13: 446–458. doi:10.3878/j.issn.1006-9585.2008.04.09.
- Kalnay, E., M. Kanamitsu, R. Kistle, W. Collins, D. Deaven, L. Gandin, M. Iredell, et al. 1996. “The NCEP/NCAR 40-Year Reanalysis Project.” Bulletin of the American Meteorological Society 77: 437–471. doi:10.1175/1520-0477(1996)077<0437:TNYRP>2.0.CO;2.
- Kim, H. K., and K. H. Seo. 2016. “Cluster Analysis of Tropical Cyclone Tracks over the Western North Pacific Using a Self-Organizing Map.” Journal of Climate 29: 3731–3751. doi:10.1175/JCLI-D-15-0380.1.
- Kohonen, T. 1990. “The Self-Organizing Map.” Proceedings of the IEEE 78: 1464–1480. doi:10.1109/5.58325.
- Kohonen, T. 1997. Self-Organizing Maps. 2nd Ed. Springer Series in Information Sciences. Vol. 30. New York, NY: Springer-Verlag.
- Lee, M. H., S. Lee, H. J. Song, and H. H. Chang. 2017. “The Recent Increase in the Occurrence of a Boreal Summer Teleconnection and Its Relationship with Temperature Extremes.” Journal of Climate 30: 7493–7504. doi:10.1175/JCLI-D-16-0094.1.
- Liu, Y., R. H. Weisberg, and C. N. K. Mooers. 2006. “Performance Evaluation of the Self-Organizing Map for Feature Extraction.” Journal of Geophysical Research 111: C05018. doi:10.1029/2005JC003117.
- Peng, J. B., and C. Bueh. 2011. “The Definition and Classification of Extensive and Persistent Extreme Cold Events in China.” Atmospheric and Oceanic Science Lettets 4: 281–286. doi:10.1080/16742834.2011.11446943.
- Peng, J. B., and C. Bueh. 2012. “Precursory Signals of the Extensive and Persistent Extreme Cold Events in China.” Atmostpheric and Oceanic Science Letters 5: 252–257. doi:10.1080/16742834.2012.11446999.
- Song, L., and R. G. Wu. 2017. “Processes for Occurrence of Strong Cold Events over Eastern China.” Journal of Climate 30: 9247–9266. doi:10.1175/JCLI-D-16-0857.1.
- Takaya, K., and H. Nakamura. 2005. “Mechanisms of Intraseasonal Amplification of the Cold Siberian High.” Journal of the Atmosphere Sciences 62: 4423–4440. doi:10.1175/JAS3629.1.
- Tao, S. Y., and J. Wei. 2008. “Severe Snow and Freezing-Rain in January 2008 in the Southern China.” [In Chinese] Climatic and Environmental Research 13: 337–350. doi:10.3878/j.issn.1006-9585.2008.04.01.
- Wang, Z. Y., S. Yang, and B. T. Zhou. 2017. “Preceding Features and Relationship with Possible Affecting Factors of Persistent and Extensive Icing Events in China.” International Journal of Climatology 37: 4105–4118. doi:10.1002/joc.5026.
- Wilks, D. S. 1995. Statistical Methods in the Atmospheric Sciences. San Diego, CA: Academic Press.
- Xie, Z. W., and C. Bueh. 2015. “Blocking Features for Two Types of Cold Events in East Asia.” Journal of Meteorological Research 31: 309–320. doi:10.1007/s13351-017-6076-8.
- Zhou, W., J. C. L. Chan, W. Chen, J. Ling, J. G. Pinto, and Y. Shao. 2009. “Synoptic-Scale Controls of Persistent Low Temperature and Icy Weather over South China in January 2008.” Monthly Weather Review 137: 3978–3991. doi:10.1175/2009MWR2952.1.