
ABSTRACT
Previous studies suggest a robust intensification of the zonally averaged hadley circulation (HC) during boreal winter in recent decades, but little is known regarding the regional HC. This study investigates long-term trends of the winter regional HC over the western pacific (WPHC) since 1979 using six reanalysis datasets. It is found that there are large discrepancies in the long-term trends of WPHC intensity among the six datasets. Specifically, three of the six reanalyses (era-interim, 20CR and CFSR) show no discernible long-term trends, whereas NCEP-1, NCEP-2 and JRA-55 display pronounced intensification tendencies. Results in this study suggest that, although the warming trend of SST in the western tropical pacific identified in previous studies is robust, uncertainty remains regarding the long-term trends in the WPHC intensity. This raises a question about the factors involved in changes of the WPHC intensity.
Graphical Abstract
摘要
北半球冬季西太平洋哈德莱环流是否在增强?先前的研究表明冬季全球纬向平均的哈德莱环流存在显著增强的趋势,但是局地哈德莱环流强度的长期趋势还不清楚。本文使用六套再分析数据探讨了冬季西太平洋哈德莱环流强度的长期趋势。结果表明冬季西太平洋哈德莱环流强度的长期趋势在六套不同的再分析资料中存在很大的差异。其中有三套资料(ERA-Interim、20CR和CFSR)表明其没有增强的趋势,而另三套资料(NCEP-1、 NCEP-2 和 JRA-55)却表明其具有显著的增强趋势。前人的研究已经表明热带西太平洋海温增暖显著,但是本文的研究结果表明西太平洋哈德莱环流强度的趋势还存在不确定性。因此,本文的研究促使我们进一步思考影响西太平洋哈德莱环流强度变化的真正因子。
关键词:
1. Introduction
The Hadley circulation (HC) is a large-scale thermally driven meridional circulation, with a rising branch in the tropics, flowing poleward aloft, a sinking branch in the subtropics, and flowing equatorward at the surface, generating an enclosed circulation in each hemisphere (e.g. Hadley Citation1735; Held and Hou Citation1980). It is generally known that change in the HC has great impacts on global weather and climate systems through transferring energy and momentum from the tropics to the extratropics (Hadley Citation1735; Quan, Diaz, and Hoerling Citation2004). In particular, studies have found that the descending branch of the HC is associated with the locations of the subtropical dry zones, which could affect global precipitation distributions and further exert a profound influence on the whole natural ecosystem, agriculture, water resources, as well as socioeconomic development (Lu, Vecchi, and Reichler Citation2007; Seidel et al. Citation2008).
In recent years, there has been growing interest in the long-term trend of the zonally averaged HC (ZAHC) with respect to its intensity and width. As to the width of the ZAHC, previous studies commonly reported that the ZAHC width has expanded during recent decades (e.g. Fu et al. Citation2006; Hu and Fu Citation2007; Davis and Rosenlof Citation2012; Lucas, Timbal, and Nguyen Citation2014). As to the strength of the ZAHC, previous studies have indicated that there are great discrepancies in the long-term trend of the annual mean ZAHC intensity during recent decades among different reanalyses datasets (e.g. Stachnik and Schumacher Citation2011; Nguyen et al. Citation2013; Chen et al. Citation2014). However, it was found that long-term change of the ZAHC in boreal winter shows a robust strengthening trend during recent decades. For example, Quan, Diaz, and Hoerling (Citation2004) inferred that the HC has strengthened since the 1950s, based on NCEP–NCAR reanalysis data. Mitas and Clement (Citation2005) showed that the boreal winter Hadley cell has increased in the NCEP–NCAR and ERA-40 reanalyses. Several other researchers (e.g. Ma and Li Citation2008) have obtained the similar conclusions. Nguyen et al. (Citation2013) used eight reanalysis datasets to show that there is greater consistency and more evident intensification of the HC intensity in winter compared with other seasons. The increasing trend of the winter ZAHC intensity during recent decades may be partly related to the warming of the SST over the tropics (Quan, Diaz, and Hoerling Citation2004).
Given that the land, sea, and topography are not evenly distributed, the ZAHC could mask the huge spatial variability at the regional scale and changes in the HC may be different in different regions (e.g. Chen et al. Citation2014; Schwendike et al. Citation2014; Nguyen et al. Citation2017). For example, although Oort and Yienger (Citation1996) suggested that the intensity of the ZAHC is stronger during the positive phase of ENSO, studies have found that connections of ENSO with HC are different over various regions (Zeng et al. Citation2011; Freitas and Ambrizzi Citation2015; Freitas et al. Citation2017). For instance, intensities of the regional HC over the Indian Ocean and South America are weaker during El Niño (Freitas and Ambrizzi Citation2015; Freitas et al. Citation2017). By contrast, the regional HC in the eastern Pacific tends to be stronger related to an El Niño event (Wang Citation2002; Zeng et al. Citation2011). In addition, several studies have reported that changes in the regional HC have great influences on regional climate variability (e.g. Wang Citation2002; Zhang and Wang Citation2013; Chen et al. Citation2014). For example, Chen et al. (Citation2014) found that changes in the regional HC have a profound impact on local precipitation. Zhang and Wang (Citation2013) showed that the interannual variability of the regional HC over the Atlantic strongly modulates the activity of Atlantic tropical cyclones. Some studies have suggested that there is a robust regional HC in the western Pacific (WPHC) during boreal winter (e.g. Wang Citation2002; Zeng et al. Citation2011; Huang et al. Citation2018), which could exert significant influences on climate anomalies over East Asia. For instance, Zeng et al. (Citation2011) indicated that the anomalously warm SST in the central-eastern tropical Pacific is accompanied by a weakened WPHC, related to a weaker East Asian winter monsoon event.
Above all, on the one hand, the DJF ZAHC intensity has experienced a marked strengthening trend during recent decades, which may be partly related to the SST warming over the tropics (Quan, Diaz, and Hoerling Citation2004; Ma and Li Citation2008). On the other hand, the tropical SST warming trend is most pronounced over the tropical Indian ocean–western Pacific region (Deser, Phillips, and Alexander Citation2010; Sun et al. Citation2017). Hence, a natural question is: has the WPHC intensity also been strengthening in recent decades during boreal winter? Answering this question is the main aim of the present paper. Furthermore, investigating the long-term trend of the WPHC intensity is crucial for understanding the trend of the weather and climate over the Asia–Australia region (e.g. Huang et al. Citation2018). The structure of this paper is arranged as follows: The data and methods used are briefly described in section 2. In section 3, we focus on investigating the long-term trends of the WPHC intensity during recent decades based on six reanalyses. Section 4 provides conclusions and discussion.
2. Data and methods
The data used in this study are derived from six reanalysis datasets: NCEP-1, NCEP-2, ERA-Interim, JRA-55, 20CR, and CFSR. Detailed descriptions of these six reanalyses are provided in .
Table 1. Reanalysis datasets used in this study and their detailed information.
The period analyzed in this study is 1979–2016, except for 20CR spanning 1979–2014 and CFSR spanning 1979–2012. We focus on the boreal winter (December–February (DJF)) seasonal mean, with winter referring to the three months from the December of the reference year to the February of the following year — for example, December 1979 and January–February 1980. This results in 35 winters (1979/80–2013/14) in the 20CR data, 33 winters (1979/80–2011/12) in CFSR data, and 37 winters (1979/80–2015/16) in the other datasets.
3. Results
In this section, we first describe the climatological features of the WPHC, and then define an index to analyze the long-term trends of the WPHC intensity (WPHCI). According to Krishnamurti (Citation1971), horizontal winds can be decomposed into rotational and divergent components. As only the divergent part of the wind contributes to the atmospheric divergence–convergence that drives the vertical motion and circulation in the tropics (Hastenrath Citation2001), we thus focus on the vertical velocity and divergent component of the meridional wind when describing vertical circulation. shows the climatology of the vertical circulation related to the WPHC from the six reanalyses, described by the divergent meridional wind and vertical velocity averaged between 110°E and 160°E. Note that the longitudinal bands selected for the WPHC are according to previous studies (e.g. Zeng et al. Citation2011; Chen et al. Citation2014; Schwendike et al. Citation2014), which indicate that the regional HC in these locations has an important influence on the East Asian climate. In addition, we have conducted a series of tests and found that the results obtained in this study are not sensitive to a reasonable change in the longitudinal bands (e.g. 110°–165°E, 105°–165ºE, 120°–165°E, and 120°–160°E), in good agreement with the conclusion in Chen et al. (Citation2014). From we can see that the climatological spatial patterns of the WPHC captured by the six reanalyses are highly consistent with each other. Air parcels ascend in the tropical region, flow poleward in the upper troposphere, descend in the subtropics and midlatitudes, and return to the tropics (). In particular, the WPHC during boreal winter is much stronger over the Northern Hemisphere (NH) than that over the Southern Hemisphere (SH), generally consistent with previous studies (e.g. Wang Citation2002; Zeng et al. Citation2011; Huang et al. Citation2018).
Figure 1. Climatology of the boreal winter WPHC by averaging the divergent meridional wind (units: m s−1) and vertical velocity (units: 10−2 Pa s−1) between 110°E and 160°E in (a) NCEP-1, (b) NCEP-2, (c) ERA-Interim, (d) JRA-55, (e) 20CR, and (f) CFSR. Vertical velocity has been multiplied by −100.
We also employ the meridional mass streamfunction to describe the WPHC. Following the approach of Schwendike et al. (Citation2014), which allows for defining the regionally averaged HC using the mass streamfunction, we derive a regional meridional mass streamfunction to depict the regional HC:
where denote the meridional mass streamfunction, Earth’s radius, latitude, gravitational acceleration, pressure, and divergent meridional wind, respectively. The square brackets represent the zonal average over a specified limited domain. Downward integration is applied to calculate the
field by assuming
at the top of the atmosphere. The positive (negative)
represents a clockwise (counterclockwise) meridional circulation. To ensure vertical-mean mass balance, the divergent meridional wind fields are corrected by removing their mass-weighted vertical mean value (Oort and Yienger Citation1996). displays the boreal winter climatological meridional mass streamfunction over the western Pacific (110°–160°E) derived from the six reanalysis datasets. In all reanalyses,
shows a quite similar spatial pattern, with positive (negative) values indicative of clockwise (anticlockwise) rotation. The WPHC has two cells with nonequivalent amplitude. The most prominent cell is the northern HC, with the upward motion around 5°S and the downward motion around 35°N, similar to the climatological vertical circulation in . The asymmetry of the WPHC between the winter and summer hemispheres corresponds to the findings of previous studies (e.g. Wang Citation2002; Zeng et al. Citation2011; Huang et al. Citation2018). The similar results obtained from and reveal that the approach of the meridional mass streamfunction, proposed by several researchers (e.g. Zhang and Wang Citation2013; Schwendike et al. Citation2014), is useful for defining and assessing the variations of the regionally averaged circulation. In addition, the regional meridional mass streamfunction has been used widely in previous studies (e.g. Zhang and Wang Citation2013; Schwendike et al. Citation2014; Nguyen et al. Citation2017). Thus, the definition of the WPHCI used in the present paper is based on the mass streamfunction. Besides, as the strength of the WPHC over the SH is much weaker, this study mainly focuses on the WPHC over the NH. Note that the flow in the SH may still have strong variability (Nguyen et al. Citation2017), even if the climatological mean WPHC is relatively weak there, which will be investigated in the future.
Figure 2. Climatology of the boreal winter regional meridional mass streamfunction (; units: 1010 kg s−1) over the western Pacific (110°–160°E) in (a) NCEP-1, (b) NCEP-2, (c) ERA-Interim, (d) JRA-55, (e) 20CR, and (f) CFSR. Positive (negative) values are indicated with solid (dashed) contours representing clockwise (counterclockwise) circulations. The thick solid contours correspond to values where
= 0. Contour interval for
: 3.5 × 10¹⁰ kg s−1.
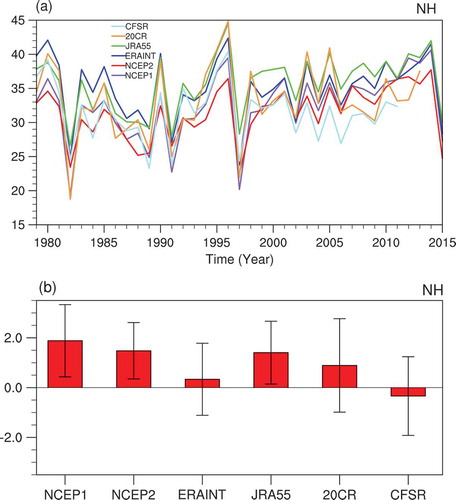
shows time series of the WPHCI in the NH derived from the six reanalysis datasets over their respective time periods. Note that, following previous studies (Oort and Yienger Citation1996; Mitas and Clement Citation2005), the WPHCI over the NH is defined as the maximum value of the meridional mass streamfunction of the WPHC between 0° and 30°N. The WPHCI exhibits a similar interannual variability among the six reanalysis datasets. For example, the extremely positive (negative) values of the WPHCI in 1990 and 1996 (1982 and 1997) can be captured by all six reanalyses (), which may be related to the ENSO events, consistent with previous studies (e.g. Wang Citation2002; Zeng et al. Citation2011). Moreover, we calculate the correlation correlations of different pairs of the WPHCIs. Results show that the WPHCIs from the six reanalysis datasets are highly correlated with each other, with the correlation coefficients all larger than 0.8. This indicates that there is high consistency among the six reanalysis datasets on the interannual timescale. displays the long-term trends of the WPHCI derived from the six reanalysis datasets. From , we can see that discrepancies remain concerning the long-term trends in the DJF WPHC intensity between the six reanalysis products. Three of the six reanalysis datasets (NCEP-1, NCEP-2, and JRA-55) show a significant upward tendency of the DJF WPHC strength over the past several decades (). However, ERA-Interim, 20CR and CFSR do not show any significant discernible trend over their respective periods in the NH (). In addition, CFSR has a slight insignificant decreasing trend, different from the other datasets (). Note that, although the different reanalyses have different temporal coverage, the results do not change when the trends in all datasets are computed over the same interval (1979–2011) (not shown).
Figure 3. (a) Time series of the boreal winter WPHC intensity indices over the NH obtained from six reanalyses. (b) As (a) but for the linear trends of the WPHC intensity indices for six reanalysis datasets over their respective time periods. The error bars of the 95% confidence intervals according to a two-tailed Student’s t-test are also shown in (b). Units for (a, b): 1010 kg s−1 and 1010 kg s−1/decade, respectively. Positive (negative) trend values indicate strengthening (weakening) of the NH WPHC.

To further confirm the reliability of the results obtained from (using the meridional mass streamfunction to define the WPHCI), shows the linear trends of the boreal winter WPHC derived from the six reanalysis datasets over their respective time periods. For all reanalyses, there are pronounced intensifying trends in the ascending motion over the tropics (), consistent with the significant SST warming trend in the tropical western Pacific identified in previous studies (e.g. Deser, Phillips, and Alexander Citation2010; Sun et al. Citation2017). However, from we can see that there are significant upward trends over the subtropics (around 30°N) in all datasets, weakening the climatological descending motion there (). Note that previous studies have suggested that the poleward edges of the HC tend to shift equatorward when the intensity of the HC is stronger (Lu, Vecchi, and Reichler Citation2007). Significant intensified descent appears within 10°–20°N in NCEP-1, NCEP-2 and JRA-55 (, and ). This indicates that these three reanalyses produce a significant increasing trend of the WPHCI, consistent with the results shown in . In comparison, the descent trends around 20°N in ERA-Interim and 20CR are not clear ( and ). In particular, notable upward motion anomalies can be observed around 10°–20°N in CFSR (), which result in a weakening trend of the WPHCI. Overall, the results obtained from and are in agreement with each other, indicating that the long-term trend of the WPHC intensity shows large discrepancies among different reanalysis datasets.
Figure 4. Linear trends of the boreal winter WPHC from 1979 to 2015 in (a) NCEP-1, (b) NCEP-2, (c) ERA-Interim and (d) JRA-55; from 1979 to 2013 in (e) 20CR; and from 1979 to 2011 in (f) CFSR. Vertical velocity has been multiplied by −100, with positive (negative) values indicating ascending (descending) motion. Units for the trends of the divergent meridional wind are m s−1/decade; for vertical velocity they are 10−2 Pa s−1/decade. Shading indicates trends that are significantly different from zero at the 95% confidence level.
4. Conclusions and discussion
Based on six reanalyses (NCEP-1, NCEP-2, ERA-Interim, JRA-55, 20CR and CFSR), the present study investigates the long-term trends of the WPHC intensity during boreal winter.
Results show that there is good agreement among the six reanalysis datasets in capturing the climatology and interannual variations of the WPHC. The DJF WPHC over the NH is located within 10°S–40°N, with ascent around the tropics and subsidence around the subtropics. Its main ascending center is at about 5°S, while its descending center is at about 35°N. Nevertheless, the intensity trends are inconsistent among the datasets. Three of the six reanalyses (ERA-Interim, 20CR and CFSR) show no discernible long-term trend in the DJF WPHC; whereas, NCEP-1, NCEP-2, and JRA-55 show pronounced upward tendencies.
In conclusion, uncertainty remains regarding the long-term trends of the WPHC intensity. An important question that needs further investigation is why the long-term trend in the WPHC intensity varies among different reanalysis datasets. One potential source of the disagreements may be attributable to the fact that the divergent wind fields used to describe the WPHC and calculate the mass streamfunction are not directly observed and may strongly depend on the assimilation technique (Andersson et al. Citation2005; Chen et al. Citation2014). Besides, previous studies have shown that the intensification of the ZAHC could be due to artificial errors (e.g. Mitas and Clement Citation2006; Hu, Zhou, and Liu Citation2011). For example, Mitas and Clement (Citation2006) argued that the positive trends of the ZAHC in the reanalyses may be due to the weak cooling trend in the tropical mid-troposphere. However, since there are errors and biases in radiosonde and satellite datasets, the observational temperature trends are far from certain, and thus the strengthening of the HC could be artificial (Mitas and Clement Citation2006). Therefore, it is reasonable to speculate that the inconsistent trends of the DJF WPHC intensity among different reanalysis datasets may also be associated with the thermodynamic structure of the tropical atmosphere in each dataset. displays the linear trends of the boreal winter regionally averaged potential temperature over the western Pacific region (110°–160°E) derived from the six reanalysis datasets. From we can see that discrepancies remain concerning the DJF regional-mean temperature trends over the western Pacific between the six reanalysis products. NCEP-1 and NCEP-2 show a significant cooling trend in the upper-tropospheric tropical region ( and ), corresponding to the strengthening of the DJF WPHC intensity captured by these two reanalyses (, and ). JRA-55 also captures a cooling trend in the tropical upper-troposphere, but this cooling trend is much weaker and less significant compared to those in NCEP-1 and NCEP-2 (, , and ). By contrast, ERA-Interim, 20CR and CFSR show distinct warming trends throughout the tropical free troposphere without any significant discernible cooling trend in the upper tropical troposphere (, and ). From the above, it is indicated that the inconsistent DJF WPHC intensity trends among the six different reanalysis datasets may be partly associated with the trends in their respective thermodynamic structures of the tropical troposphere, which is generally consistent with the findings of previous studies regarding the ZAHC (Mitas and Clement Citation2006). Nevertheless, because of uncertainties in the actual observations of tropospheric temperature, the results in the strengthening trends of the DJF WPHC intensity from the reanalyses could be artificial (Mitas and Clement Citation2006). Therefore, the linear trend of the DJF WPHC intensity is still a controversial issue, and remains to be explored.
Figure 5. Linear trends of the boreal winter regionally averaged potential temperature over the western Pacific region (110°–160°E) during 1979–2015 in (a) NCEP-1, (b) NCEP-2, (c) ERA-Interim and (d) JRA-55; during 1979–2013 in (e) 20CR; and during 1979–2009 in (f) CFSR. Units for the trends of potential temperature are K/decade in (a–f). Shading indicates trends that are significantly different from zero at the 95% confidence level.
In addition, although the warming trend in the western tropical Pacific is robust (e.g. Deser, Phillips, and Alexander Citation2010; Sun et al. Citation2017), there is no consensus as to the trend in WPHC intensity, with no significant tendencies in ERA-Interim, 20CR and CFSR; particularly, the multi-reanalysis ensemble average also shows no significant increasing trend (not shown). This raises questions about the true sources for changes in the WPHC. These will be investigated in a further study. Aside from the WPHC intensity, the long-term trend of the width of the WPHC remains unclear. Although previous studies have commonly reported that the ZAHC width has expanded during recent decades (e.g. Fu et al. Citation2006; Hu and Fu Citation2007; Davis and Rosenlof Citation2012; Lucas, Timbal, and Nguyen Citation2014), there are some potential difficulties in defining the poleward edges of the regional HC (Nguyen et al. Citation2017). Therefore, whether the WPHC has been widening in recent decades deserves further investigation in the future.
Acknowledgments
The NCEP-1, NCEP-2, and 20CR data were downloaded from ftp://ftp.cdc.noaa.gov/. The ERA-Interim data were downloaded from http://apps.ecmwf.int/. The JRA-55 data were downloaded from http://jra.kishou.go.jp/JRA-55/index_en.html. The CFSR data were downloaded from https://rda.ucar.edu/pub/cfsr.html.
Disclosure statement
No potential conflict of interest was reported by the authors.
Additional information
Funding
Notes on contributors
Ru-Ping HUANG
Ru-Ping HUANG is a PhD student interested in the Hadley circulation. She has published several papers focus on the regional Hadley circulation. Recently, she is studying the regional Hadley circulation over the western Pacific.
Shang-Feng CHEN
Shang-Feng CHEN is interested in the Climate Dynamics and Air-sea Interaction. He has published several papers in the international journals of atmospheric sciences. Recently, he is investigating impacts of the extratropical atmospheric forcings on the ENSO occurrences and the physical mechanisms for spring Eurasian climate changes.
Wen CHEN
Wen CHEN is interested in the East Asian Monsoon, interaction between the stratospheric and tropospheric circulation.
Peng HU
Peng Hu is a PhD student interested in the Monsoon Dynamics and Tropical Meteorology. He has published several papers focus on the South China Sea summer monsoon. Recently, he is studying the tropical-extratropical interaction like the Hadley circulation.
References
- Andersson, E., P. Bauer, A. Beljaars, F. Chevallier, E. Hólm, M. Janisková, P. Kållberg, et al. 2005. “Assimilation and Modeling of the Atmospheric Hydrological Cycle in the ECMWF Forecasting System”. Bulletin of the American Meteorological Society 86: 387–402. doi:10.1175/BAMS-86-3-387.
- Chen, S. F., K. Wei, W. Chen, and L. Y. Song. 2014. “Regional Changes in the Annual Mean Hadley Circulation in Recent Decades.” Journal of Geophysical Research: Atmospheres 119: 7815–7832.
- Compo, G. P., J. S. Whitaker, P. D. Sardeshmukh, N. Matsui, R. J. Allan, X. Yin, B. E. Gleason, et al. 2011. “The Twentieth Century Reanalysis Project”. Quarterly Journal of the Royal Meteorological Society 137: 1–28. doi:10.1002/qj.776.
- Davis, S. M., and K. H. Rosenlof. 2012. “A Multidiagnostic Intercomparison of Tropical-Width Time Series Using Reanalyses and Satellite Observations.” Journal of Climate 25: 1061–1078. doi:10.1175/JCLI-D-11-00127.1.
- Dee, D. P., S. M. Uppala, A. J. Simmons, P. Berrisford, P. Poli, S. Kobayashi, U. Andrae, et al. 2011. “The ERA-Interim Reanalysis: Configuration and Performance of the Data Assimilation Systems”. Quarterly Journal of the Royal Meteorological Society 137: 553–597. doi:10.1002/qj.828.
- Deser, C., A. S. Phillips, and M. A. Alexander. 2010. “Twentieth Century Tropical Sea Surface Temperature Trends Revisited.” Geophysical Research Letters 37: L10701. doi:10.1029/2010GL043321.
- Ebita, A., S. Kobayashi, Y. Ota, M. Moriya, R. Kumabe, K. Onogi, Y. Harada, et al. 2011. “The Japanese 55-Year Reanalysis “JRA-55”: An Interim Report.” Scientific Online Letters on the Atmosphere Sola 7: 149–152.
- Freitas, A. C. V., and T. Ambrizzi. 2015. “Recent Changes in the Annual Mean Regional Hadley Circulation and Their Impacts on South America.” Advances in Meteorology 2015 Article ID 780205. doi:10.1155/2015/780205.
- Freitas, A. C. V., L. Aímola, T. Ambrizzi, and C. P. de Oliveira. 2017. “Changes in Intensity of the Regional Hadley Cell in Indian Ocean and Its Impacts on Surrounding Regions.” Meteorology and Atmospheric Physics 129: 229–246. doi:10.1007/s00703-016-0477-6.
- Fu, Q., C. M. Johanson, J. M. Wallace, and T. Reichler. 2006. “Enhanced Mid-Latitude Tropospheric Warming in Satellite Measurements.” Science 312: 1179. doi:10.1126/science.1125566.
- Hadley, G. 1735. “Concerning the Cause of the General Trade-Winds: By Geo. Hadley, Esq; F. R. S.” Philosophical Transactions 39: 58–62. doi:10.1098/rstl.1735.0014.
- Hastenrath, S. 2001. “In Search of Zonal Circulations in the Equatorial Atlantic Sector from the NCEP-NCAR Reanalysis.” International Journal of Climatology 21: 37–47. doi:10.1002/(ISSN)1097-0088.
- Held, I. M., and A. Y. Hou. 1980. “Nonlinear Axially Symmetric Circulations in a Nearly Inviscid Atmosphere.” Journal of the Atmospheric Sciences 37: 515–533. doi:10.1175/1520-0469(1980)037<0515:NASCIA>2.0.CO;2.
- Hu, Y., and Q. Fu. 2007. “Observed Poleward Expansion of the Hadley Circulation since 1979.” Atmospheric Chemistry and Physics 7: 5229–5236. doi:10.5194/acp-7-5229-2007.
- Hu, Y. Y., C. Zhou, and J. P. Liu. 2011. “Observational Evidence for the Poleward Expansion of the Hadley Circulation.” Advances in Atmospheric Sciences 28: 33–44. doi:10.1007/s00376-010-0032-1.
- Huang, R., S. Chen, W. Chen, and P. Hu. 2018. “Interannual Variability of Regional Hadley Circulation Intensity over Western Pacific during Boreal Winter and Its Climatic Impact over Asia-Australia Region.” Journal of Geophysical Research: Atmospheres 123: 344–366.
- Kalnay, E., M. Kanamitsu, R. Kistler, W. Collins, D. Deaven, L. Gandin, M. Iredell, et al. 1996. “The NCEP/NCAR 40-Year Reanalysis Project”. Bulletin of the American Meteorological Society 77: 437–472. doi:10.1175/1520-0477(1996)077<0437:TNYRP>2.0.CO;2.
- Kanamitsu, M., W. Ebisuzaki, J. Woollen, S.-K. Yang, J. Hnilo, M. Fiorino, and G. Potter. 2002. “NCEP-DOE AMIP-II Reanalysis (R-2).” Bulletin of the American Meteorological Society 83: 1631–1643. doi:10.1175/BAMS-83-11-1631.
- Krishnamurti, T. N. 1971. “Tropical East-West Circulations during the Northern Summer.” Journal of the Atmospheric Sciences 28: 1342–1347. doi:10.1175/1520-0469(1971)028<1342:TEWCDT>2.0.CO;2.
- Lu, J., G. A. Vecchi, and T. Reichler. 2007. “Correction to “Expansion of the Hadley Cell under Global Warming”.” Geophysical Research Letters 34: L14808. doi:10.1029/2007GL030931.
- Lucas, C., B. Timbal, and H. Nguyen. 2014. “The Expanding Tropics: A Critical Assessment of the Observational and Modeling Studies.” Wiley Interdisciplinary Reviews: Climate Change 5: 89–112.
- Ma, J., and J. P. Li. 2008. “The Principal Modes of Variability of the Boreal Winter Hadley Cell.” Geophysical Research Letters 35: L01808. doi:10.1029/2007GL031883.
- Mitas, C. M., and A. Clement. 2005. “Has the Hadley Cell Been Strengthening in Recent Decades?” Geophysical Research Letters 32: L03809. doi:10.1029/2004GL021765.
- Mitas, C. M., and A. Clement. 2006. “Recent Behavior of the Hadley Cell and Tropical Thermodynamics in Climate Models and Reanalyses.” Geophysical Research Letters 33: L01810. doi:10.1029/2005GL024406.
- Nguyen, H., A. Evans, C. Lucas, I. Smith, and B. Timbal. 2013. “The Hadley Circulation in Reanalyses: Climatology, Variability, and Change.” Journal of Climate 26: 3357–3376. doi:10.1175/JCLI-D-12-00224.1.
- Nguyen, H., H. H. Hendon, E.-P. Lim, G. Boschat, E. Maloney, and B. Timbal. 2017. “Variability of the Extent of the Hadley Circulation in the Southern Hemisphere: A Regional Perspective.” Climate Dynamics 21: 1–14.
- Oort, A. H., and J. J. Yienger. 1996. “Observed Interannual Variability in the Hadley Circulation and Its Connection to ENSO.” Journal of Climate 9: 2751–2767. doi:10.1175/1520-0442(1996)009<2751:OIVITH>2.0.CO;2.
- Quan, X.-W., H. F. Diaz, and M. P. Hoerling. 2004. “Changes in the Tropical Hadley Cell since 1950.” In The Hadley Circulation: Present, Past, and Future, edited by H. F. Diaz and R. S. Bradley, 85–120. New York: Kluwer Academic.
- Saha, S., S. Moorthi, H.-L. Pan, X. Wu, J. Wang, S. Nadiga, P. Tripp, et al. 2010. “The NCEP Climate Forecast System Reanalysis”. Bulletin of the American Meteorological Society 91: 1015–1057. doi:10.1175/2010BAMS3001.1.
- Schwendike, J., P. Govekar, M. J. Reeder, R. Wardle, G. J. Berry, and C. Jakob. 2014. “Local Partitioning of the Overturning Circulation in the Tropics and the Connection to the Hadley and Walker Circulations.” Journal of Geophysical Research: Atmospheres 119: 1322–1339.
- Seidel, D. J., Q. Fu, W. J. Randel, and T. J. Reichler. 2008. “Widening of the Tropical Belt in a Changing Climate.” Nature Geoscience 1: 21–24. doi:10.1038/ngeo.2007.38.
- Stachnik, J. P., and C. Schumacher. 2011. “A Comparison of the Hadley Circulation in Modern Reanalyses.” Journal of Geophysical Research: Atmospheres 116: D22102. doi:10.1029/2011JD016677.
- Sun, C., F. Kucharski, J. P. Li, F. F. Jin, I.-S. Kang, and R. Q. Ding. 2017. “Western Tropical Pacific Multidecadal Variability Forced by the Atlantic Multidecadal Oscillation.” Nature Communications 8: 15998. doi:10.1038/ncomms15998.
- Wang, C. Z. 2002. “Atmospheric Circulation Cells Associated with the El Niño-Southern Oscillation.” Journal of Climate 15: 399–419. doi:10.1175/1520-0442(2002)015<0399:ACCAWT>2.0.CO;2.
- Zeng, G., W.-C. Wang, Z. B. Sun, and Z. X. Li. 2011. “Atmospheric Circulation Cells Associated with Anomalous East Asian Winter Monsoon.” Advances in Atmospheric Sciences 28: 913–926. doi:10.1007/s00376-010-0100-6.
- Zhang, G., and Z. Wang. 2013. “Interannual Variability of the Atlantic Hadley Circulation in Boreal Summer and Its Impacts on Tropical Cyclone Activity.” Journal of Climate 26: 8529–8544. doi:10.1175/JCLI-D-12-00802.1.