
ABSTRACT
The Yangtze–Huai River Basin (YHRB) always suffers from anomalously heavy rainfall during the warm season, and has been well explored as a whole area during the past several decades. In this study, the YHRB is divided into two core regions — the northern YHRB (nYHRB) and southern YHRB (sYHRB) — based on 29-year (1979–2007) June–July–August (JJA) temporally averaged daily rainfall rates and the standard deviation of rainfall. A spectral analysis of JJA daily rainfall data over these 29 years reveals that a 3–7-day synoptic-timescale high-frequency mode is absolutely dominant over the nYHRB, with 10–20-day and 15–40-day modes playing a secondary role. By contrast, 3–7-day and 10–20-day modes are both significant over the sYHRB, with 7–14-day, 15–40-day, and 20–60-day modes playing secondary roles. Based on a comparison between bandpass-filtered rainfall anomalies and original rainfall series, a total of 42, 1, 5, and 3 heavy rainfall events (daily rainfall amounts in the top 5% of rainy days) are detected over the nYHRB, corresponding to 3–7-day, 7–14-day, 10–20-day, and 15–40-day variation disturbances. Meanwhile, a total of 28, 8, 12, and 6 heavy rainfall events are detected over the sYHRB, corresponding to 3–7-day, 7–14-day, 10–20-day, and 20–60-day variation disturbances. The results have important implications for understanding the duration of summer heavy rainfall events over both regions.
摘要
基于29年夏季平均的日降水率及降水标准偏差的空间分布,本文将江淮流域分为南、北两个子区域。谱分析结果显示,3–7天高频天气尺度模态是江淮流域北部夏季降水的主导模态,10–20、15–40天的变化模态次之。相比之下,3–7、10–20天变化模态在江淮流域南部均很显著,7–14、15–40、20–60天的低频模态次之。高频天气尺度扰动在江淮流域北部强降水事件形成过程中起绝对主导作用,而在江淮流域南部,高频、中等频次、低频扰动的作用相当。
1. Introduction
The Yangtze–Huai River Basin (YHRB), covering roughly the area (27°–35°N, 114°–121°E), is one of the most centralized regions over East China for summer (June–July–August, JJA) rainfall. The rainfall over this region is mainly caused by the low-level quasi-stationary mei-yu front, low pressure systems (e.g., eastward-moving southwest vortices originating from Sichuan Basin), mesoscale convective systems, and the mid-level western Pacific subtropical high, as well as the midlatitude blocking high providing favorable large-scale circulations for rainfall (Dong and Zhao Citation2004; Zhu et al. Citation2000; Sun and Zhao Citation2003; Chen and Zhai Citation2014, Citation2016). Mei-yu is a representative precipitation phenomenon in this area. The mei-yu season is long-lasting, usually from mid-June to mid-July, and the rainfall is characterized by frequent heavy or torrential rainfall events (Ding Citation1994). Therefore, the YHRB always suffers from severe floods, like in the summer of 1991, 1998, and 2003 (Mao and Wu Citation2006; Huang et al. Citation1998; Zhang and Zhang Citation2012).
Previous studies indicate that persistent heavy rainfall events over the YHRB are always associated with the activities of low-frequency intraseasonal variation (ISV) modes (Cao et al. Citation2012; Wang et al. Citation2014). In other words, the above flooding events match well with the wet phases of ISVs. For example, the heavy rainfall events in the summer of 1991, 1998, and 2003 are consistent with the propagation and activity of ISVs with periods of 30–60 days, 15–35 days, and 10–20 days (Zhu et al. Citation2003; Chen et al. Citation2005; Mao and Wu Citation2006; Liu et al. Citation2014), respectively. These ISV modes provide favorable background conditions for persistent precipitation over the YHRB region (like the continuous water supply and anomalous cyclonic circulations); plus, they involve a series of interactions between different circulation systems from the lower to upper troposphere (Yang et al. Citation2010, Citation2014; Cao et al. Citation2012; Cao, Ren, and Sun Citation2013; Zhang, Zhou, and Zhang Citation2012).
Each rainfall event over the YHRB is always related to frequently appearing midlatitude moving synoptic systems (Chang et al. Citation1998; Qian, Tao, and Lau Citation2004; Jiao et al. Citation2004). These synoptic-scale weather systems can be viewed as a series of synoptic-timescale disturbances with periods of 3–8 days (Berry, Reeder, and Jakob Citation2012). However, most studies focus on the influence of medium- to low-frequency ISV modes (usually >10 days) on YHRB persistent heavy rainfall (e.g., Cao et al. Citation2012; Cao, Ren, and Sun Citation2013; Wang et al. Citation2014). Despite the direct contributions of synoptic disturbance to precipitation, they are usually filtered out as high-frequency noise. Recently, Liu et al. (Citation2014) found that five consistent synoptic-timescale disturbances led to the flooding events over the northern YHRB (nYHRB) in 2003. Meanwhile, they indicated that southern YHRB (sYHRB) heavy rainfall resulted from the superposition of quasi-biweekly (10–20-day) and synoptic-timescale disturbances. Following this work, Huang, Luo, and Zhang (Citation2018) also revealed the important contribution of synoptic disturbances to the pre-summer extreme rainfall over South China. Therefore, synoptic-timescale modes should be given equal attention in heavy rainfall studies.
Scientists used to regard the YHRB as a whole because the Yangtze and Huai River are spatially close (Hu and Ding Citation2003; Hu, Ding, and Liao Citation2008; Mao and Wu Citation2006; Yang et al. Citation2010). In fact, the four catastrophic flooding events after 1990 happened over different areas, i.e., 1998 along the Yangtze River; 2003 and 2007 along the Huai River; and 1991 between the Yangtze and Huai rivers (Huang et al. Citation1998; Liu et al. Citation2014; Zhao, Zhang, and Sun Citation2007; Mao and Wu Citation2006). Besides, the warm-season precipitation in East China experiences decadal changes, with increased rainfall in the Huang–Huai River region and decreased rainfall in the Yangtze River region during 2000–08, as compared with 1979–99 (Zhu et al. Citation2011). Therefore, it is necessary to check the detailed precipitation characteristics over the YHRB concerning the rainfall area.
Accordingly, we try to answer the following questions in this study: Are there any differences between the Yangtze River Basin and Huai River Basin in terms of their multi-year summer rainfall climatologies? If yes, what are the dominant variation modes of summer rainfall over these different regions? And what are the heavy rainfall distribution characteristics corresponding to different frequency modes over different regions?
The next section describes the data and methods used in this study. Section 3 reveals the dominant variation modes of summer rainfall over the two core regions and quantifies the different frequency distributions related to heavy rainfall events over the two regions. A summary and concluding remarks are given in the final section.
2. Data and methods
2.1. Data
In this study, the daily rainfall data over land that were compiled by the Asian Precipitation-Highly Resolved Observational Data Integration towards Evaluation of the Water Resources (APHRODITE) project are adopted. The APHRODITE project began in 2006 through the collaborative efforts of the Research Institute for Humanity and Nature and the Meteorological Research Institute of the Japan Meteorological Agency. It aims to develop state-of the-art daily precipitation datasets on high-resolution grids covering the whole of Asia. The major differences between this and the previous versions, e.g., V0902 in Liu et al. (Citation2014), include improved quality control (QC) and the inclusion of new data. Detailed information about the algorithm, QC, and spatial interpolation can be found in Yatagai, Xie, and Alpert (Citation2008) and Yatagai et al. (Citation2012) and at the website www.chikyu.ac.jp/precip/. The time coverage and spatial resolution of the latest version, V1101, is 1951–2007 and 0.25°, respectively. Here, we focus on 1979–2007, a total of 29 years.
2.2. Spectral analysis and filtering
We use the same spectral analysis and filtering techniques as those in Liu et al. (Citation2014), only a brief description of which is provided here, as follows. To identify the prominent temporal range of rainfall fluctuation periods in the core region, the fast Fourier transform method is performed on the area-averaged daily rainfall data. In view of the lack of knowledge on the relationship between synoptic-timescale disturbances and heavy rainfall events over the YHRB, we preserve the high-frequency variations, i.e., based on the ‘raw’ daily rainfall series with no running mean. The raw spectral estimates are smoothed and a tapered window (10% of the data) is adopted. Multi-year averaged power spectra are obtained from the mean of each spectrum (removing the climatology). The statistical significance of the power spectra is tested, following the method of Gilman, Fuglister, and Mitchell (Citation1963), which is based on the mean red-noise power spectrum.
Periodical rainfall events can be captured from both the raw area-averaged daily rainfall and at each grid point through a fixed-period bandpass filtering, which is based on the Fourier harmonic analysis. The bandpass filtering is carried out for the area-averaged daily rainfall throughout the whole year. We also adopt phase analysis to describe the evolution of each disturbance. There are a total of nine phases in one life cycle of the disturbance (one disturbance refers to one cycle from phase 1 to phase 9 of the bandpass-filtered rainfall series). The peak dry phase (phase 1) and peak wet phase (phase 5) refer to the minimum and maximum rainfall day, respectively (see Figure 3e in Liu et al. (Citation2014)).
3. Dominant variation modes of heavy rainfall events
3.1. Rainfall climatology over the YHRB
Overall, the 29-year averaged daily rainfall (JJA) shows an east–west belt shape, and the rainfall intensity gradually decreases from south to north over China ()). Specifically, the rainfall intensity over the YHRB region is 6–8 mm d−1 south of 31°N and 4–6 mm d−1 north of 31°N. The standard deviation of daily rainfall presents a similar distribution as those of the daily rainfall but includes more locally large-value areas ()). The rainfall south of 31°N features large intensity variation during 1979–2007, as reflected by the relatively larger values of standard deviation (>12 mm d−1).
Figure 1. (a) Daily rainfall climatology (units: mm d−1) for JJA 1979–2007. (b) Standard deviation of daily rainfall for JJA 1979–2007. The boxes in (a, b) represent the core regions of the nYHRB (31°–35°N, 114°–121°E) and sYHRB (27°–31°N, 114°–121°E), respectively.
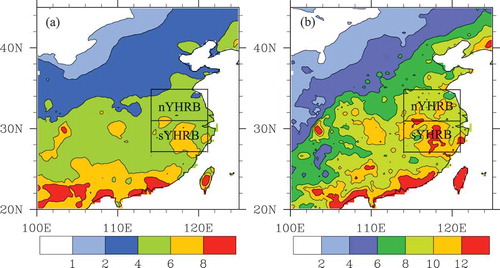
Obviously, the rainfall over the YHRB region presents a different climatology to the north and south of 31°N, which is consistent with the case study of Liu et al. (Citation2014). Therefore, here, we also divide the YHRB into two subregions, i.e., the nYHRB (31°–35°N, 114°–121°E) and sYHRB (27°–31°N, 114°–121°E) (). The subsequent rainfall analyses in this paper are all based on these two regions.
3.2. Averaged spectral characteristics over the subregions
In order to detect the dominant rainfall frequency bands, as the first step, we carry out power spectral analysis for the area-averaged daily rainfall series during JJA in 1979–2007 over the abovementioned two core regions, i.e., the nYHRB and sYHRB, respectively. When the calculated spectrum exceeds the Markov red-noise spectrum, the corresponding frequency bands are regarded as significant. Over the nYHRB, the 29-year averaged spectrum shows four significant spectral peaks of 4–6, 8–10, 15, and 30 days ()). It should be noted that the 3–7-day frequency band is well above the 95% confidence level with a variance contribution of 42.1%. To further detect the dominant frequency bands, the year-by-year power spectrum, the original rainfall series and the corresponding bandpass-filtered rainfall anomalies are simultaneously analyzed over the two regions (Figures S1 and S2). Overall, synoptic-timescale high-frequency bands that are shorter than 10 days present an absolute dominant position in the 29-year spectral analyses of the rainfall over the nYHRB (Figure S1). Specifically, the 3–7-day frequency band is significant in 23 summers. The low-frequency bands of 10–20 (quasi-biweekly timescale), 15–40, and 7–14 days are only significant in 5, 4, and 1 summers, respectively.
Figure 2. Multi-year averaged power spectra of the APHRODITE daily rainfall rates over the (a) nYHRB and (b) sYHRB during JJA 1979–2007, with the calculated spectrum (solid line), Markov red-noise spectrum (dashed lines), 95% upper (dot-dashed lines), and 5% lower (dotted lines) confidence bounds. The abscissa has been rescaled to the natural logarithm of frequency.
Over the sYHRB, the 29-year averaged spectrum also shows four significant spectral peaks, of 6, 8–12, 15, and 30 days ()). In contrast to the nYHRB, the variance contribution of the 3–7-day frequency band is much lower, with a value of 33.1%. In fact, both the high- and low-frequency bands are significant in the spectral analyses of daily rainfall over the sYHRB (Figure S2). More specifically, the 3–7-day synoptic-timescale frequency band is significant in 20 summers. The 10–20-, 7–14-, 20–60-, and 15–40-day frequency bands are significant in 8, 5, 5, and 4 summers, respectively.
shows the mean power spectra of the daily rainfall for the summers dominated by different frequency bands for the nYHRB and sYHRB, respectively. The dominant frequency bands are all well above the 95% upper confidence bound for both regions, except the 20–60-day band over the sYHRB (still significant against the red-noise spectrum). It should be noted that, although the 7–14-, 10–20-, 15–40-, and 20–60-day frequency bands overlap, they are significant in different years over the nYHRB and sYHRB regions. Therefore, the dominant rainfall variation modes for the nYHRB are 3–7, 10–20, and 15–40 days. By contrast, the dominant modes for the sYHRB are 3–7, 10–20, 7–14, 20–60, and 15–40 days.
Figure 3. Multi-year averaged power spectra of the APHRODITE daily rainfall rates for the summers of (a) 1979–1984, 1986–1990, 1992–1997, 1999, 2000, 2003–2005, and 2007 over the nYHRB; (b) 1980–1990, 1993–1996, 1999, 2003–2005, and 2007 over the sYHRB; (c) 1980, 1981, 1987, 1997, and 1998 over the nYHRB; (d) 1981, 1986, 1989, 1993, 1997, 1999, 2000, and 2003 over the sYHRB; (e) 1983, 1991, 2000, and 2002 over the nYHRB; (f) 1979, 1984, 1987, and 1991 over the sYHRB; (g) 1992, 2001, 2002, 2005, and 2006 over the sYHRB; and (h) 1982, 1988, 1994, 1995, and 1998 over the sYHRB.
3.3. Criteria and statistics of different frequency band heavy rainfall cases
In order to extract the corresponding 3–7-day, 7–14-day, 10–20-day, and other low-frequency heavy rainfall events, we apply bandpass filtering to the area-averaged daily rainfall series based on the spectral analyses over both the nYHRB and sYHRB regions for each year from 1979 to 2007. We use the following criteria to select the typical heavy rainfall events in each frequency band: (1) the maximum daily rainfall intensity in the peak wet phase (i.e., P5) should be larger than 18 (22) mm d−1 for the nYHRB (sYHRB) region, which corresponds to the upper 5% of rainfall intensity (rainy days) during JJA 1979–2007; (2) the daily rainfall intensity in at least one dry phase should be smaller than 5 mm d−1; and (3) the amplitudes of the bandpass-filtered rainfall anomaly in the peak wet phase and in at least one peak dry phase should exceed one standard deviation (6.44 mm d−1 for the nYHRB and 7.10 mm d−1 for the sYHRB).
Based on the above criteria, we make a year-by-year (JJA) comparison of area-averaged daily rainfall series against the corresponding different frequency bandpass-filtered rainfall anomaly series over the two regions. There are a total of 42 synoptic-timescale heavy rainfall events, with an average duration of five days (). The 7–14-, 10–20-, and 15–40-day frequency band each has one, five and three heavy rainfall events for all the 29-year analyses, with a mean duration of 11, 15, and 23 days, respectively. Only two heavy rainfall events are the result of the combined action of 3–7- and 10–20-day frequency disturbances. Obviously, synoptic-timescale-disturbance–related heavy rainfall events occupy an absolute large proportion (42 among 51 events). Because of the shorter duration, it seldom leads to severe flooding over this region. In addition, the vast majority of heavy rainfall events (42) happen in June and July; only eight synoptic-timescale and one 10–20-day-disturbance–related events occur in August.
Table 1. Statistics (period, number, and mean duration) of heavy rainfall–related disturbances over the nYHRB and sYHRB regions.
Over the sYHRB, the numbers of high-frequency synoptic-timescale disturbances and medium- and low-frequency-disturbance–related heavy rainfall events are equivalent. Specifically, there are 28, 8, 12, and 6 heavy rainfall events corresponding to the 3–7-, 7–14-, 10–20-, and 20–60-day frequency bands, respectively. Also, the mean durations are 5, 10, 14, and 31 days (). An increase in medium- and low-frequency variations of heavy rainfall events usually results in the sYHRB being subjected to long-lasting flooding. Besides, among all the 54 heavy rainfall events, there are only two in August. This is easy to understand because the rainfall over this region focuses on June and July, i.e., the mei-yu season.
The heavy rainfall events over the sYHRB show more combined effects of synoptic-timescale and medium- or low-frequency variations in the summers of 1989, 1993, 1994, 2003, and 2005. On 17 June 1989, 18 June 1993 and 24 June 2003, the rainfall intensities are around 28.0, 27.8, and 42.8 mm d−1, all of which correspond to the peak wet phases of 3–7-day and 10–20-day bandpass-filtered rainfall series. On 13 June 1994 (18 June 2005), the heavy rainfall similarly corresponds to the peak wet phases of 3–7-day and 20–60-day (7–14-day) bandpass-filtered rainfall series.
4. Summary and conclusion
In this study, the major variation modes of the summer (JJA) rainfall over the YHRB during 1979–2007 are investigated. Based on the spatial distribution of 29-year-averaged summer daily rainfall rates and the standard deviation of daily rainfall in East China, the YHRB is separated into two core regions, i.e., the nYHRB and sYHRB. Then, the dominant variation modes over each region are analyzed and compared, and heavy rainfall events corresponding to different frequency disturbances, based on the given criteria, are selected.
The power spectral analyses indicate that high-, medium-, and low-frequency variations all exist over the two regions. The rainfall over the two core regions shows obvious differences, with different variation modes. Over the nYHRB, the dominant variation modes are 3–7, 10–20, and 15–40 days, with occurrence times of 23, 5, and 4 summers, respectively. Among them, the 3–7-day high-frequency band is prominent, with a variance contribution of 42.1%, in the 29-year mean power spectrum. Over the sYHRB, 3–7, 10–20, 15–40, 7–14, and 20–60 days are all dominant variation modes, with occurrence times of 20, 8, 4, 5, and 5 summers, respectively. In contrast to the nYHRB, the medium- and high-frequency modes play more important roles over the sYHRB.
Based on detailed criteria, we select specific heavy rainfall events corresponding to different frequency disturbances over the two regions. Consistent with the power spectral analyses, a total of 42 3–7-day synoptic-timescale-disturbance–related heavy rainfall events are selected over the nYHRB, which occupies an absolute high ratio in all the 51 selected events. Only five and three heavy rainfall events are detected corresponding to 10–20-day and 15–40-day disturbances. In contrast, the numbers of high-, medium-, and low-frequency-disturbance–related heavy rainfall events are comparable over the sYHRB. Specifically, a total of 28, 8, 12, and 6 heavy rainfall events are detected corresponding to 3–7-, 7–14-, 10–20-, and 20–60-day disturbances. Despite the differences in frequency and the subsequent heavy rainfall distributions between the two regions, the mean durations of 3–7-, 7–14-, and 10–20-day related rainfall events are similar, i.e., 5, 10–11, and 14–15 days. Also, most of the selected heavy rainfall events happen in June and July, with only 11 events in August (nine for the nYHRB and two for the sYHRB).
It should be mentioned that the aim of this paper is to investigate the dominant variation modes of summer heavy rainfall over the nYHRB and sYHRB. Given the importance of synoptic-timescale variation for both the nYHRB and sYHRB, and the comparatively large amounts of investigations on low-frequency variations, the intention is to further explore the corresponding synoptic-scale circulation systems that lead to heavy rainfall events, based on both case studies and climatological statistics, in future work. The findings are expected to better our understanding of the heavy-rainfall formation mechanisms and provide hints for heavy-rainfall forecasting.
Supplemental Material
Download PDF (5.2 MB)Acknowledgments
The APHRODITE data used in this study were provided through APHRODITE’s water resources project (http://www.chikyu.ac.jp/precip).
Disclosure statement
No potential conflict of interest was reported by the author.
Supplementary material
Supplementary data can be accessed here
Additional information
Funding
Related Research Data
References
- Berry, G. J., M. J. Reeder, and C. Jakob. 2012. “Coherent Synoptic Disturbances in the Australian Monsoon.” Journal of Climate 25 (24): 8409–8421. doi:10.1175/JCLI-D-12-00143.1.
- Cao, X., X. Ren, and X. Sun. 2013. “Low-Frequency Oscillations of Persistent Heavy Rainfall over Yangtze-Huaihe River Basin (In Chinese).” Journal of the Meteorological Sciences 33: 362–370.
- Cao, X., X. Ren, X. Yang, and J. Fang. 2012. “The Quasi-Biweekly Oscillation Characteristics of Persistent Severe Rain and Its General Circulation Anomaly over Southeast China from May to August (In Chinese).” Acta Meteorologica Sinica 70: 766–778.
- Chang, C.-P., S. C. Hou, H. C. Kuo, and G. T. J. Chen. 1998. “The Development of an Intense East Asian Summer Monsoon Disturbance with Strong Vertical Coupling.” Monthly Weather Review 126: 2692–2712. doi:10.1175/1520-0493(1998)126<2692:TDOAIE>2.0.CO;2.
- Chen, G., W. Li, Z. Yuan, and Z. Wen. 2005. “Evolution Mechanisms of the Intraseasonal Oscillation Associated with the Yangtze River Basin Flood in 1998.” Science in China Series D Earth Sciences 48: 957–967. doi:10.1360/03yd0278.
- Chen, Y., and P. Zhai. 2014. “Precursor Circulation Features for Persistent Extreme Precipitation in Central-Eastern China.” Weather and Forecasting 29: 226–240. doi:10.1175/WAF-D-13-00065.1.
- Chen, Y., and P. Zhai. 2016. “Mechanisms for Concurrent Low-Latitude Circulation Anomalies Responsible for Persistent Extreme Precipitation in the Yangtze River Valley.” Climate Dynamics 47: 989–1006. doi:10.1007/s00382-015-2885-6.
- Ding, Y.-H. 1994. Monsoons over China, 419. Boston: Kluwer Academic.
- Dong, P., and S. Zhao. 2004. “A Diagnostic Study of Mesoscale Lows (Disturbances) on Meiyu Front and Associated Heavy Rainfall.” Chinese Journal of Atmospheric Sciences (in Chinese) 28:876–891.
- Gilman, D. L., F. J. Fuglister, and J. M. Mitchell Jr.. 1963. “On the Power Spectrum of ‘Red Noise’.” Journal of Atmospheric Science 20: 182–184. doi:10.1175/1520-0469(1963)020<0182:OTPSON>2.0.CO;2.
- Hu, G., and Y. Ding. 2003. “A Study on the Energy and Water Cycles over Changjiang-Huaihe River Basins during the 1991 Heavy Rain Periods.” Acta Meteorologica Sinica (in Chinese) 61:146–163.
- Hu, Y., Y. Ding, and F. Liao. 2008. “A Study of Updated Definition and Climatological Characters of Meiyu Season in the Yangtze-Huaihe Region.” Chinese Journal of Atmospheric Sciences 3 (2): 101–112. in Chinese.
- Huang, L., Y. Luo, and D.-L. Zhang. 2018. “The Relationship between Anomalous Presummer Extreme Rainfall over South China and Synoptic Disturbances.” Journal of Geophysical Research: Atmospheres 123. doi:10.1002/2017JD028106.
- Huang, R., Y. Xu, P. Wang, and L. Zhou. 1998. “The Features of the Catastrophic Flood over the Changjiang River Basin during the Summer of 1998 and Cause Exploration.” Climatic and Environmental Research (in Chinese) 3:300–313.
- Jiao, M., X. Yao, B. Zhou, and K. Yang. 2004. Synoptic Analysis of Summer 2003 Heavy Rainfall over Huai River Basin, 215. in Chinese. Beijing: China Meteorological Press.
- Liu, H., J. Yang, D.-L. Zhang, and B. Wang. 2014. “Roles of Synoptic to Quasi-Biweekly Disturbances in Generating the Summer 2003 Heavy Rainfall in East China.” Monthly Weather Review 142: 886–904. doi:10.1175/MWR-D-13-00055.1.
- Mao, J., and G. Wu. 2006. “Intraseasonal Variations of the Yangtze Rainfall and Its Related Atmospheric Circulation Features during the 1991 Summer.” Climate Dynamics 27: 815–830. doi:10.1007/s00382-006-0164-2.
- Qian, J.-H., W.-K. Tao, and K.-M. Lau. 2004. “Mechanisms for Torrential Rain Associated with the Mei-Yu Development during SCSMEX 1998.” Monthly Weather Review 132: 2–27. doi:10.1175/1520-0493(2004)132<0003:MFTRAW>2.0.CO;2.
- Sun, J., and S. Zhao. 2003. “A Study of Special Circulation during Meiyu Season of the Yangtze River Basin in 1998.” Climatic and Environmental Research (in Chinese) 8:291–306.
- Wang, L., Y. Pang, B. Yu, and Y. Li. 2014. “The Characteristics of Persistent Heavy Rain Events and 10–30 Day Low-Frequency Circulation in Yangtze-Huaihe River Basin during Meiyu Period.” Journal of Tropical Meteorology (in Chinese) 30:851–860.
- Yang, J., Q. Bao, B. Wang, D.-Y. Gong, H. He, and M.-N. Gao. 2014. “Distinct Quasi-Biweekly Features of the Subtropical East Asian Monsoon during Early and Late Summers.” Climate Dynamics 42: 1469–1486. doi:10.1007/s00382-013-1728-6.
- Yang, J., B. Wang, B. Wang, and Q. Bao. 2010. “Biweekly and 21–30 Day Variabilities of the Subtropical East Asian Monsoon over the Lower Reach of Yangtze River Basin.” Journal of Climate 23: 1146–1159. doi:10.1175/2009JCLI3005.1.
- Yatagai, A., K. Kamiguchi, O. Arakawa, A. Hamada, N. Yasutomi, and A. Kitoh. 2012. “APHRODITE: Constructing a Long-Term Daily Gridded Precipitation Dataset for Asia Based on a Dense Network of Rain Gauges.” Bulletin of the American Meteorological Society 93: 1401–1415. doi:doi:10.1175/BAMS-D-11-00122.1.
- Yatagai, P. Xie, and P. Alpert. 2008. “Development of a Daily Gridded Precipitation Data Set for the Middle East.” Advances in Geosciences 12: 165–170. doi:10.5194/adgeo-12-165-2008.
- Zhang, M., and D.-L. Zhang. 2012. “Sub-Kilometer Simulation of a Torrential- Rain-Producing Mesoscale Convective System in East China. Part I: Model Verification and Convective Organization.” Monthly Weather Review 140: 184–201. doi:10.1175/MWR-D-11-00029.1.
- Zhang, Y., B. Zhou, and Y. Zhang. 2012. “Abnomality of General Circulation with LFO during the Torrential Rainstorms over Southern China in 2010.” Meteorological Monthly (in Chinese) 38:1367–1377.
- Zhao, S., L. Zhang, and J. Sun. 2007. “Study of Heavy Rainfall and Related Mesoscale Systems Causing Severe Flood in Huaihe River Basin during the Summer of 2007.” Climatic and Environmental Research (in Chinese) 12:713–727.
- Zhu, C., T. Nakazawa, J. Li, and L. Chen. 2003. “The 30–60 Day Intraseasonal Oscillation over the Western North Pacific Ocean and Its Impacts on Summer Flooding in China during 1998.” Geophysical Research Letters 30: 223–250. doi:doi:10.1029/2003GL017817.
- Zhu, Q., J. Lin, S. Shou, and D. Tang. 2000. The Principles and Methodology of Synoptic Meteorology. Beijing: China Meteorological Press. in Chinese, p. 649.
- Zhu, Y., H. Wang, W. Zhou, and J. Ma. 2011. “Recent Changes in the Summer Precipitation Pattern in East China and the Background Circulation.” Climate Dynamics 36: 1463–1473. doi:10.1007/s00382-010-0852-9.