
ABSTRACT
Black carbon (BC) has a significant impact on air quality and atmospheric light absorption due to its unique physical properties. In this study, a ten-wavelength black carbon monitor was used to measure BC concentrations continuously during winter in urban Beijing. A comparison of BC concentrations was carried out between the ten-wavelength black carbon monitor and a multi-angle absorption photometer (MAAP) and a thermal optical transmission method carbon analyzer. The results showed significant correlations between BC measured by the MAAP, the thermal optical transmission method carbon analyzer and BC measured at the 660 nm wavelength using the ten-wavelength black carbon monitor. Obvious differences in BC concentrations were recorded at the different wavelength ranges. The BC concentrations observed in the visible ranges, near-infrared ranges and near-ultraviolet ranges were on average 3.1, 2.6, and 4.6 μg m−3, respectively. The differences between the absorption coefficient of BC370 nm and BC880 nm increased with the enhancement of OC:TC (ratio of organic carbon to total carbon) and PM2.5, indicating that organic matter had strong light absorption at near-ultraviolet wavelength. BC concentrations had clear diurnal variations with maxima at 0300 and minima at 1400 (Local time). In addition, potential contribution source areas of BC were also analyzed. This is the first time that BC measurements have been conducted using the ten-wavelength BC monitor, which provided more information of BC at different wavelengths compared to other methods.
摘要
黑碳(BC)因其独特的物理性质对空气质量和大气光吸收产生重要影响。本研究使用10波段BC分析仪于北京冬季对BC进行了连续观测,并与多角度吸收光度计和热光法半连续大气有机碳和元素碳分析仪测得的元素碳数据进行了对比,结果表明在660 nm波段10波段黑碳仪与三者都有较好的一致性。但在不同波段测得的黑碳浓度存在明显差异,在可见光、近红外和近紫外光波段的黑碳平均浓度分别为3.1、2.6和4.6 μg/m3 μg m-3。黑碳在370 nm和880 nm波段的光吸收系数差值随着OC与TC比值的增大而增大,这表明颗粒物中的有机组分在近紫外光波段有较强的光吸收作用。研究期间黑碳浓度呈现明显的日变化特征,在3:00出现最大值而在14:00出现最小值。此外,还分析了北京地区黑碳的潜在源贡献源区。该研究首次使用10波段黑碳仪于北京地区展开黑碳浓度的观测研究,与已有结果相比该方法设备能够提供更多波段的黑碳吸收和浓度信息。
1. Introduction
Black carbon (BC), an important component of atmospheric aerosol, originates mainly from the incomplete combustion of fossil fuel and biomass. BC has strong optical absorption, which accounts for 90%–95% of the total optical absorption of atmospheric aerosol (Japar et al. Citation1986; Hansen et al. Citation1993). As a result, the absorption coefficient of BC is often used as that of the atmospheric aerosol (Ran et al. Citation2016; Wu et al. Citation2012). Compared with other carbonaceous matter, BC has unique radiative properties. The Intergovernmental Panel on Climate Change (IPCC) reported the radiative forcing of BC aerosol in the upper atmosphere to be 0.24 ± 0.14 W m−2 (IPCC Citation2007), second only to CO2, which is an important component causing global warming. In addition, BC can reduce visibility (Ji et al. Citation2017) and cause adverse health effects (Smith et al. Citation2009). Thus, it is essential to recognize the characteristics of BC and assess its optical and radiative properties.
Many studies are currently underway to quantify the optical properties and radiative forcing of aerosol. Wang et al. (Citation2010) conducted surface measurements of aerosol properties over northwestern China and found BC not only fluctuated with the dust plume, but was also affected by local air pollutants. Ding et al. (Citation2016) used the WRF-Chem model to understand the impact of BC on haze pollution via aerosol–planetary boundary layer interactions and demonstrated that BC can induce heating in the planetary boundary layer (PBL) and decrease surface heat flux to depress the development of the PBL, hence enhancing haze pollution. Wang et al. (Citation2015) analyzed relationships between BC aerosol and wind speed from January 2008 to December 2012 in Shanghai and indicated that BC aerosol mass transported by southwesterly, westerly, and northwesterly winds was ~84% of the total mass. Wang et al. (Citation2018a) measured the optical and microphysical properties of mineral dust aerosols along the Hexi Corridor and found significant differences in the optical and microphysical properties of aerosols between anthropogenic soil dust and natural mineral dust under different atmospheric conditions.
BC exerts a profound impact on air quality and climate because of its high absorption cross-section over a broad range of the near-ultraviolet through near-infrared electromagnetic spectrum. However, existing aethalometers for BC measurements only use one (880 nm), two (370 and 880 nm), or seven wavelengths (from 370 to 950 nm), which does not completely reflect the characteristics of wide-spectrum absorption. In this study, we used a ten-wavelength black carbon monitor (model BC 1054, Met One Instruments, USA) to obtain detailed information of wide-spectrum absorption. Note that this is the first time that BC measurements have been made using a ten-wavelength BC monitor, the aim being to describe in detail the characteristics of BC in the visible, near-infrared and near-ultraviolet ranges.
2. Instrumentation and methods
The sampling site was situated in the sub-center of the Institute of Atmospheric Physics, Chinese Academy of Sciences, in urban Beijing (39°58ʹ28”N, 116°22ʹ16”E), near both the North 3rd and 4th Ring Roads. A detailed description of the sampling site can be found in Ji et al. (Citation2017). The observation period was from 19 January to 18 March 2017.
Near-real-time continuous measurements of BC were made using a multi-spectrum carbon monitor (model BC 1054, Met One Instruments, USA) at the study site. The carbon monitor was a ten-wavelength BC monitor, which automatically measures and records optical transmission across filter media onto which particulate matter has been deposited at 10 wavelengths ranging from 370 nm to 950 nm. The wavelength channels allow analysis of carbon particulate at the wavelengths of 370 nm, 420 nm, 470 nm, 525 nm, 565 nm, 590 nm, 660 nm, 700 nm, 880 nm and 950 nm. Ambient air is drawn into the instrument at a controlled flow rate of 2 L/min through a size-selective PM2.5 fractionator. The sampled air is subsequently drawn through special glass fiber filter tape, thereby trapping ambient particulate matter. Optical transmission at each of the wavelengths is measured through the filter tape, allowing BC mass concentrations to be calculated at each wavelength in near real time. The filter tape is set to advance either at predetermined frequencies (e.g., once per hour) or when sufficient particulate matter has been deposited on the tape to cause the attenuation of one of the wavelength channels to a threshold value. Measurements at 370 nm (BC1) were used as the BC concentration in the near-ultraviolet range. The average level of 420 nm, 470 nm, 525 nm, 565 nm, 590 nm, 660 nm, and 700 nm (from BC2 to BC8) was used as the BC concentration in the visible range. The average level of 880 nm and 950 nm (BC9 and BC10) was used as the BC concentration in the near-infrared range.
Total PM2.5 was measured using a tapered element oscillating microbalance (TEOM) PM2.5 monitor operated at a fixed control temperature of 30°C (Model 1405, Thermo-Fisher Scientific). The resolution was 0.1 μg m−3 and the accuracy was ±2.0 μg m−3 (1-h average) and ±1.0 μg m−3 (24-h average). Organic carbon (OC), elemental carbon (EC), and total carbon (TC) in PM2.5 were measured with a thermal optical transmission OC/EC analyzer (RT-4, Sunset Laboratory Inc. Oregon, USA). A detailed description of the OC/EC analyzer can be found in Ji et al. (Citation2016). In addition, a multi-angle absorption photometer (MAAP, Model 5012, Thermo-Fisher Scientific, USA) was used to measure BC with a temporal resolution of 5 min and a flow rate of 5 L/min. The instrument is based on the principle of aerosol light absorption and the corresponding atmospheric BC mass concentration at the wavelength of 637 nm. A detailed description of MAAP can been found in Petzold, Kramer, and Schonlinner (Citation2002). In this study, the absorption coefficient (babs) and potential source contribution function (PSCF) model were employed to analyze the optical properties and potential source contribution areas of BC, respectively. The calculation of babs can be found in Ji et al. (Citation2017) and the PSCF model was introduced in Wang et al. (Citation2018b).
3. Results and discussion
3.1. Comparison with different instruments
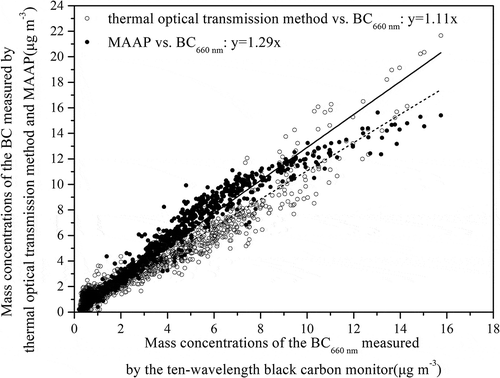
The quantification of BC or EC is dependent on the method employed. A comparative experiment was performed to establish a conversion factor that enables a better comparison of data obtained with different methods. A regression approach was used for method comparison as no standard method exists. The linear regression line should ideally have a zero y-axis intercept. As can be seen from , the results showed significant correlations between the BC measured by the MAAP, the thermal optical transmission method carbon analyzer, and the BC660 nm measured by the ten-wavelength black carbon monitor. High correlation coefficients (0.99 and 0.98) were observed, and the slopes were 1.29 and 1.11, respectively. The difference in the slopes indicates that wavelength played an important role in BC concentrations. The fact that the MAAP measures light absorbance using a 637 nm laser, whereas the ten-wavelength BC monitor measures light absorption at 660 nm might account in part for the lower BC values as compared to the optical BC values (Kirchstetter, Novakov, and Hobbs Citation2004). The value of attenuation cross-section is different at the different wavelengths and depends on the physical and chemical characteristics of light absorbing species that could include OC as well as EC (Jeong et al. Citation2004; Lavanchy et al. Citation1999; Li et al. Citation2006; Salako et al. Citation2012). The wavelength of the OC/EC analyzer was 660 nm, the same as that of the ten-wavelength BC monitor. However, BC and EC are typically defined operationally by their measurement protocols, which resulted in the difference in BC concentrations. BC is an optical measurement representing the extent of light absorption, while EC is determined by thermal optical protocols with correction by the thermal–optical transmission.
Figure 1. Regression lines of BC concentrations (BC660 nm) measured by the ten-wavelength BC monitor, the multi-angle absorption photometer (MAAP), and the thermal optical transmission OC/EC analyzer.
3.2. Levels of BC
The values of light absorption of particles are different over the whole spectrum. Measurement at only 880 nm, which has frequently been used in the past, is insufficient to understand the absorption properties of these aerosols, and extended measurement throughout the near-infrared through the near-ultraviolet range is essential. ) shows hourly BC concentrations from the near-ultraviolet to near-infrared from 19 January to 18 March 2017. During the study period, the average BC concentration at near-ultraviolet was 4.6 μg m−3, ranging from 0.2 to 30.4 μg m−3; the average BC concentration in the visible part was 3.1 μg m−3, ranging from 0.2 to 17.7 μg m−3; and the average BC concentration at near-infrared was 2.6 μg m−3, ranging from 0.2 to 13.6 μg m−3. The average BC concentration at 880 nm was 2.6 μg m−3 in this study, which was lower than the previous results of 5.8 μg m−3 in Ji et al. (Citation2017), 4.3 μg m−3 in Wang et al. (Citation2016), 7.7 μg m−3 in Song et al. (Citation2013), and 7.0 μg m−3 in Zhou et al. (Citation2012), in winter in Beijing. This may suggest that air-pollution control measures are gradually coming into effect in Beijing. The observed BC concentrations in this study were obviously higher than those in Qinghai, but lower than those previously observed in Shanghai, Nanjing, Shenzhen, Jiaxing, and Xi’an, China; and in Pune, Kadapa, and Anantapur, India. Note that the BC concentrations are still higher than those observed in Los Angeles (0.12 μg m−3) and Fukue (~0.47 μg m−3), which indicated that BC concentrations in China are still high, that a large gap exists with developed countries, and more effort is still required to improve local air quality (BC concentrations reported in other cities are shown in the supplementary material).
Figure 2. (a) Time series (hourly mean, dots), (b) box and whisker plot, and (c) diurnal variation of BC at different wavelengths from 19 January to 18 March 2017. Note: legends in all box and whisker plots are the same in subsequent figures.
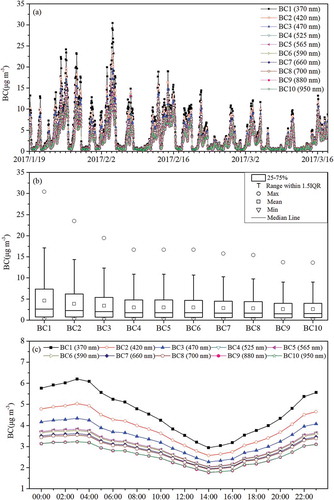
It is apparent that all 10 concentrations tracked one another; however, the measured BC concentrations at the 370 nm wavelength were highest and could indicate the presence of OC compounds (Jeong et al. Citation2004; Andreae and Gelencsér Citation2006; Chow et al. Citation2009). As shown in ), with the increase of wavelength, the average BC concentrations decreased from 4.6 to 2.6 μg m−3. The measured difference in BC at different wavelengths could result from some aromatic organic compounds having strong light absorption in the near-ultraviolet and into the visible wavelengths, and some inorganic compounds having molecular absorption at near-infrared (Kirchstetter, Novakov, and Hobbs Citation2004). Note that higher BC concentrations were measured at near-ultraviolet during Spring Festival (27 January to 2 February), indicating that emission from fireworks can make a significant ultraviolet absorption contribution, which is consistent with the findings of Ji et al. (Citation2017).
3.3. Diurnal variations of BC
As shown in ), the diurnal variation of BC presented a prominently sharp peak at around 0300 LST (the same applies to all other time values hereafter) during the study period. The high levels of BC from late night to early morning resulted from emissions of heavy-duty vehicles (HDVs) and heavy-duty diesel trucks (HDDTs) (Beijing traffic regulations allow HDVs and HDDTs to enter the urban area inside the 5th Ring Road from 0000 to 0600 only) and residential heating at nighttime. After 0300, the concentration of BC decreased quickly. Note that there was no peak value of BC in the morning, which is slightly different from previous findings (Ji et al. Citation2017). As HDVs and HDDTs are forbidden to enter the 5th Ring Road after 0600, BC still kept a downward trend despite vehicular emissions during rush hour in the morning. After sunrise, the boundary layer developed and BC concentrations decreased gradually due to increased convective activity, with the minimum value at approximately 1400. Afterwards, BC concentrations started building up slowly again with the evolution of the stable boundary layer. The difference between daily maximum and minimum BC concentrations (△C i.e., Cmax − Cmin) observed from 370 nm to 950 nm were 3.25, 2.46, 2.06, 1.78, 1.76, 1.74, 1.66, 1.63, 1.46, and 1.45 μg m−3, respectively. The △BC (BC370 nm − BC880 nm) at 0300 reached the maxima, 2.97 ± 3.62 μg m−3, suggesting that particles made a significant ultraviolet absorption contribution. This was associated with the emissions of HDVs and HDDTs using diesel from 0000 to 0600, and residential heating at nighttime.
3.4. Absorption characteristics of BC
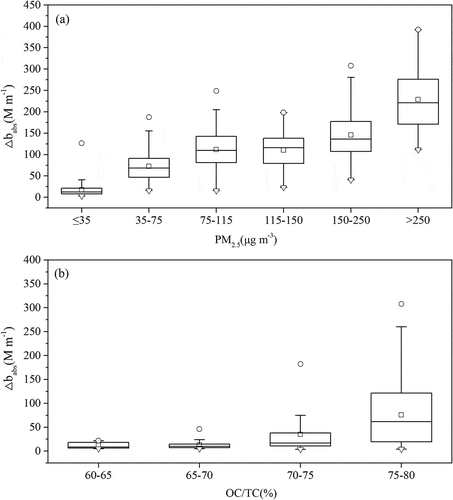
The absorption coefficient of BC370 nm ranged from 4.8 to 509.3 M m−1, with an average value of 86.8 M m−1. The average absorption coefficient of BC880 nm was 22.5 M m−1, ranging from 1.7 to 195.3 M m−1. ) shows the differences between the absorption coefficients of BC370 nm and BC880 nm (△babs, i.e., babs370 nm − babs880 nm) in different PM2.5 mass groups. The mass groups of PM2.5 were classified according to the Regulation on Ambient Air Quality Index (on trial, HJ633-2012). The average △babs values were 3.2, 19.4, 30.9, 28.1, 36.0, and 67.9 M m−1 in the different PM2.5 mass groups, respectively. As shown, △babs increased with the enhancement of PM2.5 concentrations, indicating that the light absorptive capacity of aerosol particles at near-ultraviolet was stronger than that at near-infrared when PM2.5 concentrations increased. It also indicated the increase in the light absorptive capacity at different wavelengths led to visibility impairment with the degradation of air quality. As shown in ), there were small differences in △babs (12.5 M m−1, on average) when the ratios of OC to TC were less than 70%. However, △babs increased markedly when the ratios of OC to TC were higher than 70%, indicating that organic material had strong light absorption at near-ultraviolet compared with other components. Considering that organic matter could have strong light absorption at near-ultraviolet (Jeong et al. Citation2004; Andreae and Gelencsér Citation2006; Chow et al. Citation2009), there was a high possibility that organic matter contributed significantly to visibility impairment during severe pollution episodes.
Figure 3. (a) Box and whisker plot of △babs (babs370 nm − babs880 nm) in different PM2.5 mass groups, and (b) at different ratios of OC to TC.
3.5. Potential source contribution areas of BC
) shows a wind-rose diagram of BC from 19 January to 18 March. The average wind velocity was 4.3 m s−1 and the frequency of the predominant wind direction (west, north, and northwest) was 49.4%. It is obvious that BC concentrations decreased from southeast to northwest. That is because high emissions were observed in regions south of Beijing (Zhang et al. Citation2013). Air pollutants including BC were carried into downwind areas, including Beijing, when southerly winds prevailed. In addition, Beijing is surrounded by mountains on three sides, which is favorable for trapping pollution when the southeast wind prevails. Hence, BC concentrations increased quickly when southeast winds blew accompanying the low wind speed.
Figure 4. (a) Wind-rose diagram of BC and (b) PSCF areas of BC from 19 January to 18 March 2017.
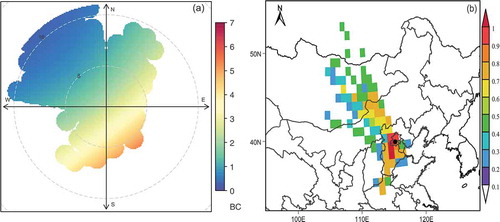
PSCF results for BC can present a clear visualization of the extent of its regional transport and local emissions. ) shows the PSCF maps for BC in winter in Beijing. Most areas of Beijing, as well as southern and a small part of northwestern areas of Hebei Province, were identified as major potential sources-areas of BC by the PSCF model. It suggested that local emissions and regional transport play an important role in BC loading. When stable meteorological conditions prevail, BC will be trapped in Beijing, and higher BC concentrations will build up. In addition, much industry is located in the southern areas of Beijing, and high coal consumption in these regions leads to high emissions of air pollutants. As a result, air pollutants including BC from southern areas of Beijing are carried into Beijing and result in increased BC concentrations when southerly wind prevails.
4. Conclusion
In this study, BC observations were made using a ten-wavelength BC monitor for the first time in Beijing. The characteristics and light-absorbing properties of locally measured BC were also analyzed.
More information on the BC measured at each wavelength was obtained by the ten-wavelength BC monitor, and significant correlation was found between the BC measured using the ten-wavelength BC monitor and other widely used BC instruments, suggesting the ten-wavelength BC monitor is reliable.
The mean BC concentration was lower than that reported in previous studies in Beijing, suggesting air-pollution control measures are gradually coming into effect. However, there is a large difference compared with the BC concentrations in developed countries, and so more effort is still required to improve local air quality.
BC concentrations decreased with an increase in wavelength, indicating the potential presence of highly absorbing compounds with a decrease in wavelength. Significant differences were found in △babs (babs370 nm − babs880 nm) with an increase in the concentration of PM2.5 and the ratio of OC to TC, because organic matter has strong light absorption in the near-ultraviolet wavelengths.
Southeasterly winds resulted in enhanced BC concentrations in Beijing, while northwesterly winds led to a decline in BC concentrations. Most areas of Beijing, as well as the southern and a small part of northwestern areas of Hebei Province, were identified as major potential sources-areas of BC during the study period, suggesting local emissions and regional transport play an important role in BC loading.
Acknowledgments
The authors would like to thank all the members of LAPC/CERN at the IAP, CAS, for maintaining the instruments used herein. We would also like to thank NOAA for providing the HYSPLIT and TrajStat models.
Disclosure statement
No potential conflict of interest was reported by the authors.
Supplementary material
Supplementary data can be accessed here
Additional information
Funding
References
- Andreae, M., and A. Gelencsér. 2006. “Black Carbon or Brown Carbon? The Nature of Light-Absorbing Carbonaceous Aerosols.” Atmospheric Chemistry and Physics 6: 3131–3148. doi:10.5194/acp-6-3131-2006.
- Chow, J. C., J. G. Watson, P. Doraiswamy, L.-W. A. Chen, D. A. Sodeman, D. H. Lowenthal, K. Park, W. P. Arnott, and N. Motallebi. 2009. “Aerosol Light Absorption, Black Carbon, and Elemental Carbon at the Fresno Supersite, California.” Atmospheric Research 93: 874–887. doi:10.1016/j.atmosres.2009.04.010.
- Ding, A. J., X. Huang, W. Nie, J. N. Sun, V. M. Kerminen, T. Petäjä, H. Su, et al. 2016. “Enhanced Haze Pollution by Black Carbon in Megacities in China”. Geophysical Research Letters 43: 2873–2879. doi:10.1002/2016GL067745.
- Hansen, A. D. A., V. N. Kapustin, V. M. Kopeikin, D. A. Gillette, and B. A. Bodhaine. 1993. “Optical Absorption by Aerosol Black Carbon and Dust in a Desert Region of Central Asia.” Atmospheric Environment 27A: 2527–2531. doi:10.1016/0960-1686(93)90025-T.
- IPCC. 2007. Climate Change 2007: The Physical Science Basis. Cambridge, UK: Cambridge University Press.
- Japar, S. M., W. W. Brachaczek, R. A. Gorse Jr, J. M. Norbeck, and W. R. Pierson. 1986. “The Contribution of Elemental Carbon to the Optical Properties of Rural Atmospheric Aerosols.” Atmospheric Environment 20:: 1281–1289. doi:10.1016/0004-6981(86)90163-0.
- Jeong, C.-H., P. K. Hopke, E. Kim, and D.-W. Lee. 2004. “The Comparison between Thermal-Optical Transmittance Elemental Carbon and Aethalometer Black Carbon Measured at Multiple Monitoring Sites.” Atmospheric Environment 38: 5193–5204. doi:10.1016/j.atmosenv.2004.02.065.
- Ji, D., L. Li, B. Pang, P. Xue, L. Wang, Y. Wu, H. Zhang, and Y. Wang. 2017. “Characterization of Black Carbon in an Urban-Rural Fringe Area of Beijing.” Environmental Pollution 223: 524–534. doi:10.1016/j.envpol.2017.01.055.
- Ji, D., J. Zhang, J. He, X. Wang, B. Pang, Z. Liu, L. Wang, and Y. Wang. 2016. “Characteristics of Atmospheric Organic and Elemental Carbon Aerosols in Urban Beijing, China.” Atmospheric Environment 125: 293–306. doi:10.1016/j.atmosenv.2015.11.020.
- Kirchstetter, T. W., T. Novakov, and P. V. Hobbs. 2004. “Evidence that the Spectral Dependence of Light Absorption by Aerosols Is Affected by Organic Carbon.” Journal of Geophysical Research: Atmospheres 109: D21208. doi:10.1029/2004JD004999.
- Lavanchy, V. M. H., H. W. Gäggeler, S. Nyeki, and U. Baltensperger. 1999. “Elemental Carbon (EC) and Black Carbon (BC) Measurements with a Thermal Method and an Aethalometer at the High-Alpine Research Station Jungfraujoch.” Atmospheric Environment 33: 2759–2769. doi:10.1016/S1352-2310(98)00328-8.
- Li, Y., X. Zhang, S. Gong, H. Che, D. Wang, W. Qu, and J. Un. 2006. “Comparison of EC and BC and Evaluation of Dust Aerosol Contribution to Light Absorption in Xi’an, China.” Environmental Monitoring and Assessment 120: 301–312. doi:10.1007/s10661-005-9062-z.
- Petzold, A., H. Kramer, and M. Schonlinner. 2002. “Continuous Measurement of Atmospheric Black Carbon Using a Multi-Angle Absorption Photometer.” Environmental Science and Pollution Research 4: 78–82.
- Ran, L., Z. Z. Deng, P. C. Wang, and X. A. Xia. 2016. “Black Carbon and Wavelength-Dependent Aerosol Absorption in the North China Plain Based on Two-Year Aethalometer Measurements.” Atmospheric Environment 142: 132–144. doi:10.1016/j.atmosenv.2016.07.014.
- Salako, G. O., P. K. Hopke, D. D. Cohen, B. A. Begum, S. K. Biswas, G. G. Pandit, Y. S. Chung, et al. 2012. “Exploring the Variation between EC and BC in a Variety of Locations”. Aerosol and Air Quality Research 12: 1–7. doi:10.4209/aaqr.2011.09.0150.
- Smith, K. R., M. Jerrett, H. R. Anderson, R. T. Burnett, V. Stone, R. Derwent, R. W. Atkinson et al. 2009. “Public Health Benefits of Strategies to Reduce Greenhouse-Gas Emissions: Health Implications of Short-Lived Greenhouse Pollutants.” Lancet 374:2091–2103.
- Song, S., Y. Wu, J. Xu, T. Ohara, S. Hasegawa, J. Li, L. Yang, and J. Hao. 2013. “Black Carbon at a Roadside Site in Beijing: Temporal Variations and Relationships with Carbon Monoxide and Particle Number Size Distribution.” Atmospheric Environment 77: 213–221.
- Wang, H., Y. Kang, Q. He, and Y. Chen. 2015. “Transport of Black Carbon Aerosols from Non-Local Sources: A Case Study in Shanghai.” Particuology 20: 89–93.
- Wang, Q., R. J. Huang, J. Cao, X. Tie, Z. Shen, S. Zhao, Y. Han, et al. 2016. “Contribution of Regional Transport to the Black Carbon Aerosol during Winter Haze Period in Beijing”. Atmospheric Environment 132: 11–18. doi:10.1016/j.atmosenv.2016.02.031.
- Wang, W., J. Yu, Y. Cui, J. He, P. Xue, W. Cao, H. Ying, et al. 2018b. “Characteristics of Fine Particulate Matter and Its Sources in an Industrialized Coastal City, Ningbo, Yangtze River Delta, China”. Atmospheric Research 203: 105–117. doi:10.1016/j.atmosres.2017.11.033.
- Wang, X., J. P. Huang, R. D. Zhang, B. Chen, and J. R. Bi. 2010. “Surface Measurements of Aerosol Properties over Northwest China during ARM China 2008 Deployment.” Journal of Geophysical Research 115: D00K27. doi:doi:10.1029/2009JD013467.
- Wang, X., H. Wen, J. Shi, J. Bi, Z. Huang, B. Zhang, T. Zhou, K. Fu, Q. Chen, and J. Xin. 2018a. “Optical and Microphysical Properties of Natural Mineral Dust and Anthropogenic Soil Dust near Dust Source Regions over Northwestern China..” Atmospheric Chemistry and Physics 18: 2119–2138. doi:10.5194/acp-18-2119-2018.
- Wu, Y., R. Zhang, Y. Pu, L. Zhang, K. F. Ho, and C. Fu. 2012. “Aerosol Optical Properties Observed at a Semi-Arid Rural Site in Northeastern China.” Aerosol and Air Quality Research 12: 503–504. doi:10.4209/aaqr.2011.11.0202.
- Zhang, A., Q. Qi, L. Jiang, F. Zhou, and J. Wang. 2013. “Population Exposure to PM2.5 In the Urban Area of Beijing.” PLOS One 8: e63486. doi:10.1371/journal.pone.0063486.
- Zhou, J., R. Zhang, J. Cao, J. C. Chow, and J. G. Watson. 2012. “Carbonaceous and Ionic Components of Atmospheric Fine Particles in Beijing and Their Impact on Atmospheric Visibility.” Aerosol and Air Quality Research 12: 492–502.