
 ?Mathematical formulae have been encoded as MathML and are displayed in this HTML version using MathJax in order to improve their display. Uncheck the box to turn MathJax off. This feature requires Javascript. Click on a formula to zoom.
ABSTRACT
The temporal and spatial characteristics of winter snowfall in the Yangtze–Huaihe River Basin (YHRB) of China and its possible connection with Scandinavian Atmospheric Teleconnection Pattern (SCAND) anomalies are explored based on daily meteorological data contained in the Daily Surface Climate Dataset for China (V3.0) during the period 1960–2012. Results show that winter snowfall in the YHRB exhibits consistent anomalies over the whole region for the interannual variation during 1960–2012. Further analysis suggests that winter snowfall anomalies in the YHRB are closely linked to the anomalous wintertime SCAND activity. When there is more winter snowfall in the YHRB, SCAND is usually in a positive phase, accompanied by a strengthened Urals blocking high and East Asian trough, which is conducive to strengthened cold-air activity, intensified vertical motions, and more water vapor transport in the YHRB. In contrast, less winter snowfall in the YHRB usually happens in the negative phase of SCAND. Our results provide useful information to better understand the relevant mechanism responsible for anomalous winter snowfall in this area.
Graphical Abstract
摘要
利用中国地面气候资料日值数据集(V3.0)逐日气象资料研究了我国江淮冬季降雪的时空变化及其与斯堪的纳维亚遥相关型(SCAND)的可能联系。结果表明:江淮冬季降雪表现出空间一致的年际变化,SCAND与江淮地区冬季降雪异常关系密切。江淮冬季降雪偏多通常对于SCAND正位相,500hPa阻塞高压、东亚大槽加强,有利于冷空气活动增强,江淮地区垂直运动增强,水汽输送增强;降雪偏少则对应SCAND负位相。研究结果有助于深入理解江淮冬季降雪异常的相关机理。
1. Introduction
With global warming, the frequency and intensity of extremes and extreme events have changed greatly in recent years. Long-duration and heavy snowfall generally produces serious impacts on traffic, power, agriculture, and human safety (Zhang et al. Citation2015; Zhang, Cong, and Ni Citation2016; Chen et al. Citation2016). For example, in early 2008, a low-temperature, rainy, snowy, and freezing weather event persisted over a long time in a large area of South China, which resulted in a direct economic loss of over 150 billion Chinese Yuan and affected more than 100 million people across the country (Ding et al. Citation2008; Wang et al. Citation2008a, Citation2008b). As such, anomalous snowfall events and related mechanisms have been widely studied (Sun et al. Citation2010a, Citation2010b).
Studies show that anomalous large-scale circulation provides important backgrounds for snowfall in China. For example, the anomalous activity of the uupper- and lower-level jet streams was found to be closely related to winter snowfall (Hu and Zhou Citation2005; Chen, Wang, and Wang Citation2001; Zhao et al. Citation2011; Li et al. Citation2012). Both the intensity and the location of the jet streams play vital roles in the occurrence of winter snowfall in China. Generally, upper-level jet streams provide dynamic instability conditions for heavy snowfall, while lower-level jet streams afford water vapor and convective instability conditions. In addition, blocking highs are closely related to snowfall by modulating the activity of winter cold air. More recently, Wang and He (Citation2012, Citation2013) suggested that the interdecadal increase in winter snowfall in Northeast China around the mid-1980s was closely related to the interdecadal weakening of the East Asian winter monsoon. Zhou, Wang, and Shi (Citation2017) found that an interdecadal increase in snowfall in Northeast China was related to a strengthened Hadley cell. Wang and Zhou (Citation2018) suggested that the Arctic Oscillation and North Atlantic Oscillation are closely related to heavy snowfall in North China.
Meanwhile, the roles of external forcing on snowfall have also been explored. For example, Feng and Chen (Citation2016) found that warm sea surface temperatures in the North Pacific Ocean in both fall and winter can result in anticyclonic circulation anomalies over East Asia and the North Pacific Ocean, which are conducive to the transport of water vapor from south to north, thereby intensifying snowfall events in Northeast China. Arctic sea ice also has an important impact on winter low-temperatures and heavy snowy weather in the Northern Hemisphere (Ghatak et al. Citation2010; Liu et al. Citation2012).
Notably, studies have paid the most attention to the evolution and possible causes of snowfall formation and heavy snowfall events in North China (Wang, Qian, and Zheng Citation2004; Zhao et al. Citation2009). Accompanied by global warming, the Huang–Huai region has experienced the most significant increase in heavy snowfall events (Liu et al. Citation2013). Meanwhile, heavy snowfall over the middle and lower reaches of the Yangtze River accounts for 50% of the annual snowfall amount (Zhang, Cong, and Ni Citation2016). Several case studies have demonstrated the vital role of the southern branch trough and temperature advection in the formation of snowfall in South China (Zhang, Xuan, and Peng Citation2008; Long et al. Citation2010). Chang, Zhang, and Peng (Citation2008) noted that sea surface temperature anomalies in the midlatitude North Atlantic Ocean, the equatorial Indian Ocean, and the South China Seas can affect winter snowfall in South China. By contrast, studies on snowfall in South China are relatively limited (Yang et al. Citation2006; Long et al. Citation2010).
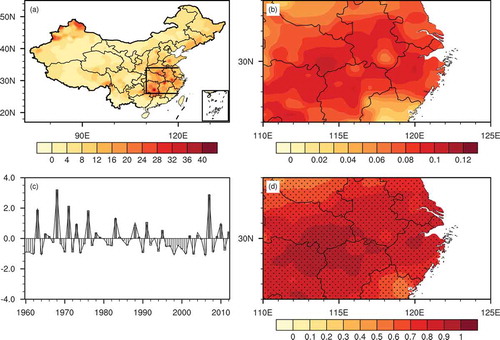
shows the spatial distribution of the mean square deviation (MSD) of wintertime snowfall across China. Notably, large MSD of winter snowfall mainly appears in northern Xinjiang, the Huang–Huai region, and the middle and lower reaches of the Yangtze River. Generally, the MSDs of winter snowfall in South China are larger than those for most areas of North China, indicating a greater interannual variability of winter snowfall in South China.
Figure 1. (a) Spatial distribution of the mean square deviation of winter snowfall (units: mm). (b) Spatial distribution and (c) time series of the first EOF leading mode of wintertime snowfall in the YHRB (lines) and the normalized regional average snowfall and winter snowfall (bars). (d) Correlation coefficient between the normalized regional average snowfall and winter snowfall (dotted areas indicate statistically significance at the 0.05 level).
The present study focuses on winter snowfall in South China. The Yangtze–Huaihe River Basin (YHRB; 26°–34°N, 110°–122°E), which covers eight provinces—Jiangsu, Anhui, Henan, Hubei, Hunan, Jiangxi, Fujian, and Zhejiang—was selected as the key study area. The temporal and spatial characteristics of winter snowfall in the YHRB, as well as its associated general circulation pattern, are investigated, and diagnostic analysis is performed to better understand the possible mechanism responsible for anomalous winter snowfall in this region.
2. Data and methods
Daily meteorological data (including daily air temperature, relative humidity, precipitation and locations of the stations) at 824 stations were taken from the Daily Surface Climate Dataset for China (V3.0) provided by the China Meteorological Administration. A total of 150 meteorological stations in the YHRB (26°–34°N, 110°–122°E) were selected in the current study. Monthly atmospheric variables were acquired from the NCEP–NCAR reanalysis datasets. The time period was 1960–2013.
The dual-threshold method proposed by Ding et al. (Citation2014) for differentiating precipitation types was used in this study. The precipitation type is determined by calculating and comparing the daily average wet-bulb temperature and a critical temperature (an empirical function of altitude, relative humidity, and average air pressure). On that basis, rain, sleet, and snow are distinguished from one another. Statistical methods including correlation analysis, empirical orthogonal function (EOF) decomposition, regression analysis, and composite analysis were used in this study, and the t-test was used to examine the statistical significance of results.
3. Basic characteristics of wintertime snowfall in the YHRB
shows the spatial pattern of the leading EOF mode (EOF1) of winter snowfall in the YHRB, which accounts for 50.6% of the total variance of winter snowfall. The spatial mode displays regionally consistent changes in snowfall. shows the interannual variation in the time series of the EOF1 of winter snowfall and the normalized regional average snowfall in the YHRB. The changes in the time series of EOF1 are basically consistent with those in the normalized regional average snowfall and the correlation coefficient between them is 0.99. Since the first leading mode exhibits high spatial consistency, the normalized time series of the regional average winter snowfall was selected to characterize the variation in winter snowfall over this region. shows the spatial distribution of the correlation coefficients between the time series of the normalized regional average snowfall and winter snowfall. A regionally consistent significant positive correlation can be observed, which suggests that the time series of the normalized regional average snowfall can satisfactorily characterize the variation in the regional snowfall over this area.
4. Connection between winter snowfall in the YHRB and the scandinavian atmospheric teleconnection pattern
To understand the possible causes of winter snowfall anomalies in the YHRB, we calculated the 500 hPa geopotential height anomalies regressed onto the time series of the normalized regional average winter snowfall (). There is a positive center over the Scandinavian Peninsula, and negative anomalies occur over the Northeast Atlantic Ocean and Siberia. These three anomalous activity centers together form a circulation pattern similar to a positive-phase Scandinavian Circulation Pattern (SCAND). For composite analysis, seven years with relatively high snowfall (1963, 1968, 1971, 1976, 1983, 1988, and 2007) and seven years with relatively low snowfall (1962, 1964, 1998, 2001, 2003, 2006, and 2010) were selected based on the time series of the interannual changes in wintertime snowfall by using ±1 standard deviation as the criterion. shows difference in the 500 hPa geopotential height anomaly (high snowfall minus low snowfall years), which suggest that the spatial pattern of anomalous circulation is consistent with . Generally, in high (low) snowfall years, the general circulation pattern is similar to a positive phase (negative phase) of SCAND, which is favorable (unfavorable) for cold-air activity and the occurrence of winter snowfall.
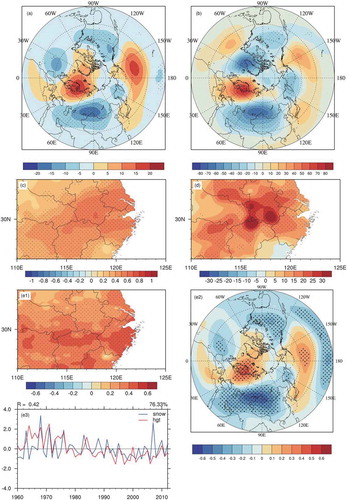
Figure 2. (a) Regression of winter 500 hPa geopotential height anomalies onto the time series of the normalized regional average winter snowfall in in the YHRB. (b) Difference in winter 500 hPa geopotential height anomalies (units: gpm) between high and low winter snowfall years. (c) Geographic distribution of the correlation coefficients between wintertime snowfall and SCANDI. (d) Difference in winter snowfall (units: mm) between positive and negative SCANDI years. (e) First coupled mode from SVD analysis of winter snowfall and 500 hPa geopotential height (the ratio of covariance to total covariance is 76.33%): (e1) heterogeneous correlation for winter snowfall; (e2) heterogeneous correlation for 500 hPa geopotential height; and (e3) time series (blue line for snowfall and red line for geopotential height; the correlation coefficient between them is 0.42; dotted areas are statistically significant at the 0.1 level).
According to Liu and Wang (Citation2014), the Scandinavian Teleconnection Index (SCANDI) can be calculated using the 500 hPa geopotential height over three activity centers – the Scandinavian Peninsula (60°–70°N, 25°–50°E), Western Europe (40°–55°N, 20°W–10°E), and Siberia (45°–60°N, 80°–105°E):
where Z is the 500 hPa geopotential height and Nor(X) represents the normalization of X. The correlation coefficient between the SCANDI calculated using the above formula and the wintertime SCANDI provided by NOAA’s Climate Prediction Center (CPC) is 0.86 (statistically significant at the 0.001 level). The correlation coefficient between the spatial distribution patterns of the regressed 500hPa geopotential heights onto the SCANDI calculated using the above equation and the wintertime SCANDI provided by the CPC is 0.96 (statistically significant at the 0.001 level).
To further verify the relationship between snowfall in the YHRB and the SCAND-like circulation pattern, we calculated the correlation between SCANDI and winter snowfall in the YHRB. shows the geographic distribution of the correlation between wintertime SCANDI and winter snowfall anomalies in the YHRB. There is a significant positive correlation between SCANDI and winter snowfall in the YHRB (significant at the 0.05 level), which implies there is relatively high (low) wintertime snowfall in the YHRB during a positive (negative) SCAND phase. Seven years with a positive SCANDI phase (1968, 1971, 1984, 2000, 2005, 2009, and 2012) and 11 years with a negative SCANDI phase (1962, 1967, 1975, 1982, 1985, 1988, 1996, 1998, 1999, 2001, and 2006) were selected based on the time series of winter SCANDI by using ±1 standard deviation as the criterion. shows the difference in winter snowfall in the YHRB between positive and negative SCANDI years. As given in , much more winter snowfall in most regions of the YHRB appears in positive SCANDI years than in negative SCANDI years. The first coupled mode from singular value decomposition (SVD) analysis of winter snowfall and 500 hPa geopotential height also shows consistent results ().
In summary, winter snowfall anomalies in the YHRB are closely associated with the alteration between positive and negative SCAND phases. A positive (negative) SCAND phase mainly strengthens (weakens) cold-air activity, thereby increasing (decreasing) winter snowfall in the YHRB. Therefore, it is necessary to pay much more attention to the anomalous activity of SCAND for monitoring and predicting winter snowfall in the YHRB.
5. Possible mechanism of the effect of SCAND on winter snowfall in the YHRB
Snowfall is usually accompanied by unstable atmospheric conditions, convergence of water vapor, and favorable lifting conditions. Therefore, how does the SCAND teleconnection pattern affect winter snowfall in the YHRB? Here, physical variables affecting snowfall are analyzed by composite analysis based on typical positive and negative SCANDI years as discussed in section 4.
It is noted that the climatological water vapor transport is mainly delivered by southwesterly flow from the Bay of Bengal and northwesterly flow from the mid–high latitudes of Asia (figure not shown). and show the anomalous water vapor transport affected by the anomalous activity of the SCAND teleconnection pattern. During positive SCANDI years (), intensified water vapor transport over the YHRB mainly originates from two sources: the Bay of Bengal and the tropical western Pacific. In addition, water vapor converges over most areas of the YHRB in positive SCANDI years, providing favorable water vapor conditions for the occurrence of snowfall. However, during negative SCANDI years (), water vapor transport anomalies originate mainly from northeastward water vapor transport, and water vapor transport from the tropical ocean surface is negligible. Generally, water vapor diverges over most areas of the YHRB, which is unfavorable for the formation of snowfall.
Figure 3. (a, b) 1000–700 hPa water vapor transport flux anomalies (vectors; units: kg m−1 s−1) and water vapor flux divergence anomalies (shaded; kg m−2 s−1) for (a) positive and (b) negative SCANDI years. (c, d) 500 hPa vertical velocity anomaly (Pa s−1) for (c) positive and (c) negative SCANDI years. (e, f) 1000–500 hPa thickness (units: gpm) for (e) positive and (f) negative SCANDI years (dotted areas are statistically significant at the 0.1 level).
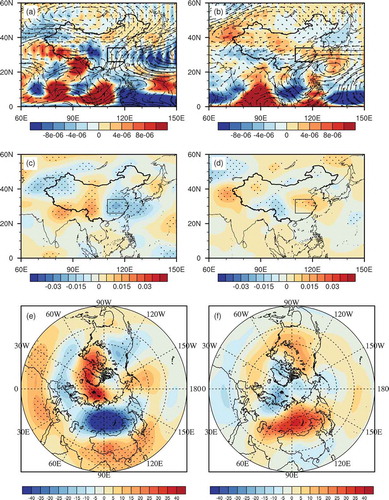
Vertical motion usually provides atmospheric dynamic conditions for winter snowfall events. As shown in , there are significant negative anomalies of 500 hPa vertical velocity over the YHRB during positive SCANDI years, i.e., evident ascending motion, which provides favorable dynamic conditions for the formation of snowfall, corresponding to more winter snowfall in the region. In contrast, weak vertical motion tends to depress the formation of snowfall () during negative SCANDI years.
To investigate the temperature conditions responsible for anomalous snowfall, we explored the 1000–700 hPa thickness anomalies associated with the SCAND teleconnection pattern. During positive SCANDI years (), a strengthening of the high-pressure ridge over the Scandinavian Peninsula and the area to its east causes the polar vortex to extend towards Lake Balkhash and Lake Baikal, resulting in continuous transport of cold air to that region (Bueh, Shi, and Ji Citation2008). Consequently, a cold anomaly center forms over Lake Baikal. The intensified cold-air activity from the north provides favorable temperature conditions for winter snowfall in the YHRB, and vice versa during negative SCANDI years (). There is a warm anomaly center near Lake Baikal, and the cold-air activity is weakened, which is unfavorable for the occurrence of winter snowfall over this region.
6. Conclusions
This study investigated the temporal and spatial changes in winter snowfall in the YHRB of China. It was found that winter snowfall in the YHRB exhibits regionally consistent interannual variation during 1960–2012. Further analysis suggested that winter snowfall anomalies in the YHRB are closely linked to anomalous wintertime SCAND activity. When there is more winter snowfall in the YHRB, the SCAND pattern is usually in a positive phase, accompanied by a strengthened Urals blocking high and East Asian trough, which is conducive to strengthened cold-air activity, intensified vertical motions, and more water vapor transport in the YHRB. In contrast, less winter snowfall in the YHRB usually happens in a negative phase of the SCAND pattern.
This study focused only on analyzing the possible impact of anomalous atmospheric circulation on winter snowfall in the YHRB through anomalous water vapor, cold air, and vertical motion. Further investigation is needed to explore the possible linkages between the SCAND teleconnection pattern and atmospheric external forcing (e.g., sea surface temperature) in previous seasons and the possible impact on winter snowfall in the YHRB. This will be helpful to better understand the relevant mechanism responsible for anomalous winter snowfall in this area, and provide a useful signal for the seasonal prediction of snowfall. In addition, the anomalies of atmospheric circulation, sea surface temperature, and Arctic sea ice prior to winter snowfall anomalies also deserve attention, as this might be an important aspect for predicting winter snowfall anomalies.
Disclosure statement
No potential conflict of interest was reported by the authors.
Additional information
Funding
References
- Bueh, C., N. Shi, and L. R. Ji. 2008. “Maintenance Mechanism of the Scandinavian Pattern in Its Positive Phase during 2000/2001 Winter and Its Influence on the Weather over the Northern Part of China.” Plateau Meteorology 27 (1): 76−83. in Chinese.
- Chang, R., Q. Y. Zhang, and J. B. Peng. 2008. “Response of the Atmospheric Circulation with Heavy Snow over Southern China to the Sea Surface Temperature Anomaly in the Key Areas.” Climatic and Environmental Research 13 (4): 468–477. ( in Chinese). doi:10.3878/j.issn.1006-9585.2008.04.11.
- Chen, J. Y., Y. H. Wang, and W. Wang. 2001. “The Influence of Sudden Change of Ural Blocking High on Heavy Rainstorm Processes in the Middle-Lower Reaches of Yangtze River in June-July of 1998 and 1999.” Plateau Meteorology 20 (4): 388–394. ( in Chinese). doi:10.3321/j.issn:1000-0534.2001.04.007.
- Chen, K. Q., Y. H. Fang, R. Zhang, X. Y. Zhu, L. W. Zhao, H. N. Zhang, and Q. Wu. 2016. “Variation Characteristics of Heavy Snow Frequency in North China and Its Response to Sea Surface Temperature.” Chinese Agricultural Science Bulletin 32 (02): 149–154. ( in Chinese). doi:10.11924/j.issn.1000-6850.casb15040110.
- Ding, B. H., K. Yang, J. Qin, L. Wang, Y. Y. Chen, and X. B. He. 2014. “The Dependence of Precipitation Types on Surface Elevation and Meteorological Conditions and Its Parameterization.” Journal of Hydrology 513 (11): 154–163. doi:10.1016/j.jhydrol.2014.03.038.
- Ding, Y. H., Z. Y. Wang, Y. F. Song, and J. Zhang. 2008. “Causes of the Unprecedented Freezing Disaster in January 2008 and Its Possible Association with the Global Warming.” Acta Meteorologica Sinica 66 (5): 808–825. ( in Chinese). doi:10.3321/j.issn:0577-6619.2008.05.014.
- Feng, Y., and H. P. Chen. 2016. “Warming over the North Pacific Can Intensify Snow Events in Northeast China.” Atmospheric and Oceanic Science Letters 9 (2): 122–128. doi:10.1080/16742834.2016.1133072.
- Ghatak, D., A. Frei, G. Gong, J. Stroeve, and D. Robinson. 2010. “On the Emergence of an Arctic Amplification Signal in Terrestrial Arctic Snow Extent.” Journal of Geophysical Research 115: D24105:1–D24105:8. doi:10.1029/2010JD014007.
- Hu, Z. M., and W. C. Zhou. 2005. “Case Study on the Genesis of a Snowstorm over the Northeast Region in China.” Journal of Nanjing Institute of Meteorology 28 (5): 679–684. ( in Chinese). doi:10.13878/j.cnki.dqkxxb.2005.05.015.
- Li, Y., S. G. Wang, R. H. Jin, J. Y. Wang, and J. P. Li. 2012. “Abnormal Characteristics of Blocking High during Durative Low Temperature, Snowfall and Freezing Weather in Southern China.” Plateau Meteorology 31 (1): 94–101. in Chinese.
- Liu, J. P., J. A. Curry, H. J. Wang, M. R. Song, and R. M. Horton. 2012. “Impact of Declining Arctic Sea Ice on Winter Snowfall.” Proceedings of the National Academy of Sciences of the United States of America 109 (11): 4074–4079. doi:10.1073/pnas.1114910109.
- Liu, Y. L., G. Y. Ren, H. M. Yu, and H. Y. Kang. 2013. “Climatic Characteristics of Intense Snowfall in China with Its Variation.” Journal of Applied Meteorological Science 24 (3): 304–313. ( in Chinese). doi:10.3969/j.issn.1001-7313.2013.03.006.
- Liu, Y. Y., and L. Wang. 2014. “Interdecadal Changes of Scandinavian Teleconnection Pattern in the Late 1970s.” Climatic and Environmental Research 19 (3): 371−382. ( in Chinese). doi:10.3878/j.issn.1006-9585.2013.13052.
- Long, L. M., Z. Y. Huang, L. Su, S. S. Wang, H. Deng, and Q. Han. 2010. “Temperature Advection Structure of Low-Temperature Process with Freezing Rain and Snow in Hubei Province in 2008.” Transactions of Atmospheric Sciences 33 (6): 745–750. ( in Chinese). doi:10.3969/j.issn.1674-7097.2010.06.014.
- Sun, J. Q., H. J. Wang, W. Yuan, and H. P. Chen. 2010a. “Spatial-Temporal Features of Intense Snowfall Events in China and Their Possible Change.” Journal of Geophysical Research 115: D16110. doi:10.1029/2009JD013541.
- Sun, X. Z., Y. Luo, X. Zhang, and Y. X. Gao. 2010b. “Analysis on Snowfall Change Characteristic of China in Recent 46 Years.” Plateau Meteorology 29 (6): 1594–1601. in Chinese.
- Wang, H. J., and S. P. He. 2012. “Weakening Relationship between East Asian Winter Monsoon and ENSO after Mid-1970s.” Chinese Science Bulletin 57 (19): 1713–1718. ( in Chinese). doi:10.1007/s11434-012-5285-x.
- Wang, H. J., and S. P. He. 2013. “The Increase of Snowfall in Northeast China after the Mid-1980s.” Chinese Science Bulletin 58 (12): 1350–1354. doi:10.1007/s11434-012-5508-1.
- Wang, L., G. Gao, Q. Zhang, J. M. Sun, Z. Y. Wang, Y. Zhang, S. S. Zhao, et al. 2008a. “Analysis of the Severe Cold Surge, Ice-Snow and Frozen Disasters in South China during January 2008: I. Climatic Features and Its Impact.” Meteorological Monthly 34 (4): 95–100. ( in Chinese). doi:10.7519/j.issn.1000-0526.2008.4.012.
- Wang, Y. C., T. T. Qian, and Y. G. Zheng. 2004. “Primary Analysis of the Longest-Lasting Snowfall in Beijing.” Journal of Applied Meteorological Science 15 (1): 58–65. ( in Chinese). doi:10.3969/j.issn.1001-7313.2004.01.007.
- Wang, Z. Y., Q. Zhang, Y. Chen, S. S. Zhao, H. L. Zeng, Y. Zhang, and Q. F. Liu. 2008b. “Characters of Meteorological Disasters Caused by the Extreme Synoptic Process in Early 2008 over China.” Advances in Climate Change Research 4 (2): 63–67. ( in Chinese). doi:10.3969/j.issn.1673-1719.2008.02.001.
- Wang, Z. Y., and B. T. Zhou. 2018. “Large-Scale Atmospheric Circulations and Water Vapor Transport Influencing Interannual Variations of Intense Snowfalls in Northern China.” Chinese Journal of Geophysics 61 (07): 2654–2666. ( in Chinese). doi:10.6038/cjg2018L0405.
- Yang, L., C. S. Miao, S. W. Shou, and Z. J. Li. 2006. “Numerical Simulation on a Snowstorm in Changjiang-Huaihe River Basin in Spring 2003.” Journal of Nanjing Institute of Meteorology 29 (3): 379–384. ( in Chinese). doi:10.3969/j.issn.1674-7097.2006.03.014.
- Zhang, D. W., Z. T. Cong, and G. H. Ni. 2016. “Snowfall Changes in China during 1956-2010.” Journal of Tsinghua University (Science&Technology) 56: 381–386. ( in Chinese). doi:10.16511/j.cnki.qhdxxb.2016.24.007.
- Zhang, Q. Y., S. L. Xuan, and J. B. Peng. 2008. “Relationship between Asian Circulation in the Middle-High Latitude and Snowfall over South China during La Niña Events.” Climatic and Environmental Research 13 (4): 385–394. in Chinese.
- Zhang, Z. F., S. Xi, N. Liu, Y. Yu, S. H. Fan, and M. N. Feng. 2015. “Snowfall Change Characteristics in China from 1961 to 2012.” Resources Science 37 (9): 1765–1773. ( in Chinese).
- Zhao, C. Y., J. Wang, X. Y. Yan, Y. Wang, and Y. Luo. 2009. “Climatic Characteristics and Regionalization of Winter Snowfall in Northeast China.” Journal of Natural Disasters 18 (05): 29–35. ( in Chinese). doi:10.3969/j.issn.1004-4574.2009.05.005.
- Zhao, G. X., L. Du, W. D. Fan, and S. F. Wang. 2011. “Characteristic of a Snowstorm Process with Strong Cold Front and Inverted Trough and Its Formation Analysis.” Plateau Meteorology 30 (6): 1516–1525. in Chinese.
- Zhou, B. T., Z. Y. Wang, and Y. Shi. 2017. “Possible Role of Hadley Circulation Strengthening in Interdecadal Intensification of Snowfalls over Northeastern China under Climate Change.” Journal of Geophysical Research 122: 11638–11650. doi:10.1002/2017JD027574.