
 ?Mathematical formulae have been encoded as MathML and are displayed in this HTML version using MathJax in order to improve their display. Uncheck the box to turn MathJax off. This feature requires Javascript. Click on a formula to zoom.
ABSTRACT
Using 132-member experiments based on a linear baroclinic atmospheric model (LBM), this study investigates the optimal heat source forcing the interannual variability of the western North Pacific summer monsoon (WNPSM). The 132 members are forced by localized atmospheric heat sources distributed homogeneously over regions from 55°S to 55°N, each 10° latitude × 30° longitude in size. The atmospheric responses to all the heating constitute an ensemble to examine the relative contribution of each local heat source to the strength of the WNPSM. The result indicates that the combination of an atmospheric heating (cooling) source over the subtropical Northwest Pacific and a cooling (heating) source over the tropical Indian Ocean and the midlatitudes from China to the southern part of Japan is the pattern most effective at enhancing (weakening) the WNPSM. Besides, the optimal heat source pattern identified by the LBM simulations is similar to the observed atmospheric heating anomalies associated with WNPSM interannual variability. The results suggest that any external forcing that leads to a similar heating structure as the optimal thermal forcing pattern could lead to an anomalous WNPSM.
Graphical Abstract
摘要
西北太平洋夏季风是热带影响东亚气候的桥梁, 具有很强的年际变率。西北太平洋夏季风异常能造成东亚夏季旱涝和高低温灾害,因此研究它的年际变率驱动因子具有重要意义。本文利用一个格林函数方法定量的评估了热带各个格点热源对西北太平洋夏季风的贡献。具体为将南北55纬度之间的区域划分成132个小格子,在每个格子加上一个椭圆形理想热源;接着利用一个线性理论大气环流模式计算每个热源对西北太平洋夏季风的贡献。研究表明导致西北太平洋夏季风增强的最理想加热场结构是位于热带印度洋和中纬度东亚地区上空的冷源和位于副热带西北太平洋地区的热源。
关键词:
1. Introduction
The western North Pacific summer monsoon (WNPSM) is an important subcomponent of the Asian summer monsoon system (Tanaka Citation1997; Wu and Wang Citation2000; Wang, Wu, and Lau Citation2001). Climatologically, the WNPSM first develops in the South China Sea and the Philippines around mid-May, then extends to the southwestern Philippine Sea in early to mid-June, and reaches the northeastern part of the western North Pacific (WNP) after mid-July (Wu and Wang Citation2000). Like the South Asian and East Asian summer monsoon, the WNPSM displays pronounced interannual variability (Wang, Wu, and Lau Citation2001). The dominant atmospheric circulation mode of WNPSM interannual variability features as a low-level anomalous cyclone/anticyclone over the WNP (Wang, Wu, and Lau Citation2001). In strong (weak) WNPSM years, there are low-level cyclonic (anticyclonic) anomalies and enhanced (suppressed) convective activities over the WNP. Since convective activities over the WNP are able to excite Rossby wave trains that can propagate to the high latitudes (Nitta Citation1987; Huang and Wu Citation1989), the WNPSM interannual variability could lead to pronounced climate impacts on East Asia (Wang, Wu, and Lau Citation2001; Wang et al. Citation2008). When the WNPSM is suppressed (enhanced), the rainfall associated with the mei-yu/baiu front tends to be above (below) normal. Thus, understanding the WNPSM interannual variability has become a hot topic in recent decades.
Many studies show that the WNPSM is closely linked to El Niño–Southern Oscillation (ENSO) (Fu and Ye Citation1988; Zhang, Sumi, and Kimoto Citation1996; Wu and Wang Citation2000; Wang, Wu, and Lau Citation2001). In the summer following El Niño, there is prominent sea surface temperature (SST) warming in the tropical Indian Ocean and the Atlantic, and slight cooling in parts of the WNP (Klein, Soden, and Lau Citation1999; Xiang et al. Citation2013; Jiang et al. Citation2017). The warming in the tropical Indian Ocean and the Atlantic can induce Ekman divergence in the subtropical WNP that suppresses convection via exciting a warm tropospheric Kelvin wave (Yang et al. Citation2007; Xie et al. Citation2009; Huang, Hu, and Xie Citation2010; Rong, Zhang, and Li Citation2010; Xie and Zhou Citation2017), while the WNP cooling can lead to an anomalous anticyclone by suppressing local convection (Wang, Wu, and Li Citation2003; Fan et al. Citation2013; Xiang et al. Citation2013). Therefore, the WNPSM tends to be weakened during post-El Niño summers. It is known that SST affects the WNPSM mainly by altering atmospheric convective activities. However, the response of atmospheric convection to SST changes over time due to the evolution of the convection threshold (Johnson and Xie Citation2010), which may result in a varying relationship between SST and the WNPSM. For example, He, Zhou, and Li (Citation2019) suggested that the weakened response of atmospheric convection to tropical Indian Ocean SST could weaken the relationship between WNPSM and ENSO under global warming.
Compared with SST, the atmospheric heat source can directly affect atmospheric circulation. Previous studies have revealed that atmospheric heat sources over the WNP (Wang, Wu, and Lau Citation2001) and the tropical Indian Ocean (Xie et al. Citation2009) are important in forming the circulation pattern associated with the WNPSM interannual variability. But is there any other heat source that can also significantly affect the WNPSM? If so, what are the relative contributions of different heat sources to the WNPSM interannual variability? Answering these questions can help us understand how the WNPSM interannual variability forms.
It is hard to identify the relative contribution of each localized heat source via observed data. Branstator (Citation1985) proved that a general solution to the response of a linear system to external forcing is simply the integrals of results from the Green’s function weighted by the forcing distribution. So, if the nonlinear processes are not considered, the responses to each localized forcing are independent of one another, and the ratio between the response to each local forcing and the total response can measure the relative contribution of each forcing. This is called the Green’s function approach, which is useful for identifying the optimal forcing or to test the relative contribution of each forcing to a linear system (Watanabe Citation2004; Hirota and Takahashi Citation2012).
This study aims to address the above questions. Using a method similar to the Green’s function approach, we test the relative contribution of each heating source from 55°S to 55°N to the WNPSM interannual variability. Moreover, we find the heat source pattern that is the most efficient in affecting the WNPSM.
2. Data and method
The circulation and precipitation datasets used in this paper are as follows. The winds, geopotential height, and air temperature are from the National Centers for Environmental Prediction-Department of Energy (NCEP-DOE) atmospheric reanalysis (https://www.esrl.noaa.gov/psd/data/gridded/data.ncep.reanalysis2.html), with a resolution of 2.5° latitude × 2.5° longitude from 1979 to present (Kanamitsu et al. Citation2002). For precipitation, we use the Global Precipitation Climatology Project (GPCP; https://www.esrl.noaa.gov/psd/data/gridded/data.gpcp.html) monthly precipitation dataset, available from 1979, which combines gauge observations and satellite precipitation data into a 2.5° latitude × 2.5° longitude global grid (Adler et al. Citation2003).
To denote the interannual variations of the WNPSM, we calculate the dynamic WNPSM index (Wang, Wu, and Lau Citation2001) as the difference in JJA (June–August)-mean 850-hPa zonal wind between a southern region (5°–15°N, 100°–130°E) and a northern region (20°–30°N, 110°–140°E). This monsoon index is widely used to measure the strength of the WNP summer monsoon and East Asian summer monsoon (Wang et al. Citation2008).
Following the study of Yanai, Esbensen, and Chu (Citation1973), we use the atmospheric apparent heat source (Q1) to represent the heating in the atmosphere following the below equation:
where s is the dry static energy (), V is the horizontal wind,
is the vertical velocity, P is the pressure, T is the air temperature, and z is the geopotential height. The
consists of the heating due to radiation, the release of latent heat by net condensation, and vertical convergence of the vertical eddy transport of sensible heat, which is calculated based on daily NCEP-DOE atmospheric reanalysis data.
The dry linear baroclinic model (LBM) used in this study consists of primitive equations linearized about the observed JJA basic state. The model has a horizontal resolution of T42 and 20 vertical levels. The horizontal diffusion has a damping time scale of six hours for the smallest wave, and the Rayleigh friction and Newtonian damping have a time scale of 1 d−1 for sigma levels below 0.9, 5 d−1 for the sigma level of 0.89, 15 d−1 for the sigma level of 0.83, 30 d−1 for sigma levels between 0.83 and 0.03, and 1 d−1 for sigma levels above 0.03. The diffusion and damping coefficients are the default values in the LBM. Details of the model formulation are given in Watanabe and Kimoto (Citation2000). To obtain the steady atmospheric response to a given heating, the model is integrated for 50 days, and the averages of 30–50 days are used. In this study, we only use the default value of the damping and diffusion coefficient in the LBM. It should be noted that the simulated result may change in some respects when using different coefficients (Zhu and Li Citation2016, Citation2018; Wang et al. Citation2019) .
3. Results
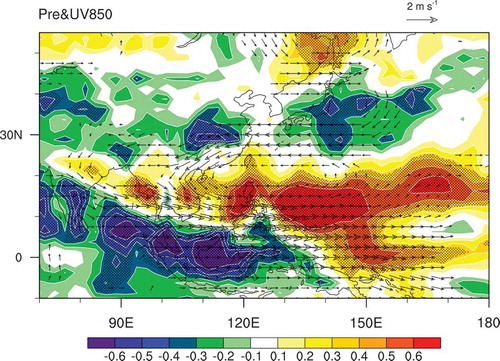
shows the regression of JJA-mean winds at 850 hPa onto the WNPSM index from 1979 to 2016. The low-level circulation mainly features prominent cyclonic anomalies from the northern part of the Indian Ocean to the subtropical Northwest Pacific. To the north of the anomalous cyclone, there is an anticyclonic anomaly over Japan and a cyclonic anomaly over the Far East. The circulation pattern is similar to the East Asia–Pacific (Huang and Wu Citation1989)/Pacific–Japan (Nitta Citation1987) teleconnection pattern. Correspondingly, there are prominent negative rainfall anomalies in the tropical Indian Ocean, the Maritime Continent, eastern China, and the regions around Japan, and positive rainfall anomalies from the subtropical WNP to the northern part of the Indian Ocean and in the Far East. The rainfall anomalies are dynamically consistent with the circulation anomalies, with positive (negative) rainfall anomalies generally corresponding to cyclonic (anticyclonic) circulation anomalies. The results show that the interannual variability of the WNPSM is of importance to WNP–East Asia summer climate. But what is the effective atmospheric heat source driving the WNPSM interannual variability?
Figure 1. The correlation of JJA-mean precipitation (colors) and the regression of JJA 850-hPa winds (vectors, m s−1) onto the WNPSM index from 1979 to 2016. The color shades denote the correlations above the 95% confidence level. Only anomalous winds exceeding the 95% confidence level are shown. All statistical significances are evaluated with a two-sided Student’s t-test.
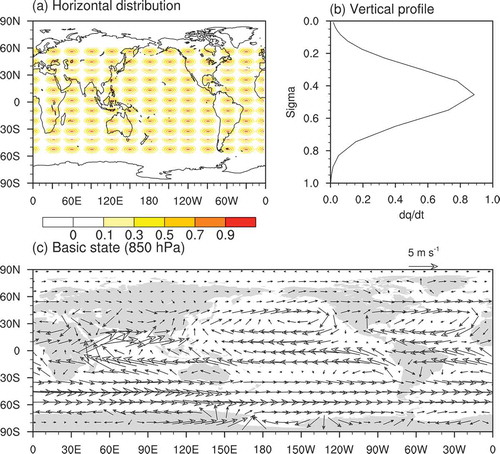
To identify the relative contribution of different local heating sources to the WNPSM interannual variability, we conduct a number of LBM experiments. We divide the region from 55°S to 55°N into 132 regions, each with a size of 10° latitude × 30° longitude. In each region, we impose an idealized heat source. The heat source has a cosine elliptical pattern, with a peak of 1 K d−1 at the 0.45 sigma level. The horizontal distributions and vertical profile of the heat source are shown in (a,b), and the basic state used by the LBM is the observed JJA climatology ()). We obtain the steady linear response by time-integrating the LBM. The 132 members’ responses to each localized heating source together constitute an ensemble. We can test the relative contribution of each localized heating source to the WNPSM based on the ensemble results. The method is similar to the Green’s function approach introduced by Branstator (Citation1985).
Figure 2. The (a) horizontal distribution and (b) vertical profile of the heating of the 132 simulation members in the LBM Green’s function. (c) The basic state used in the LBM simulations. For simplicity, the 132 heating members are shown in one map.
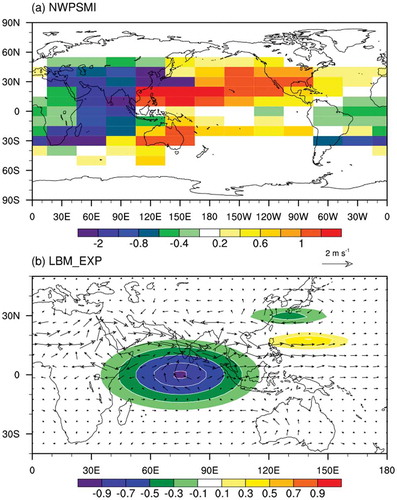
For each response, we calculate the WNPSM index of each member (see section 2), which can indicate the individual contribution of each localized heating source to the WNPSM interannual variability. A positive index indicates that the local heat source enhances the WNPSM, and vice versa. ) shows the normalized WNPSM index of each member in terms of the geographic location of heat sources. There are positive values over the South China Sea, the subtropical WNP, the North Pacific, North America, the North Atlantic, and the regions around Australia, and negative values over the tropical Indian Ocean, the midlatitudes from East China to the southern part of Japan, the eastern part of the Mediterranean, and the equatorial Atlantic. Specifically, the maximum positive values are distributed over the subtropical WNP, while the maximum negative values are located over the tropical Indian Ocean and the midlatitudes from East China to the southern part of Japan. The result indicates that the combination of atmospheric heating (cooling) over the subtropical Northwest Pacific and cooling (heating) over the tropical Indian Ocean and the midlatitudes from China to the southern part of Japan is the most effective at enhancing (weakening) the WNPSM. Thus, this heat source pattern is considered the optimal pattern affecting the WNPSM. The pattern of the optimal heat source is consistent with previous results regarding the heating over the tropical Indian Ocean (Xie et al. Citation2009) and the mei-yu/baiu front (Lu and Lin Citation2009), and the cooling over the subtropical WNP (Xiang et al. Citation2013) primarily favors a weakening of the WNPSM. ) shows the response of 850-hPa winds to the combination of atmospheric heating over the subtropical Northwest Pacific and cooling over the tropical Indian Ocean and the midlatitudes from China to the southern part of Japan. There are cyclonic anomalies extending from the Bay of Bengal to the subtropical Northwest Pacific and anticyclonic anomalies over Japan. The simulated wind pattern is similar to that in the observation (), confirming that such a heating pattern favors an enhancement of the WNPSM.
Figure 3. (a) The normalized WNPSM index for each of the 132-member simulations in the LBM Green’s function in terms of the geographic location of the heat sources. (b) The response of 850-hPa wind (vectors) to the combination of three heating sources (colors, K d−1, peak at the 0.45 sigma level) in an LBM simulation.

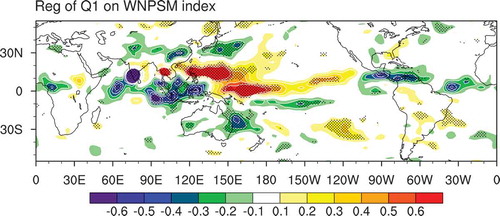
But does the optimal heat source pattern identified by the Green’s function approach also appear in the observations? shows the regression of JJA-mean Q1 onto the normalized WNPSM index in the observations. Associated with a strong WNPSM, there is prominent positive Q1 over the subtropical WNP and the equatorial western Pacific, and negative Q1 in the tropical Indian Ocean, the Maritime Continent, the tropical Atlantic, and the midlatitudes from China to South Japan, and vice versa. It is interesting to note that the pattern of observed Q1 anomalies is similar to the optimal heating pattern identified by the Green’s function approach, suggesting that the optimal heat source pattern identified by the Green’s function approach is reliable. There are also some differences between the Q1 pattern and the optimal heating pattern. For example, compared with the observed Q1 pattern, the heating pattern identified by the Green’s function method is weaker in the central Maritime Continent and the central and eastern Pacific, stronger in the North Pacific and the southern tropical Indian Ocean, and opposite in Australia. These differences may be due to several reasons. First, Green’s function does not consider the indirect effect of each heating source. For example, the heating at the equator around 170°E can lead to a Rossby wave response to its northwest regions. As the heating is located at the equator, the cyclone may not be in phase with the WNPSM-related cyclone pattern. If their phases are orthogonal with each other, the direct impact of this heating on the WNPSM is zero. But in reality, the cyclone caused by the equatorial heating could lead to off-equatorial precipitation anomalies, which may in turn cause WNPSM anomalies. Second, the Green’s function method is without any constraints on where the heat can occur. In reality, anomalous heating is more likely to occur where the mean rainfall is high. Third, some of the observed heating associated with the WNPSM (shown in ), rather than being the true heating driving the WNPSM, may just be caused by concurrent precipitation.
Figure 4. Regression of the JJA-mean atmospheric apparent heat source (Q1, K d−1) onto the WNPSM index from 1979 to 2016. The color shades denote the correlations above the 95% confidence level.
4. Summary
In this study, we use a WNPSM index defined by Wang, Wu, and Lau (Citation2001) to denote the interannual variability of the WNPSM. It is found that the WNPSM interannual variability is associated with prominent rainfall and circulation anomalies in the WNP–East Asia region. When the WNPSM is enhanced, there are notable negative rainfall anomalies in the tropical Indian Ocean and the Maritime Continent, positive rainfall anomalies from the subtropical WNP to the northern part of the Indian Ocean, negative rainfall anomalies in eastern China and the regions around Japan, and positive rainfall anomalies in the Far East, and vice versa.
Moreover, we use a method similar to the Green’s function approach to test the relative contribution of each localized heating source to the WNPSM interannual variability. Atmospheric diabatic heating (cooling) over the subtropical Northwest Pacific and cooling (heating) over the tropical Indian Ocean and the midlatitudes from China to the southern part of Japan prove to be effective at enhancing (weakening) the WNPSM. The result is broadly consistent with previous studies revealing that the WNPSM could be affected by the heat source over the tropical Indian Ocean (Xie et al. Citation2009), the subtropical WNP (Xiang et al. Citation2013), and the mei-yu/baiu front (Lu and Lin Citation2009).
It should be noted, however, that some drawbacks to this method may exist. First, nonlinear processes are not considered in this method. In the real world, the response of atmospheric circulation to heating is complicated by nonlinear processes, and different heating sources may interact with each other. Second, the heat source that peaks at the 0.45 sigma level in the vertical in all LBM experiments may not occur globally in reality. However, most WNPSM-related heating is located in the tropics, and the observed Q1 anomalies in the extratropical region is rather weak, indicating that the heating in most extratropical regions is not important. Despite these drawbacks, the high consistency between the optimal heat source pattern identified by the Green’s function approach and the pattern of observed Q1 anomalies associated with the WNPSM interannual variability suggests that the optimal heat source pattern identified by the Green’s function approach is reliable. The results suggest that any external forcing that leads to a similar heating structure as the optimal thermal forcing pattern could lead to an anomalous WNPSM. This result may help us to predict the WNPSM.
Disclosure statement
No potential conflict of interest was reported by the authors.
Additional information
Funding
References
- Adler, R. F., G. J. Huffman, A. E. Chang, R. R. Ferraro, P. Xie, J. E. Janowiak, B. Rudolf, U. Schneider, S. Curtis, and D. Bolvin. 2003. “The Version-2 Global Precipitation Climatology Project (GPCP) Monthly Precipitation Analysis (1979–Present).” Journal of Hydrometeorology 4: 1147–1167.
- Branstator, G. 1985. “Analysis of General Circulation Model Sea-surface Temperature Anomaly Simulations Using a Linear Model. Part I: Forced Solutions.” Journal of the Atmospheric Sciences 42: 2225–2241.
- Fan, L., S. I. Shin, Q. Y. Liu, and Z. Y. Liu. 2013. “Relative Importance of Tropical SST Anomalies in Forcing East Asian Summer Monsoon Circulation.” Geophysical Research Letters 40: 2471–2477.
- Fu, C., and D. Ye. 1988. “The Tropical Very Low-frequency Oscillation on Interannual Scale.” Advances in Atmospheric Sciences 5: 369–388.
- He, C., T. J. Zhou, and T. Li. 2019. “Weakened Anomalous Western North Pacific Anticyclone during an El Nino-Decaying Summer under a Warmer Climate: Dominant Role of the Weakened Impact of the Tropical Indian Ocean on the Atmosphere.” Journal of Climate 32: 213–230.
- Hirota, N., and M. Takahashi. 2012. “A Tripolar Pattern as an Internal Mode of the East Asian Summer Monsoon.” Climate Dynamics 39: 2219–2238.
- Huang, G., K. Hu, and S.-P. Xie. 2010. “Strengthening of Tropical Indian Ocean Teleconnection to the Northwest Pacific since the Mid-1970s: An Atmospheric GCM Study*.” Journal of Climate 23: 5294–5304.
- Huang, R., and Y. Wu. 1989. “The Influence of ENSO on the Summer Climate Change in China and Its Mechanism.” Advances in Atmospheric Sciences 6: 21–32.
- Jiang, W., G. Huang, K. Hu, R. Wu, H. Gong, X. Chen, and W. Tao. 2017. “Diverse Relationship between ENSO and the Northwest Pacific Summer Climate among CMIP5 Models: Dependence on the ENSO Decay Pace.” Journal of Climate 30: 109–127.
- Johnson, N. C., and S.-P. Xie. 2010. “Changes in the Sea Surface Temperature Threshold for Tropical Convection.” Nature Geoscience 3: 842–845.
- Kanamitsu, M., W. Ebisuzaki, J. Woollen, S. K. Yang, J. Hnilo, M. Fiorino, and G. Potter. 2002. “Ncep-doe Amip-ii Reanalysis (r-2).” Bulletin of the American Meteorological Society 83: 1631–1644.
- Klein, S. A., B. J. Soden, and N. C. Lau. 1999. “Remote Sea Surface Temperature Variations during ENSO: Evidence for a Tropical Atmospheric Bridge.” Journal of Climate 12: 917–932.
- Lu, R. Y., and Z. D. Lin. 2009. “Role of Subtropical Precipitation Anomalies in Maintaining the Summertime Meridional Teleconnection over the Western North Pacific and East Asia.” Journal of Climate 22: 2058–2072.
- Nitta, T. 1987. “Convective Activities in the Tropical Western Pacific and Their Impact on the Northern Hemisphere Summer Circulation.” Journal of the Meteorological Society of Japan 65: 373–390.
- Rong, X., R. Zhang, and T. Li. 2010. “Impacts of Atlantic Sea Surface Temperature Anomalies on Indo-East Asian Summer monsoon-ENSO Relationship.” Chinese Science Bulletin 55: 2458–2468.
- Tanaka, M. 1997. “Interannual and Interdecadal Variations of the Western North Pacific Monsoon and Baiu Rainfall and Their Relationship to the ENSO Cycles.” Journal of the Meteorological Society of Japan 75: 1109–1123.
- Wang, B., R. G. Wu, and K. M. Lau. 2001. “Interannual Variability of the Asian Summer Monsoon: Contrasts between the Indian and the Western North Pacific-east Asian Monsoons.” Journal of Climate 14: 4073–4090.
- Wang, B., R. G. Wu, and T. Li. 2003. “Atmosphere-warm Ocean Interaction and Its Impacts on Asian-Australian Monsoon Variation.” Journal of Climate 16: 1195–1211.
- Wang, B., Z. W. Wu, J. P. Li, J. Liu, C. P. Chang, Y. H. Ding, and G. X. Wu. 2008. “How to Measure the Strength of the East Asian Summer Monsoon.” Journal of Climate 21: 4449–4463.
- Wang, J., Z. Zhu, L. Qi, Q. Zhao, J. He, and J. X. L. Wang. 2019. “Two Pathways of How Remote SST Anomalies Drive the Interannual Variability of Autumnal Haze Days in the Beijing–Tianjin–Hebei Region, China.” Atmospheric Chemistry and Physics 19: 1521–1535.
- Watanabe, M. 2004. “Asian Jet Waveguide and a Downstream Extension of the North Atlantic Oscillation.” Journal of Climate 17: 4674–4691.
- Watanabe, M., and M. Kimoto. 2000. “Atmosphere-ocean Thermal Coupling in the North Atlantic: A Positive Feedback.” Quarterly Journal of the Royal Meteorological Society 126: 3343–3369.
- Wu, R., and B. Wang. 2000. “Interannual Variability of Summer Monsoon Onset over the Western North Pacific and the Underlying Processes.” Journal of Climate 13: 2483–2501.
- Xiang, B., B. Wang, W. Yu, and S. Xu. 2013. “How Can Anomalous Western North Pacific Subtropical High Intensify in Late Summer?” Geophysical Research Letters 40: 2349–2354.
- Xie, S. P., K. M. Hu, J. Hafner, H. Tokinaga, Y. Du, G. Huang, and T. Sampe. 2009. “Indian Ocean Capacitor Effect on Indo-Western Pacific Climate during the Summer following El Nino.” Journal of Climate 22: 730–747.
- Xie, S.-P., and Z.-Q. Zhou. 2017. “Seasonal Modulations of El Niño–Related Atmospheric Variability: Indo–Western Pacific Ocean Feedback.” Journal of Climate 30: 3461–3472.
- Yanai, M., S. Esbensen, and J. H. Chu. 1973. “Determination of Bulk Properties of Tropical Cloud Clusters from Large-Scale Heat and Moisture Budgets.” Journal of Atmospheric Sciences 30: 611–627.
- Yang, J. L., Q. Y. Liu, S. P. Xie, Z. Y. Liu, and L. X. Wu. 2007. “Impact of the Indian Ocean SST Basin Mode on the Asian Summer Monsoon.” Geophysical Research Letters 34: L02708.
- Zhang, R., A. Sumi, and M. Kimoto. 1996. “Impact of El Niño on the East Asian Monsoon: A Diagnostic Study of the ‘86/87 and ‘91/92 Events.” Journal of the Meteorological Society of Japan 74: 49–62.
- Zhu, Z., and T. Li. 2016. “A New Paradigm for Continental U.S. Summer Rainfall Variability: Asia–North America Teleconnection.” Journal of Climate 29: 7313–7327.
- Zhu, Z., and T. Li. 2018. “Amplified Contiguous United States Summer Rainfall Variability Induced by East Asian Monsoon Interdecadal Change.” Climate Dynamics 50: 3523–3536.