
 ?Mathematical formulae have been encoded as MathML and are displayed in this HTML version using MathJax in order to improve their display. Uncheck the box to turn MathJax off. This feature requires Javascript. Click on a formula to zoom.
ABSTRACT
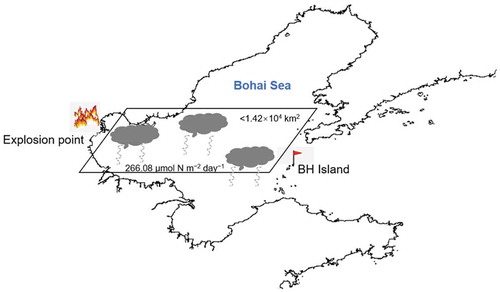
In recent years, emergent pollutant’s accidents have occurred frequently in China, causing serious harm to the ecological environment. In this study, the impact of an accidental fire and explosion at Tianjin Port in 2015 on the atmosphere over the Bohai Sea was explored. Results showed sharp increases in the concentrations of several important components of fine particulate matter (e.g. NO3−, SO42−, NH4+, organic carbon, elemental carbon) over Beihuangcheng Island after the explosion. Among them, NO3− was most affected (about 10 days), with a maximum concentration of 16.45 μg m−3. The δ15N-NO3− ranged from −1.58‰ to +8.74‰, with an average of +2.79‰ ± 3.32‰. Influenced by the explosion, δ15N-NO3− decreased significantly, which was in accordance with the industrial processes of explosives. The δ18O-NO3− varied between +49.40‰ and +69.52‰, and showed a marked increase (+66.62‰ ± 3.92‰) in the explosion-affected period. Using Monte Carlo simulation, the •OH pathway for NO3− formation was 51.79% ± 10.94% at that time — much lower than in the regular period. The elevated dry deposition of NO3− caused by the explosion was 266.08 μmol N m−2 d−1 over the Bohai Sea — again, much higher than in the regular period. With the dry nitrogen deposition of NH4+ (42.41 μmol N m−2 d−1), the total nitrogen deposition increased by 308.49 μmol N m−2 d−1, leading to severe ecological risk. Through the inverse computation of the dry deposition flux of NO3−, the affected area over the Bohai Sea was less than 1.42 × 10⁴ km2, which is about 20% of the total area.
Graphical Abstract
摘要
近年来,我国突发性污染事故频繁发生,对生态环境造成了严重危害。本研究基于气溶胶硝酸盐的氮氧同位素确认并评估了2015年天津港火灾爆炸事故对渤海地区大气氮沉降的影响研究结果表明δ15N-NO3−与δ18O-NO3−范围分别为−1.58‰至+8.74‰与+49.40‰ 至+69.52‰ 受到火灾爆炸影响,δ15N-NO3−显著下降,而δ18O-NO3−明显上升。火灾爆炸导致渤海地区大气氮沉降量增加308.49 μmol N m−2 d−1,其中硝态氮为266.08 μmol N m−2 d−1,总影响区域约为渤海面积的1/5。本研究显示同位素技术是污染事故研究中重要的示踪手段。
关键词:
1. Introduction
Environmental pollution events mainly include air pollution, water pollution, soil pollution, and other emergent pollution events or radiation pollution events (Fu, Wang, and Yan Citation2016). Since China’s period of ‘reform and opening up’, total production and the scale of industrial enterprises in the country have expanded greatly. As such, the long-term accumulated environmental risks have evolved and intensified, and China has entered a period of high incidence of environmental pollution events (Huang and Zhang Citation2015). In recent years, all kinds of environmental pollution events have begun to occur more frequently (Text S1), causing huge economic and environmental losses. Among them, air pollution emergencies have a wider range of influences, and their secondary pollutants are more complicated. They are thus of relatively greater concern to the public and media compared with other types of pollution events (Chen, Tang, and Zhao Citation2015).
Tianjin Port is located at the mouth of the Haihe River — the intersection of the Beijing–Tianjin–Hebei urban agglomeration and the Bohai economic circle. Its annual throughput amounts to about five hundred million tons, making it the largest port in the north of China (Zhang et al. Citation2019). At about 2330 LST (local standard time) 12 August 2015, a dangerous goods warehouse belonging to Ruihai International Logistics Co. situated in the Dongjiang Bonded Port Area of Tianjin Binhai New Area exploded. The explosion can be divided into two phases: (1) a first explosion occurred at 2334, for which the local magnitude (ML) was about 2.3 — equivalent to 3 tons of TNT; and (2) a second explosion occurred after 30 s, for which the ML was about 2.9 — equivalent to 21 tons of TNT. The explosion led to 165 deaths, 8 people missing, and more than 800 people who were injured (Yu et al. Citation2016). The explosives included a large amount of NO3−, such as NH4NO3 and KNO3 (http://news.china.com/zh_cn/focus/tjgbz/), which burned for more than 15 h and generated a large amount of polluting gas and atmospheric particulates. According to the forward air trajectories at that time, the nitrogen-containing pollutants were mostly transmitted to the Bohai Sea, but there remains a lack of understanding regarding the impacts over the region.
In this study, the impacts of this accidental fire and explosion at Tianjin Port (hereafter referred to simply as ‘Tianjin explosion’) on the atmosphere over Bohai Sea were explored based on fine particulate (PM2.5) data recorded on Beihuangcheng (BH) Island, which is located in the middle of the Bohai Strait. The objectives were to: (1) determine the affected time of Tianjin explosion on the Bohai Sea, based on the variation in the concentrations of PM2.5 and its species; (2) confirm the effects of Tianjin explosion through nitrogen/oxygen (δ15N-NO3−/δ18O-NO3−) isotope analysis; and (3) assess the elevated dry nitrogen deposition caused by the explosion and estimate roughly the affected area over the Bohai Sea. To the best of our knowledge, this is the first attempt at interpreting the impact of Tianjin explosion on the atmosphere over the Bohai Sea, and using isotopic analysis of NO3− in an explosion-affected period is also a first. The results should prove helpful in understanding the ecological risks of environmental pollution events.
2. Materials and methods
PM2.5 samples were collected on BH Island — an independent island located in the middle of the Bohai Strait – from 31 July to 30 August 2015. It is a part of the annual atmospheric observations at the Environmental Monitoring Station of the State Ocean Administration of China (38°24′N, 120°55′E) (Zong et al. Citation2017). For particulate compositions, organic carbon (OC), elemental carbon (EC), and water-soluble ions, including Na+, K+, Ca2+, Mg2+, NH4+, Cl−, NO3−, and SO42−, were detected. In addition, δ15N-NO3−/δ18O-NO3− were also analyzed using the nitrous oxide (N2O) conversion method. Specific information about the sampling campaign and chemical analysis can be referred to in Text S2.
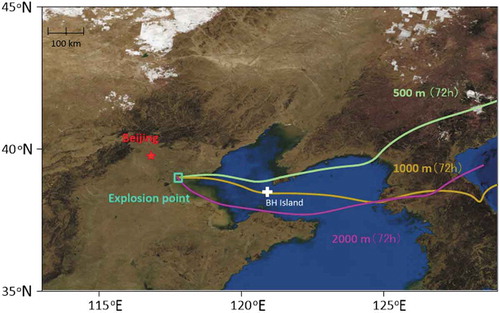
Forward trajectories starting at 2300 LST 12 August 2015 at the Tianjin explosion point were generated using the Hybrid Single-Particle Lagrangian Integrated Trajectory (HYSPLIT) model, which is a complete system for computing simple air parcel trajectories in complex dispersion simulations (Bressi et al. Citation2014). It is available on the National Oceanic and Atmospheric Administration’s Air Resource Laboratory website (www.arl.noaa.gov/ready/hysplit4.html). As indicated by Jiang, Ji, and Teng (Citation2017), the pollutants produced in the explosion were mainly raised to 1–2 km into the upper air. Therefore, the model was adopted to generate 72-h forward trajectories encountered at 500, 1000, and 2000 m, respectively, showing most of the pollutants spread to the middle of the Bohai Sea ().
Figure 1. Geographical locations of the explosion point and BH Island, along with the characteristics of forward trajectories (72 h) at 500, 1000, and 2000 m, respectively, starting at 2300 LST 12 August 2015 at the explosion point.
3. Results and discussion
3.1 Component characteristics of PM2.5 before, during, and after the explosion
illustrates the chemical features of PM2.5 on BH Island from 31 July to 30 August 2015. Apparently, sharp increasing concentrations of several important components (e.g. NO3−, SO42−, NH4+, OC, and EC) were observed beginning at the time of Tianjin explosion, while other species, such as Cl−, Na+, K+, and Mg2+, did not change significantly. This indicates that the explosion inflicted a marked impact on secondary particulate components and carbonaceous species in the Bohai region. For better revealing the impacts of the explosion, the sampling period was divided into three phases: (1) before the explosion (named BE, 31 July–9 August); (2) during the explosion (DE, 12 August–21 August); and after the explosion (AE, 24 August–30 August). The average concentrations of PM2.5, NO3−, SO42−, and NH4+ were 61.11 ± 10.06 μg m−3, 14.04 ± 2.34 μg m−3, 9.33 ± 0.81 μg m−3, and 6.42 ± 3.64 μg m−3, respectively, in the DE period — much higher than those in the BE period (23.01 ± 10.02 μg m−3, 3.02 ± 2.52 μg m−3, 4.90 ± 2.16 μg m−3, 2.35 ± 1.48 μg m−3) and AE period (23.41 ± 10.24 μg m−3, 2.52 ± 1.18 μg m−3, 4.32 ± 1.63 μg m−3, 2.46 ± 1.02 μg m−3). Comparatively, the concentrations of these secondary constituents in the BE and AE phases were not much different (p > 0.05), reflecting the basic feature of this season, while the high concentrations in the DE period implied a considerable influence of the explosion on BH Island. Different from the continuous tendency of high concentration for secondary constitutes, carbonaceous species, such as OC and EC, only peaked on 12 August, and then declined rapidly. In addition, the concentration of Ca2+, which had been stable, increased on 21 August accompanied by a decrease in NH4+ concentration.
Figure 2. Variation in the concentrations of PM2.5 components (OC, EC, SO42−, NO3−, NH4+, Cl−, Na+, K+, Mg2+, and Ca2+) and the time series of δ15N-NO3− and δ18O-NO3− in PM2.5 observed on BH Island from 31 July to 30 August in 2015.
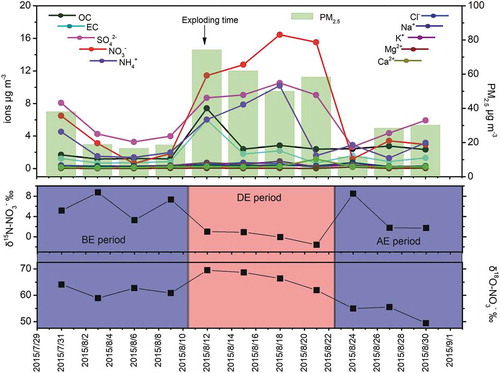
Based on the Geostationary Ocean Color Imager (Jiang, Ji, and Teng Citation2017), the explosive gas mass had transported to and passed BH Island in about 24 h. The time was exactly consistent with the time of the increase and decrease for OC and EC concentrations. This may indicate that the high contents of OC and EC were mostly primary products of Tianjin explosion (Liu et al. Citation2014). However, judging from the variation of secondary components, we speculate that the impact of Tianjin explosion on the Bohai Sea region could have lasted about 10 days. In the BE and AE periods, the concentration of NO3− was mostly lower than that of SO42−, but the trend reversed in the DE period, suggesting that the effect of Tianjin explosion on NO3− was the most significant in terms of single components in PM2.5. The highest concentration of NO3− was 16.45 μg m−3 in the DE period — about 25 times the lowest value in the BE and AE periods; and taking the average value of the BE and AE stages (2.81 μg m−3) as the background value of the Bohai Sea, Tianjin explosion caused the concentration of NO3− on BH island to rise by 13.64 μg m−3. As reported, the explosives mainly included NaCN (700 tons), NH4NO3 (800 tons), KNO3 (500 tons) (Jiang, Ji, and Teng Citation2017), and possible chemical reactions occurred via the following chemical equations:
Assuming that the above chemical reactions occurred completely, we can infer that the amount of NOx emission from the explosion was approximately 1600 tons. The NOx would have been discharged into the atmosphere with more diffusivity, longer duration, and a more extensive diffusion area compared with solid pollutants, which might explain the high concentration of NO3− observed after 12 August – the time of the explosion and the transmission to BH Island of explosive gas masses. Although there are no precursors of NH4+ in the explosion, the high concentrations might be attributable to the promotion of NOx. NO3− formed due to the explosion would have increased the acidity of the atmosphere and greatly promoted the conversion of gaseous NH3 to particulate NH4+ (Pan et al. Citation2016). We can speculate that the NH3 content in the Bohai region was very low at that time, although there are no direct observational data. However, it can be inferred by the increase in Ca2+ concentration and decrease in NH4+ on 21 August, as the high acidity gas would have continued to acidify the Ca material to balance the acidity in the case of insufficient NH3 in the atmosphere (Xiao et al. Citation2017).
3.2 Nitrogen and oxygen isotope characteristics impacted by the explosion
In order to further confirm the impact of Tianjin explosion on the atmosphere over the Bohai Sea, we carried out δ15N and δ18O analysis for NO3−, which was most severely affected by the explosion. During the observation period, δ15N-NO3− ranged from −1.58‰ to +8.74‰, with an average of +2.79‰ ± 3.32‰ (). In the DE period, the mean δ15N-NO3− was +0.06‰ ± 1.19‰, which was significantly lower than that of the BE period (+4.63‰ ± 3.05‰) and the AE period (+3.99‰ ± 3.90‰). Similar to the concentration tendency, there was no significant change between the BE period and AE period, indicating the local characteristics of the Bohai Sea in August (about +4‰), while the decrease of δ15N-NO3− in the DE period indicated that the high concentration of NO3− was caused by the explosion. Generally, atmospheric NO3− is mainly derived from the conversion of NOx, of which δ15N of different anthropogenic and natural sources usually varies over a large range (Elliott et al. Citation2019). For example, NOx from coal combustion owns a higher δ15N value, while δ15N from microbial processes is more negative (Hastings, Sigman, and Lipschultz Citation2003). From the source apportionment result in our previous research based on an improved Bayesian model, the sources of NOx in August on BH Island were coal combustion, biomass burning, mobile sources, and microbial processes, with contributions of 32.66% ± 6.67%, 31.84% ± 3.65%, 22.16% ± 4.87%, and 13.34% ± 4.61%, respectively (Zong et al. Citation2017). However, this method is not suitable for the source apportionment of NOx during the DE period. As mentioned above, NOx mostly originated from the explosion reaction of NaCN, NH4NO3, and KNO3, which were all industrial products with δ15N characteristics significantly different from those of conventional emission sources. According to the reaction principles (S3–S6), the nitrogen in the explosives was primarily from the N2 in the atmosphere. Although a certain degree of isotope fractionation would have occurred during the transformation (Walters, Simonini, and Michalski Citation2016), the δ15N value should be similar to the isotopic value of N2 (about 0‰) in the atmosphere. This was consistent with the average of the δ15N-NO3− observed herein. Notably, δ15N-NO3− showed a trend of continuous decline in the DE period, which may have been due to the divergence of heavy nitrogen as the diffusion time became longer. With the decrease of NH3 concentration in the Bohai region, nitric acid (HNO3) would have combined with Ca substances to form calcium nitrate [Ca(NO3)2] with larger particle size, and the deposition was more remarkable, leading to more negative δ15N-NO3− (Luo et al. Citation2018).
The δ18O-NO3− on BH Island varied between +49.40‰ and +69.52‰, with a mean of +61.18‰ ± 6.15‰, which was well within the broad range of values previously reported (Fang et al. Citation2011). Generally, the oxygen atoms of atmospheric NOx are rapidly exchanged with O3 in the NO/NO2 cycle (S7–S9), and then NO2 is translated to HNO3 based on the •OH pathway (S10) or O3 pathway (S11–S13). Thus, the δ18O-NO3− value is determined by its generation pathways, and can be adopted to explore the conversion process of NOx to NO3− in the atmosphere. In the DE period, δ18O-NO3− showed a significant increase (+66.62‰ ± 3.92‰), which was higher than those in the other two stages (BE: +61.65‰ ± 2.24‰; AE: +53.29‰ ± 3.38‰). This indicated that the explosion had a certain influence on the δ18O-NO3−, and impacted on the conversion pathway from NOx to NO3−. For exploring this effect, we adopted the assumption that 2/3 of oxygen atoms of NO3− may have derived from O3 and 1/3 from •OH in the •OH generation pathway, and 5/6 of oxygen atoms were from O3 and 1/6 from •OH in the O3 pathway (Hastings, Sigman, and Lipschultz Citation2003), and then assessed the respective contributions of the two-generation pathways via a Monte Carlo simulation (Text S3) (Goulden et al. Citation1996). The results showed that the average contributions for the •OH generation pathway were 76.29% ± 7.10%, 51.79% ± 10.94%, and 91.76% ± 2.48% in the BE period, DE period, and AE period, respectively. Obviously, the conversion ratio of the O3 pathway increased significantly in the DE period, which may have been due to the massive generation of O3 as a byproduct during the chemical processes in Tianjin explosion. Besides, the increase of PM2.5 mass (61.11 ± 10.06 μg m−3) could also have facilitated the O3 pathway through the N2O5 heterogeneous chemistry (Qu et al. Citation2019).
3.3 Elevated dry nitrogen deposition triggered by the explosion
Generally, an increase in the nitrogen concentration (e.g. NO3−, NH4+) in the atmosphere will inevitably elevate the amount of nitrogen deposition (Duce et al. Citation1991). Here, we evaluated the characteristics of atmospheric dry deposition over the Bohai Sea during the explosion. Adopting dry deposition velocities used for PM2.5 samples of 0.017 m s−1 for NO3− and 0.0022 m s−1 for NH4+ (Nakamura, Matsumoto, and Uematsu Citation2005), the NO3− and NH4+ resulting from dry deposition in the DE period was estimated to be 332.68 ± 55.39 μmol N m−2 d−1 and 67.75 ± 38.41 μmol N m−2 d−1, respectively. Whereas the average NO3− and NH4+ deposition was 66.60 ± 45.64 μmol N m−2 d−1 and 25.34 ± 12.66 μmol N m−2 d−1, respectively, in the BE and AE period. If the averages were taken as the background values of August 2015 in the Bohai Sea region, the elevated dry nitrogen deposition of NO3− and NH4+ would have been 266.08 () and 42.41 μmol N m−2 d−1, respectively; the total nitrogen deposition increased by 308.49 μmol N m−2 d−1. This indicated that a great amount of nitrogen had entered the Bohai Sea region and may have caused serious damage to its ecosystem because marine areas are usually nitrogen-limited (Jickells et al. Citation2005). For example, an increasing nitrogen input has changed the N:Si ratio in the Yellow Sea, contributing to shifts in phytoplankton assemblages from diatoms to non-diatoms, as well as harmful algal blooms of non-diatoms (Liu and Glibert Citation2018); and enhanced atmospheric deposition of inorganic nitrogen in the Bohai Sea region caused a 56.5% increase in the phytoplankton biomass on average (Shou et al. Citation2018). Specifically, NO3− was directly produced by the explosion, while NH4+ was generated indirectly by the high concentration of NOx. The high deposition of NH4+ may have been due to the change from gaseous NH3 to particulate NH4 with a more intense trend of deposition (Park et al. Citation2019). Correspondingly, the deposition would have decreased after the event, but the total NH4+ deposition was elevated. Therefore, it can be seen that attention should be paid to the direct emissions as well as the byproducts in the event of an emergency, especially for atmospheric incidents with complex reaction mechanisms.
Figure 3. Elevated deposition characteristics of NO3− and the area of influence in the Bohai Sea resulting from Tianjin explosion.
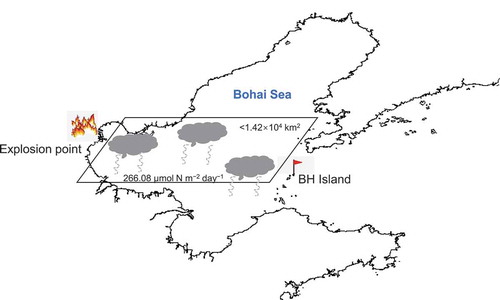
Bohai is a semi-enclosed sea with an area of 7 × 10⁴ km2. Based on the deposition volume and time of influence (about 10 days indicated by the DE period), the dry deposition flux of N-NO3− induced by Tianjin explosion was estimated at 2607 tons, which significantly exceeded the amount of N-NOx produced (about 527 tons). Such a large difference may have been caused by the total area of the Bohai Sea adopted in the above calculation. Assuming that all the NO3− generated uniformly and deposited into the Bohai Sea, the area affected by the explosion in the Bohai Sea can be reverse-estimated. The re-estimated area was approximately 1.42 × 10⁴ km2, which is about 20% of the Bohai sea. This was also in accordance with the forward trajectories, because most of the air flow was mainly transmitted to the middle of the Bohai Sea (). The actual impact area, of course, should be smaller than the computation, because the NO3− produced could not enter into the Bohai Sea completely. Chung and Kim (Citation2015) proposed that the smoke plumes of Tianjin explosion could have transported to the Korean Peninsula, based on a variety of satellite remote sensing data.
4. Conclusion
The concentrations of PM2.5, NO3−, SO42−, and NH4+ were 61.11 ± 10.06 μg m−3, 14.04 ± 2.34 μg m−3, 9.33 ± 0.81 μg m−3, and 6.42 ± 3.64 μg m−3, respectively, in the DE period — much higher than those in the BE and AE period. This confirms the effect of Tianjin explosion on the Bohai Sea region, and the effect could have lasted about 10 days, as inferred by the duration of the DE period. Compared with some alkali ions, secondary particulate components and carbonaceous species were more affected. Specifically, NO3− was most affected in PM2.5, with an increase of 13.64 μg m−3. The mean δ15N-NO3− in the DE period was +0.06‰ ± 1.19‰, which was similar to the isotopic value of N2 in the atmosphere. Based on the industrial processes of explosives, the observed δ15N-NO3− proved that the high concentration of NO3− in the DE period mainly came from Tianjin explosion. The δ18O-NO3− on BH Island varied between +49.40‰ and +69.52‰ with a mean of +61.18‰ ± 6.15‰, and it showed a significant increase (+66.62‰ ± 3.92‰) in the DE period. Using Monte Carlo simulation, the •OH generation pathway of NO3− was 51.79% ± 10.94% at that time — much lower than in the BE and AE period, indicating an increase in the conversion ratio of the O3 pathway for NO3− formation. The elevated dry nitrogen deposition of NO3− and NH4+ caused by Tianjin explosion was 266.08 and 42.41 μmol N m−2 d−1, respectively, in the Bohai Sea. Through inverse computation of the dry deposition flux of NO3−, the affected area of the Bohai Sea was less than 1.42 × 10⁴ km2. It is undeniable that there are some uncertainties in the calculation, but the results of this paper truly reflect the impact of Tianjin explosion on the Bohai Sea, which will inevitably help with its ecological recovery in the future.
Supplemental Material
Download PDF (390.1 KB)Acknowledgment
The authors gratefully acknowledge the National Oceanic and Atmospheric Administration’s Air Resources Laboratory for providing the HYSPLIT transport model.
Disclosure statement
No potential conflict of interest was reported by the authors.
Supplementary material
Supplemental data for this article can be accessed here.
Additional information
Funding
Related Research Data
References
- Bressi, M., J. Sciare, V. Ghersi, N. Mihalopoulos, J. E. Petit, J. B. Nicolas, S. Moukhtar, et al. 2014. “Sources and Geographical Origins of Fine Aerosols in Paris (france).” Atmospheric Chemistry and Physics 14 (16): 8813–8839. doi:10.5194/acp-14-8813-2014.
- Chen, W., H. Z. Tang, and H. M. Zhao. 2015. “Diurnal, Weekly and Monthly Spatial Variations of Air Pollutants and Air Quality of Beijing.” Atmospheric Environment 119: 21–34. doi:10.1016/j.atmosenv.2015.08.040.
- Chung, Y. S., and H. S. Kim. 2015. “On the August 12, 2015 Occurrence of Explosions and Fires in Tianjin, China, and the Atmospheric Impact Observed in Central Korea.” Air Quality Atmosphere and Health 8 (6): 521–532. doi:10.1007/s11869-015-0371-2.
- Duce, R., P. Liss, J. Merrill, E. Atlas, P. Buat-Menard, B. Hicks, J. Miller, et al. 1991. “The Atmospheric Input of Trace Species to the World Ocean.” Global Biogeochemical Cycles 5 (3): 193–259. doi:10.1029/91gb01778.
- Elliott, E. M., Z. J. Yu, A. S. Cole, and J. G. Coughlin. 2019. “Isotopic Advances in Understanding Reactive Nitrogen Deposition and Atmospheric Processing.” Science of the Total Environment 662: 393–403. doi:10.1016/j.scitotenv.2018.12.177.
- Fang, Y. T., K. Koba, X. M. Wang, D. Z. Wen, J. Li, Y. Takebayashi, X. Y. Liu, and M. Yoh. 2011. “Anthropogenic Imprints on Nitrogen and Oxygen Isotopic Composition of Precipitation Nitrate in a Nitrogen-polluted City in Southern China.” Atmospheric Chemistry and Physics 11 (3): 1313–1325. doi:10.5194/acp-11-1313-2011.
- Fu, G., J. H. Wang, and M. W. Yan. 2016. “Anatomy of Tianjin Port Fire and Explosion: Process and Causes.” Process Safety Progress 35 (3): 216–220. doi:10.1002/prs.11837.
- Goulden, M. L., J. W. Munger, S. M. Fan, B. C. Daube, and S. C. Wofsy. 1996. “Measurements of Carbon Sequestration by Long-term Eddy Covariance: Methods and a Critical Evaluation of Accuracy.” Global Change Biology 2 (3): 169–182. doi:10.1111/j.1365-2486.1996.tb00070.x.
- Hastings, M. G., D. M. Sigman, and F. Lipschultz. 2003. “Isotopic Evidence for Source Changes of Nitrate in Rain at Bermuda.” Journal of Geophysical Research: Atmospheres 108 (D24): 4790–4812. doi:10.1029/2003jd003789.
- Huang, P., and J. Y. Zhang. 2015. “Facts Related to August 12, 2015 Explosion Accident in Tianjin, China.” Process Safety Progress 34 (4): 313–314. doi:10.1002/prs.11789.
- Jiang, B. B., Q. Y. Ji, and G. C. Teng. 2017. “Using GOCI to Detect the Diffusion of Pollution after the TianJin Harbour Explosion.” International Journal of Remote Sensing 39 (6): 1744–1753. doi:10.1080/01431161.2017.1415479.
- Jickells, T. D., Z. S. An, K. K. Andersen, A. R. Baker, G. Bergametti, N. Brooks, J. J. Cao, et al. 2005. “Global Iron Connections between Desert Dust, Ocean Biogeochemistry, and Climate.” Science 308 (5718): 67–71. doi:10.1126/science.1105959.
- Liu, D., and P. M. Glibert. 2018. “Ecophysiological Linkage of Nitrogen Enrichment to Heavily Silicified Diatoms in Winter.” Marine Ecology Progress Series 604: 51–63. doi:10.3354/meps12747.
- Liu, J., J. Li, Y. Zhang, D. Liu, P. Ding, C. Shen, K. Shen, et al. 2014. “Source Apportionment Using Radiocarbon and Organic Tracers for PM2.5 Carbonaceous Aerosols in Guangzhou, South China: Contrasting Local- and Regional-scale Haze Events.” Environmental Science and Technology 48 (20): 12002–12011. doi:10.1021/es503102w.
- Luo, L., S. J. Kao, H. Y. Bao, H. Y. Xiao, H. W. Xiao, X. H. Yao, H. W. Gao, J. W. Li, and Y. Y. Lu. 2018. “Sources of Reactive Nitrogen in Marine Aerosol over the Northwest Pacific Ocean in Spring.” Atmospheric Chemistry and Physics 18 (9): 6207–6222. doi:10.5194/acp-18-6207-2018.
- Nakamura, T., K. Matsumoto, and M. Uematsu. 2005. “Chemical Characteristics of Aerosols Transported from Asia to the East China Sea: An Evaluation of Anthropogenic Combined Nitrogen Deposition in Autumn.” Atmospheric Environment. 39(9): 1749–1758. doi:10.1016/j.atmosenv.2004.11.037.
- Pan, Y. P., Y. S. Wang, J. K. Zhang, Z. R. Liu, L. L. Wang, S. L. Tian, G. Q. Tang, et al. 2016. “Redefining the Importance of Nitrate during Haze Pollution to Help Optimize an Emission Control Strategy.” Atmospheric Environment 141:197–202. doi:10.1016/j.atmosenv.2016.06.035.
- Park, G. H., S. E. Lee, Y. I. Kim, D. Kim, K. Lee, J. Kang, Y. H. Kim, H. Kim, S. Park, and T. W. Kim. 2019. “Atmospheric Deposition of Anthropogenic Inorganic Nitrogen in Airborne Particles and Precipitation in the East Sea in the Northwestern Pacific Ocean.” Science of the Total Environment 681: 400–412. doi:10.1016/j.scitotenv.2019.05.135.
- Qu, Y., Y. Chen, X. G. Liu, J. W. Zhang, Y. T. Guo, and J. L. An. 2019. “Seasonal Effects of Additional HONO Sources and the Heterogeneous Reactions of N2O5 on Nitrate in the North China Plain.” Science of the Total Environment 690: 97–107. doi:10.1016/j.scitotenv.2019.06.436.
- Shou, W. W., H. B. Zong, P. X. Ding, and L. J. Hou. 2018. “A Modelling Approach to Assess the Effects of Atmospheric Nitrogen Deposition on the Marine Ecosystem in the Bohai Sea, China.” Estuarine, Coastal and Shelf Science 208: 36–48. doi:10.1016/j.ecss.2018.04.025.
- Walters, W. W., D. S. Simonini, and G. Michalski. 2016. “Nitrogen Isotope Exchange between NO and NO2 and Its Implications for δ15N Variations in Tropospheric NOx and Atmospheric Nitrate.” Geophysical Research Letters 43 (1): 440–448. doi:10.1002/2015gl066438.
- Xiao, H. W., H. Y. Xiao, L. Luo, C. Y. Shen, A. M. Long, L. Chen, Z. H. Long, and D. N. Li. 2017. “Atmospheric Aerosol Compositions over the South China Sea: Temporal Variability and Source Apportionment.” Atmospheric Chemistry and Physics 17 (4): 3199–3214. doi:10.5194/acp-17-3199-2017.
- Yu, M., Q. Lv, H. Ding, X. Zeng, J. Cao, J. Liu, H. Fan, and S. Hou. 2016. “Evaluation of Blast Injury Patients from the 2015 Tianjin Explosions in China.” Burns 42 (5): 1133–1140. doi:10.1016/j.burns.2016.03.004.
- Zhang, Y. Y., W. Q. Guo, C. Sun, and L. L. Jing. 2019. “Systems-based Analysis on the China-Tianjin Port Fire and Explosion.” Ekoloji 28 (107): 1921–1928.
- Zong, Z., X. P. Wang, C. G. Tian, Y. J. Chen, Y. T. Fang, F. Zhang, C. Li, J. Z. Sun, J. Li, and G. Zhang. 2017. “First Assessment of NOx Sources at a Regional Background Site in North China Using Isotopic Analysis Linked with Modeling.” Environmental Science and Technology 51 (11): 5923–5931. doi:10.1021/acs.est.6b06316.