
ABSTRACT
Simple and inexpensive estimation of the rates and sources of atmospheric nitrogen (N) deposition is critical for its effective mitigation in a region with different land-use types. In this study, the N content and N isotopic composition (δ15N) of moss (Haplocladium microphyllum) tissues and precipitation at six sites with three land-use types (urban, suburban, and rural) were measured in the Yangtze River Delta. A significant linear relationship between moss N content and wet N deposition, and a consistent decrease trend for moss N content and wet N deposition from urban to suburban to rural areas were observed. More negative δ15N of suburban and rural mosses indicated N mainly released from agriculture and effluent, while the less negative δ15N of urban mosses were mainly influenced by fossil fuel combustion and traffic emissions. Although the negative moss δ15N indicates that reduced N dominates wet N deposition, there was no significant correlation between moss δ15N and the ratio of ammonium to nitrate (NH4+/NO3−). These results reveal that the moss N content and δ15N can be used as a complementary tool for estimating the rates and sources of wet N deposition in a region with different land-use types.
Graphical abstract
摘要
简单有效地估算大气氮沉降量及其来源至关重要。本研究同时收集长三角市区, 郊区, 农村的雨水和附近的石生细叶小羽藓,分析苔藓氮含量与氮湿沉降量以及苔藓和雨水的氮同位素(δ15N)。结果显示:苔藓氮含量与氮湿沉降量显著相关,均呈市区>郊区>农村趋势。苔藓δ15N表明郊区和农村大气氮湿沉降主要来自农业和人畜废水释放,而市区还受煤炭燃烧和机动车排放影响。该研究表明石生苔藓氮含量和δ15N能用来指示长三角大气氮湿沉降量及其来源,以弥补传统氮沉降监测数据的缺乏和费时费力的缺点。
1. Introduction
Atmospheric reactive nitrogen (N) deposition has more than doubled over the past century because of the growing human population and its associated demand for food and energy (Galloway et al. Citation2008). Excessive N deposition could lead to soil acidification, aquatic eutrophication, and decreased biodiversity (Gu et al. Citation2015). In China, N deposition is increasing at an average of 0.18–0.41 kg N ha−1 a−1 (Liu et al. Citation2013a; Lu and Tian Citation2014) and it is important to understand the rates and sources of N deposition to take appropriate measures. However, mapping wet N deposition using monitoring stations in a region, especially in remote areas and in regions with many land-use types, is costly (Zhu et al. Citation2015). Further, accurately determining the wet N deposition rates and sources is very difficult because there are many N compounds (Harmens et al. Citation2011, Citation2014; Zechmeister et al. Citation2008). Therefore, the rates and sources of wet N deposition need to be urgently estimated with a simple and inexpensive method.
During the past several decades, many researchers have used biomonitoring organisms, such as mosses, lichen, and vascular plants to investigate the rates, compositions, and sources of atmospheric N deposition (e.g. Bragazza et al. Citation2005; Christie Citation1987; Harmens et al. Citation2014). First, mosses absorb N mainly from atmospheric wet and dry depositions because of the lack of a well-developed root system and protective cuticle and the unique specific leaf area (Harmens et al. Citation2014). Second, reduced N (NHx) generally has a more negative N isotopic composition (δ15N) than oxidized N (NOy) in atmospheric deposition, and mosses utilize atmospheric N with little isotope fractionation (Liu et al. Citation2008a, Citation2012; Xiao et al. Citation2010b). Third, moss is widely distributed and can be used for biomonitoring N deposition in some regions to compensate for the lack of automated instruments and passive monitoring (Diaz-Alvarez, Lindig-Cisneros, and de la Barrera Citation2018; Harmens et al. Citation2011). Therefore, mosses have been broadly used by researchers to investigate N deposition levels and its effects since the 1980s.
Previous studies have reported spatial and long-term changes in atmospheric N deposition according to the relationship between moss N content and atmospheric N deposition (Harmens et al. Citation2011; Poikolainen et al. Citation2009). Moreover, moss δ15N, which indicates the species and sources of atmospheric N deposition (Liu et al. Citation2008b; Qu et al. Citation2016), has been studied. Recently, δ15N of moss was used to study the mechanism of moss N utilization which could be more accurate to indicate the N deposition (Liu et al. Citation2012, Citation2013b). However, moss biomonitoring of atmospheric N deposition is mainly concentrated in Europe and Southern China. The Yangtze River Delta (YRD) has experienced serious N deposition (Ti et al. Citation2018), but there are few monitoring sites for atmospheric N deposition. Moreover, the relationship between moss N content and N deposition in the YRD has not been reported.
In this study, moss tissue and deposition were sampled within a distance of 2 km of each other at six monitor sites in the YRD with three land-use types – urban, suburban, and rural. The objectives of this study were to indicate the relationships between moss (Haplocladium microphyllum) N content and wet N deposition, between moss δ15N and precipitation δ15N, and to explore the sources and compositions of atmospheric wet N deposition in the YRD.
2. Materials and methods
2.1. Study area
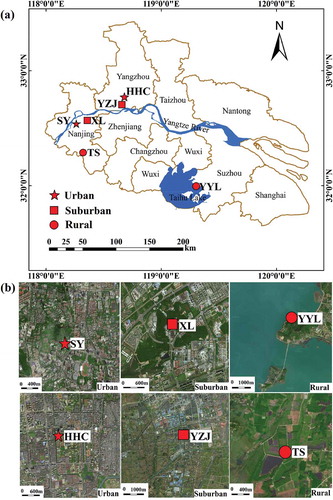
The YRD has a subtropical monsoon climate with a mean temperature and rainfall of 15°C and 1050 mm, respectively. Rainfall has an obvious seasonal pattern, with more than 70% falling during the months of May to October. The land area in the YRD region is 5.63 × 10⁴ km2, of which agriculture, urban, aquatic, forest, and grassland types occupy 41.9%, 23.4%, 21.0%, 6.2%, and 5.8% of the land, respectively. Six sites in the YRD were selected to represent the three main land-use types, i.e. urban, suburban, and rural (, Table S1). Suiyuan (SY) and Hehuachi (HHC) are close to the centers of Nanjing and Yangzhou, respectively, and are surrounded by residential, transportation, commercial, and catering areas— representing an urban area. Xianlin (XL) and Yangzijin (YZJ) are in university towns of Nanjing and Yangzhou, respectively, mainly in the cultural, educational, and residential areas— representing a suburban area. Tongshan (TS) is surrounded by cropland, mainly by rice and wheat cropping rotations, which receive chemical N fertilizer of 550 kg N ha−1 a−1. Yuyangli (YYL) belongs to Suzhou city and is close to the Taihu Lake drinking water source protection area with few human activities. TS and YYL belong to rural area. A detailed description of the sampling sites can be found in previous studies (Chen et al. Citation2019).
Figure 1. Map showing (a) the location of Yangtze River Delta (YRD) and (b) sampling sites. The image of each site derived from Google Earth.
2.2. Sample collection and analysis
To avoid possible interspecific and seasonal differences (Dong et al. Citation2017), the epilithic moss Haplocladium microphyllum, was collected on July 2017, which commendably biomonitors atmospheric N deposition (Liu et al. Citation2008b). Mature and green tissues from three to five subsampling sites were collected within a 2 km range of each wet N deposition sampling site. Three to five samples were mixed as one composite sample for each site (). All mosses were collected from bare rock without canopies to avoid the effect of the canopies and that of falling N compounds. The sampling sites are more than 300 m away from the main roads and are considered to be completely free of the direct impact of stagnant water and surface water splashes, traffic, and other man-made pollution sources (human and animal excrement, fertilization, and stamping).
The collected fresh moss samples were stored in self-sealed bags. After dead branches, leaves, and debris attached to the mosses were removed, the mosses were sonicated and repeatedly washed with deionized water to remove N components from the moss surface. They were dried in an oven at 70°C, ground with liquid N, and then dried to a constant weight and passed through a 100-mesh sieve. The moss N content was measured using an elemental analyzer (PE2400Ⅱ, PerkinElmer, USA) with an analytical precision of 0.1%. N isotope ratios were analyzed on a Finnigan MAT 252 mass spectrometer with an analytical precision of 0.2‰, after combustion at 850°C and purification with liquid N. Analysis of potassium nitrate standard (MOR2386-01, +1.9‰), provided by Shoko Co., (Tokyo, Japan), gave a mean (±SD) δ15Nair value of 1.9‰ ± 0.2‰ (n = 5). Accuracy and recovery of N and δ15N were checked analysing a sample of this standard material after each set of eight moss analyses.
The TN (total N), NH4+ (ammonium), and NO3− (nitrate) concentrations of rainwater samples were analyzed using a UV–3600 spectrophotometer (Shimadzu UV–VIS–NIR Spectrophotometer, Shimadzu Co., Kyoto, Japan) (Chen et al. Citation2019). The δ15N-NH4+ and δ15N-NO3− of precipitation were determined using a diffusion method (Zhang et al. Citation2017).
2.3. Statistical analysis
Statistical analysis was conducted using SPSS 18.0 (SPSS Inc., Chicago, USA), and graphs were created with OriginPro 9.0 (OriginLab Corporation, Northampton, MA, USA). Linear curve fit analyses were used to examine the relationship between moss N content and N deposition rates, between moss δ15N and precipitation δ15N. Here, p < 0.05 is considered statistically significant unless stated otherwise.
3. Results
3.1. Moss nitrogen content
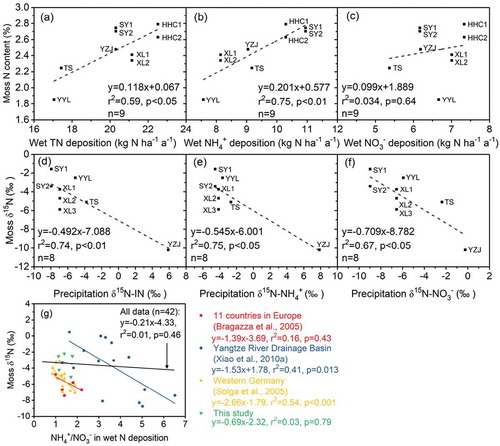
The average N contents of urban, suburban, and rural mosses were 2.72% ± 0.07%, 2.41% ± 0.07%, and 2.05% ± 0.27%, respectively (). The lowest value of moss N content was observed at YYL in the rural area, and the highest value occurred at the center of Yangzhou (HHC). A significant decrease in moss N content was found from urban to suburban and rural areas (). The decrease trend corresponded with the wet N deposition rates across the three land-use types (). There was a significant correlation between moss N content and wet TN (p < 0.05) and NH4+ (p < 0.01) depositions (). The wet NH4+ deposition had a greater influence on the N content, which can be seen from the stronger correlation between the two than that between wet NO3− deposition and the N content ().
Figure 2. (a) Moss N content, (b) moss δ15N, (c) wet TN deposition rate, and (d) precipitation δ15N-IN across the three land-use types, i.e. urban, suburban, and rural: different small letters above the bar stand for a significant difference at the 0.05 level across the three land-use types (the δ15N of different sources is cited from Xiao et al. (Citation2010b) and Freyer (Citation1978)). The primary values of δ15N-NH3 from fertilizer vary widely, for example, ranged from −51‰ to −35‰ (Elliott et al. Citation2019), ranged from −5.9‰ to +6.6‰ with mean −0.2‰ ± 2.1‰ (n = 29) (Bateman and Kelly Citation2007). What’s more, the δ15N of fertilizer use ranges from −5‰ to 0 (Freyer Citation1978), which has been used in the previous studies on mosses monitoring rates and sources of atmospheric N deposition (e.g. Liu et al. Citation2012; Qu et al. Citation2016; Xiao et al. Citation2010b). So, we selected the later.
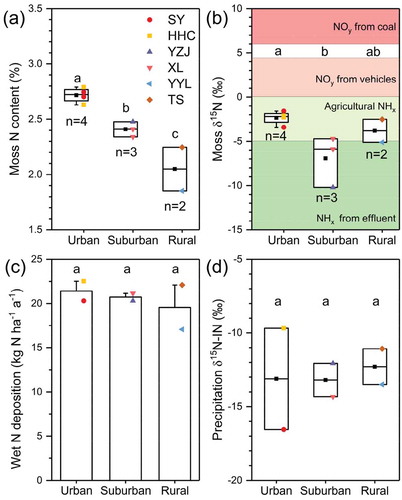
Figure 3. The relationship between moss N content and (a) TN, (b) NH4+, and (c) NO3−, and the relationship between moss N isotope and (d) δ15N-IN, (e) δ15N-NH4+, (f) δ15N-NO3−, and (g) NH4+/NO3− of precipitation.
3.2. Nitrogen isotopic composition in moss
All epilithic mosses had negative δ15N signatures from −10.21‰ to −1.58‰ in the YRD. The moss δ15N was in the order: urban (−2.35‰ ± 0.77‰) > rural (−3.81‰ ± 1.84‰) > suburban (−6.14‰ ± 2.85‰) sites (). The moss δ15N of urban was significantly higher than that of suburban. There was a significant correlation between moss δ15N and precipitation δ15N-IN (inorganic N, i.e. NH4+ + NO3−), δ15N-NH4+, and δ15N-NO3− (). However, there was no significant correlation between moss δ15N and the ratio of ammonium to nitrate (NH4+/NO3−) in this study ().
4. Discussion
4.1. Moss N content for indicating atmospheric N deposition
In this study, the moss N content (1.85%–2.79%) was similar to that of south China— for example, the Yangtze River drainage basin (1.19%–4.05% (Xiao et al. Citation2010a)), Guiyang (1.85%–2.48% (Dong et al. Citation2017), 0.85%–2.97% (Liu et al. Citation2008c)), Changsha (1.80%–4.05% (Xiao et al. Citation2010b)), and Nanchang (1.61%–4.64% (Xiao et al. Citation2010b)). However, it was much higher than that of Europe, e.g. 0.76%–1.99% in Austria (Zechmeister et al. Citation2008), 0.41%–1.79% in Finland (Poikolainen et al. Citation2009), and 0.8%–1.6% in 16 European countries (Harmens et al. Citation2011). The moss N content of YYL (1.85%) was higher than that of the background (Gongga Mountain) in China (1.5% (Liu et al. Citation2008b)), indicating that wet N deposition was higher in the YRD. There was a linear relationship between moss N content and wet TN deposition (). The coefficient was higher than that in Guiyang (0.05) (Liu et al. Citation2008b; Xiao et al. Citation2010a) and Europe (0.08) (Harmens et al. Citation2011). This is mainly because previous studies used a bulk N deposition, while only wet N deposition was used in this study. The type of N deposition affects moss N content. Dry deposition can cause a 0.04%–0.07% increase in moss N content for each 1 kg N ha−1 a−1, reaching up to 4% in regions with high dry ammonia (NH3) deposition, while reaching only up to 1.6% in regions with wet deposition (Diaz-Alvarez, Lindig-Cisneros, and de la Barrera Citation2018). This coefficient decreases to a similar value of 0.05, if one estimates that the wet N deposition accounts for 45.5% of the total N deposition in the YRD (Ti et al. Citation2018). Moreover, when the N deposition is less than 20 kg N ha−1 a−1, the moss N content is more sensitive to N deposition (Bragazza et al. Citation2005; Diaz-Alvarez, Lindig-Cisneros, and de la Barrera Citation2018).
As in previous research, the correlation between moss N content and wet NH4+ deposition was stronger than that between moss N content and wet NO3− or TN deposition (Liu et al. Citation2012) (), because NH4+ had a greater effect on moss N content than NO3− or TN. Previous studies have revealed that moss prefers NH4+ and dissolved organic N over NO3− due to an energetic economy; the studies have also revealed the inhibition of nitrate reductase activity by reduced dissolved N (Liu et al. Citation2012; Wiedermann et al. Citation2009). Therefore, it would be better to use moss N content to estimate N deposition in the regions with the dominance of NHx than the dominance of NOy.
4.2. Moss δ15N for indicating main sources of atmospheric N deposition
Previous studies have reported that the two main atmospheric N sources have different δ15N values, with δ15N-NH4+ tending to be negative and δ15N-NO3− tending to be positive (Pearson et al. Citation2000). NHx deposition should be predominant in the YRD according to the lower moss δ15N (−10.21‰ to −1.58‰) and have values similar to the δ15N-NH4+ of wet deposition (−15.00‰ to 0) (). This is similar to the directly measured result that the NH4+/NO3− of atmospheric N deposition was 1.5 in this region (Chen et al. Citation2019; Ti et al. Citation2018). Moreover, there was a significant negative linear relationship between moss δ15N and NH4+/NO3− in western Germany (Solga et al. Citation2005) and in the Yangtze River drainage basin of China (Xiao et al. Citation2010a). However, there was no significant correlation between the δ15N of moss and NH4+/NO3− (), which was similar to that in 11 European countries (Bragazza et al. Citation2005). Moreover, there was no significant correlation between moss δ15N and NH4+/NO3− when using all the data ()). Therefore, more monitoring data are needed to verify the relationship between moss δ15N and NH4+/NO3−, and moss δ15N should be used with caution while determining component of wet N deposition.
More positive δ15N values were observed in urban mosses in the YRD (−3.41‰ to −1.58‰), which is similar to that of urban Changsha in China (−6.75‰ to 1.94‰) (Xiao et al. Citation2010b) and the center of the Ferrara municipality in Italy (−5.27‰ to 1.62‰) (Gerdol et al. Citation2002). Many previous monitoring-based studies have indicated that the main source of atmospheric N deposition is fossil fuel combustion and vehicle emissions in urban areas (Wang et al. Citation2017). Furthermore, Pearson et al. (Citation2000) found a very good correlation between moss δ15N and traffic exposure, where the average δ15N of moss near busy urban roads is +3.66‰ (−1‰ to +6‰). The mean moss δ15N in suburban areas (−6.14‰ ± 2.85‰) was found to be close to that near farm buildings in the vicinity of poultry or cattle pens (−7.8‰ (Pearson et al. Citation2000)) and the Guiyang urban site (−6.5‰ ± 1.1‰ (Liu et al. Citation2008b)) with atmospheric N deposition primarily from sewage and wastes. More negative moss δ15N values in suburban areas indicate the contribution of NH3 from untreated sewage and wastes, whereas the relatively less negative moss δ15N values in rural areas mainly come from agricultural NH3 (). The moss δ15N in rural areas (−3.81‰ ± 1.84‰) was similar to that in rural Nanchang (−3.1‰ ± 2.2‰) and Changsha (−4.7‰ ± 1.1‰) (Xiao et al. Citation2010b). Previous emission inventory studies have indicated that synthetic fertilizer application contributed 33%–40% of the total NH3 emissions in the YRD (Fu et al. Citation2013). In addition, small farms and poultry breeding households, which are very common in Chinese small villages, were considered an important source of NH3 in the rural areas (Fu et al. Citation2013). Therefore, the δ15N of moss can be used as an indicator of the sources of atmospheric wet N deposition.
5. Conclusions
The directly measured moss N content and wet N deposition rate demonstrates that wet N deposition can be estimated by the N content of Haplocladium microphyllum in a region with different land-use types. Moss N content significantly decreased from urban (2.72% ± 0.07%) to suburban (2.41% ± 0.07%) to rural (2.05% ± 0.27%) areas, and the trend was similar with wet N deposition rate across the three types of land use. Moss δ15N values can effectively decipher sources of wet N deposition. More negative δ15N of suburban (−6.14‰ ± 2.85‰) and rural (−3.81‰ ± 1.84‰) mosses indicated N mainly released from agriculture and effluent, while the less negative δ15N of urban (−2.35‰ ± 0.77‰) mosses were mainly influenced by fossil fuel combustion and traffic emissions. The negative moss δ15N indicated that the main form in the N deposition was NHx in the YRD. However, more monitoring data are needed to verify the relationship between moss δ15N and NH4+/NO3− of N deposition in the future.
Supplemental Material
Download PDF (111.8 KB)Acknowledgments
We sincerely thank Hejuan ZHAO at Tongshan and Sheng JIANG at Yuyangli stations for their contributions to the rainfall sampling.
Disclosure statement
No potential conflict of interest was reported by the authors.
Supplementary material
Supplemental data for this article can be access here.
Additional information
Funding
Related Research Data
References
- Bateman, A., and S. Kelly. 2007. “Fertilizer Nitrogen Isotope Signatures.” Isotopes in Environmental and Health Studies 43 (3): 237–247. doi:10.1080/10256010701550732.
- Bragazza, L., J. Limpens, R. Gerdol, P. Grosvernier, M. Hajek, T. Hajek, P. Hajkova, et al. 2005. “Nitrogen Concentration and δ15N Signature of Ombrotrophic Sphagnum Mosses at Different N Deposition Levels in Europe.” Global Change Biology 11 (1): 106–114. doi:10.1111/j.1365-2486.2004.00886.x.
- Chen, Z., T. Huang, X. Huang, X. Han, H. Yang, Z. Cai, L. Yao, X. Han, M. Zhang, and C. Huang. 2019. “Characteristics, Sources and Environmental Implications of Atmospheric Wet Nitrogen and Sulfur Deposition in Yangtze River Delta.” Atmospheric Environment 219: 116904. doi:10.1016/j.atmosenv.2019.116904.
- Christie, P. 1987. “Nitrogen in Two Contrasting Antarctic Bryophyte Communities.” Journal of Ecology 75: 73–93. doi:10.2307/2260537.
- Diaz-Alvarez, E., R. Lindig-Cisneros, and E. de la Barrera. 2018. “Biomonitors of Atmospheric Nitrogen Deposition: Potential Uses and Limitations.” Conservation Physiology 6 (1): 1–11. doi:10.1093/conphys/coy011.
- Dong, Y., X. Liu, X. Sun, W. Song, X. Zheng, R. Li, and C. Liu. 2017. “Inter-species and Intra-annual Variations of Moss Nitrogen Utilization: Implications for Nitrogen Deposition Assessment.” Environmental Pollution 230: 506–515. doi:10.1016/j.envpol.2017.06.058.
- Elliott, E., Z. Yu, A. Cole, and J. Coughlin. 2019. “Isotopic Advances in Understanding Reactive Nitrogen Deposition and Atmospheric Processing.” Science of the Total Environment 662: 393–403. doi:10.1016/j.scitotenv.2018.12.177.
- Freyer, H. 1978. “Seasonal Trends of NH4+ and NO3− Nitrogen Isotope Composition in Rain Collected at Jülich, Germany.” Tellus 30: 83–92. doi:10.3402/tellusa.v30i1.10319.
- Fu, X., S. Wang, B. Zhao, J. Xing, Z. Cheng, H. Liu, and J. Hao. 2013. “Emission Inventory of Primary Pollutants and Chemical Speciation in 2010 for the Yangtze River Delta Region, China.” Atmospheric Environment 70: 39–50. doi:10.1016/j.atmosenv.2012.12.034.
- Galloway, J., A. Townsend, J. Erisman, M. Bekunda, Z. Cai, J. Freney, L. Martinelli, S. Seitzinger, and M. Sutton. 2008. “Transformation of the Nitrogen Cycle: Recent Trends, Questions, and Potential Solutions.” Science 320 (5878): 889–892. doi:10.1126/science.1136674.
- Gerdol, R., L. Bragazza, R. Marchesini, A. Medici, P. Pedrini, S. Benedetti, A. Bovolenta, and S. Coppi. 2002. “Use of Moss (Tortula Muralis hedw.) For Monitoring Organic and Inorganic Air Pollution in Urban and Rural Sites in Northern Italy.” Atmospheric Environment 36 (25): 4069–4075. doi:10.1016/S1352-2310(02)00298-4.
- Gu, B., X. Ju, J. Chang, Y. Ge, and P. Vitousek. 2015. “Integrated Reactive Nitrogen Budgets and Future Trends in China.” Proceedings of the National Academy of Sciences of the United States of America 112 (28): 8792–8797. doi:10.1073/pnas.1510211112.
- Harmens, H., D. Norris, D. Cooper, G. Mills, E. Steinnes, E. Kubin, L. Thoni, et al. 2011. “Nitrogen Concentrations in Mosses Indicate the Spatial Distribution of Atmospheric Nitrogen Deposition in Europe.” Environmental Pollution 159 (10): 2852–2860. doi:10.1016/j.envpol.2011.04.041.
- Harmens, H., E. Schnyder, L. Thoni, D. Cooper, G. Mills, S. Leblond, K. Mohr, et al. 2014. “Relationship between Site-Specific Nitrogen Concentrations in Mosses and Measured Wet Bulk Atmospheric Nitrogen Deposition across Europe.” Environmental Pollution 194 :50–59. doi:10.1016/j.envpol.2014.07.016.
- Liu, X., K. Koba, C. Liu, X. Li, and M. Yoh. 2012. “Pitfalls and New Mechanisms in Moss Isotope Biomonitoring of Atmospheric Nitrogen Deposition.” Environmental Science & Technology 46 (22): 12557–12566. doi:10.1021/es300779h.
- Liu, X., K. Koba, A. Makabe, X. Li, M. Yoh, and C. Liu. 2013b. “Ammonium First: Natural Mosses Prefer Atmospheric Ammonium but Vary Utilization of Dissolved Organic Nitrogen Depending on Habitat and Nitrogen Deposition.” New Phytologist 199 (2): 407–419. doi:10.1111/nph.12284.
- Liu, X., H. Xiao, C. Liu, Y. Li, and H. Xiao. 2008a. “Atmospheric Transport of Urban-derived NH(x): Evidence from Nitrogen Concentration and δ15N in Epilithic Mosses at Guiyang, SW China.” Environmental Pollution 156 (3): 715–722. doi:10.1016/j.envpol.2008.06.011.
- Liu, X., H. Xiao, C. Liu, Y. Li, and H. Xiao. 2008b. “Stable Carbon and Nitrogen Isotopes of the Moss Haplocladium Microphyllum in an Urban and a Background Area (SW china): The Role of Environmental Conditions and Atmospheric Nitrogen Deposition.” Atmospheric Environment 42 (21): 5413–5423. doi:10.1016/j.atmosenv.2008.02.038.
- Liu, X., H. Xiao, C. Liu, Y. Li, and H. Xiao. 2008c. “Tissue N Content and 15N Natural Abundance in Epilithic Mosses for Indicating Atmospheric N Deposition in the Guiyang Area, SW China.” Applied Geochemistry 23 (9): 2708–2715. doi:10.1016/j.apgeochem.2008.06.002.
- Liu, X., Y. Zhang, W. Han, A. Tang, J. Shen, Z. Cui, P. Vitousek, et al. 2013a. “Enhanced Nitrogen Deposition over China.” Nature 494 (7438): 459–462. doi:10.1038/nature11917.
- Lu, C., and H. Tian. 2014. “Half-century Nitrogen Deposition Increase across China: A Gridded Time-series Data Set for Regional Environmental Assessments.” Atmospheric Environment 97: 68–74. doi:10.1016/j.atmosenv.2014.07.061.
- Pearson, J., D. Wells, K. Seller, A. Bennett, A. Soares, J. Woodall, and M. Ingrouille. 2000. “Traffic Exposure Increases Natural 15N and Heavy Metal Concentrations in Mosses.” New Phytologist 147: 317–326. doi:10.1046/j.1469-8137.2000.00702.x.
- Poikolainen, J., J. Piispanen, J. Karhu, and E. Kubin. 2009. “Long-term Changes in Nitrogen Deposition in Finland (1990–2006) Monitored Using the Moss Hylocomium Splendens.” Environmental Pollution 157 (11): 3091–3097. doi:10.1016/j.envpol.2009.05.018.
- Qu, L., H. Xiao, H. Guan, Z. Zhang, and Y. Xu. 2016. “Total N Content and δ15N Signatures in Moss Tissue for Indicating Varying Atmospheric Nitrogen Deposition in Guizhou Province, China.” Atmospheric Environment 142: 145–151. doi:10.1016/j.atmosenv.2016.07.044.
- Solga, A., J. Burkhardt, H. Zechmeister, and J. Frahm. 2005. “Nitrogen Content, 15N Natural Abundance and Biomass of the Two Pleurocarpous Mosses Pleurozium Schreberi (Brid.) Mitt. And Scleropodium Purum (Hedw.) Limpr. In Relation to Atmospheric Nitrogen Deposition.” Environmental Pollution 134 (3): 465–473. doi:10.1016/j.envpol.2004.09.008.
- Ti, C., B. Gao, Y. Luo, S. Wang, S. Chang, and X. Yan. 2018. “Dry Deposition of N Has a Major Impact on Surface Water Quality in the Taihu Lake Region in Southeast China.” Atmospheric Environment 190: 1–9. doi:10.1016/j.atmosenv.2018.07.017.
- Wang, Y., X. Liu, W. Song, W. Yang, B. Han, X. Dou, X. Zhao, Z. Song, C. Liu, and Z. Bai. 2017. “Source Appointment of Nitrogen in PM2.5 Based on Bulk δ15N Signatures and a Bayesian Isotope Mixing Model.” Tellus B: Chemical and Physical Meteorology 69 (1): 1299672. doi:10.1080/16000889.2017.1299672.
- Wiedermann, M., U. Gunnarsson, L. Ericson, and A. Nordin. 2009. “Ecophysiological Adjustment of Two Sphagnum Species in Response to Anthropogenic Nitrogen Deposition.” New Phytologist 181 (1): 208–217. doi:10.1111/j.1469-8137.2008.02628.x.
- Xiao, H., C. Tang, H. Xiao, X. Liu, and C. Liu. 2010a. “Mosses Indicating Atmospheric Nitrogen Deposition and Sources in the Yangtze River Drainage Basin, China.” Journal of Geophysical Research 115: D14301. doi:10.1029/2009jd012900.
- Xiao, H., C. Tang, H. Xiao, X. Liu, and C. Liu. 2010b. “Stable Sulphur and Nitrogen Isotopes of the Moss Haplocladium Microphyllum at Urban, Rural and Forested Sites.” Atmospheric Environment 44 (34): 4312–4317. doi:10.1016/j.atmosenv.2010.05.023.
- Zechmeister, H., R. Andreas, S. Stefan, H. Daniela, R. Ingrid, M. Sabine, and W. Wolfgang. 2008. “Total Nitrogen Content and δ15N Signatures in Moss Tissue: Indicative Value for Nitrogen Deposition Patterns and Source Allocation on a Nationwide Scale.” Environmental Science & Technology 42 (23): 8661–8667. doi:10.1021/es801865d.
- Zhang, P., T. Wen, J. Zhang, and Z. Cai. 2017. “On Improving the Diffusion Method for Determination of δ15N-NH4+ and δ15N-NO3− in Soil Extracts.” Acta Pedologica Sinica 54 (4): 948–957.
- Zhu, J., N. He, Q. Wang, G. Yuan, D. Wen, G. Yu, and Y. Jia. 2015. “The Composition, Spatial Patterns, and Influencing Factors of Atmospheric Wet Nitrogen Deposition in Chinese Terrestrial Ecosystems.” Science of the Total Environment 511: 777–785. doi:10.1016/j.scitotenv.2014.12.038.