
ABSTRACT
As one of the regions with intensive agriculture and rapid economic development in China, North China also has a high nitrogen (N) deposition. This study characterized the spatial pattern of N deposition in North China, combining the tropospheric columns from satellite measurements and the simulated profiles from an atmospheric chemistry transport model. The total N deposition fluxes ranged from 16.3 to 106.5 kg N ha−1 yr−1, with an average of 54.5 ± 17.2 kg N ha−1 yr−1. The high values were concentrated in urban and farmland areas, while low values were found in forests and grasslands with less human activities. Of the total N deposition, 36% was deposited via precipitation, 12% was deposited through dry particulate deposition, and the remaining 52% was comprised of dry gaseous deposition. For the seasonal variation of dry deposition, gaseous HNO3 and particulate NO3− were higher in winter and autumn, but lower in spring and summer. In contrast, gaseous NH3 and particulate NH4+ were higher in spring and summer, but lower in winter and autumn. This is possibly caused by the seasonal differences in emission intensity between NOx and NH3 emission sources. The gaseous NO2 deposition did not show strong seasonal variation. The wet deposition was mainly affected by precipitation, with high values in summer and low values in winter. This research provides an objective spatial perspective and insight into the total N deposition in North China.
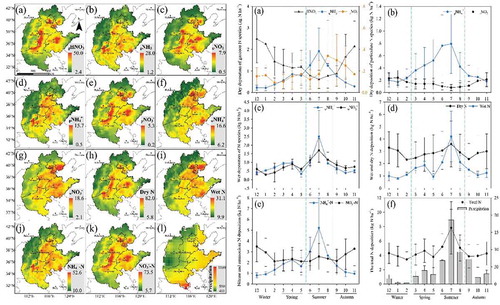
GRAPHICAL ABSTRACT
摘要
作为农业集约化和经济快速发展的地区之一, 华北地区较高的氮沉降不容忽视。本文利用卫星观测的对流层柱浓度和大气化学传输模型模拟的剖面信息, 研究了华北地区氮沉降的空间格局和季节特征。结果表明, 华北地区总氮沉降通量为16.3–106.5 kg N ha−1 yr−1, 平均为54.5 ± 17.2 kg N ha−1 yr−1。高值区主要集中在城市和农田, 低值区主要集中在人类活动较少的森林和草地。在总氮沉降量中, 湿沉降量占36%;颗粒物干沉降量占12%;气态干沉降占52%。对于干沉降来说, 气态HNO3和颗粒物NO3−在冬季和秋季较高, 春季和夏季较低。与之相反, 气态NH3和颗粒物NH4+在春季和夏季较高, 冬季和秋季较低。这可能是NOx和NH3排放源和排放强度的季节差异造成的。另外, 气态NO2沉降没有明显的季节变化。湿沉降主要受降水影响, 呈现夏季高, 冬季低的季节变化。本研究为华北地区总氮沉降提供了客观的空间格局和季节特征的见解。
1. Introduction
The global nitrogen (N) cycle has been accelerated by human activities through fertilizer production, fossil fuel combustion, and N-fixing legumes (Galloway et al. Citation2008). With dramatic industrialization and urbanization, anthropogenic reactive N (NOx = NO + NO2, and NH3) emissions increased from 34 Tg N yr−1 in 1860 to 109 Tg N yr−1 in 2010 (Fowler et al. Citation2013). Recently, China has become one of the hotspots of N deposition on a global scale (Liu et al. Citation2013). Enhanced N deposition may pose a significant influence on sensitive ecosystems, such as N saturation, eutrophication, a loss of biodiversity, and soil acidification (Liu et al. Citation2011).
North China comprises Beijing, Tianjin, Hebei, Henan, Shandong, and Shanxi provinces and is characterized by large population densities, intensive agriculture, and highly developed industries and transport systems. With the rapid development of the economy and agriculture, many studies have demonstrated high levels of N deposition and air pollution by particulate matter in this region (Pan et al. Citation2012; Xu et al. Citation2015). Pan et al. (Citation2012) reported that the average total N deposition in North China at 10 sites was 60.6 ± 19.6 kg N ha−1 yr−1, with a range from 28.5 to 100.4 kg N ha−1 yr−1. Xu et al. (Citation2015) reported that the overall average total N deposition was 56.2 ± 14.8 kg N ha−1 yr−1. However, due to the limited number and uneven distribution of monitoring sites, it is difficult to obtain the spatial distribution of N deposition and accurately evaluate the average N deposition through ground measurements alone. This study tries to expand the ground-based N deposition at monitoring sites to a regional scale.
Remote-sensing technology provides a new means to estimate N deposition on a regional scale due to its advantages of high spatial and temporal resolutions and has been used in environmental studies and to support emission control policies (Lu et al. Citation2013; Chen, Feng, and Zhang Citation2017). However, satellite NH3 and NO2 measurements can only provide columns, without the vertical distributions of these columns (from the ground to the top of the atmosphere). Fortunately, detailed NH3 and NO2 profile information can be obtained from chemical transport models (CTMs) (Luo et al. Citation2015). Thus, the total N deposition fluxes in North China can be estimated with an inferential model, based on the ground NO2 and NH3 concentrations estimated from tropospheric NO2 and NH3 columns from satellite instruments, the simulation of NO2 and NH3 profiles, and the dry deposition velocity (Vd).
Recently, Jia et al. (Citation2016) estimated dry N deposition through a linear regression model between ground measurements and satellite NO2 columns from the ozone monitoring instrument (OMI). However, the estimated NO3− deposition was much lower than the lowest ground measurements at Chinese Nationwide Nitrogen Deposition Monitoring Network sites since NO3− concentrations have no direct relationship with NO2 columns (Liu et al. Citation2017d). Nowlan et al. (Citation2014) estimated the global NO2 dry deposition flux through a calibration of simulated NO2 deposition from the GEOS-Chem model by satellite observations. However, their study had no validation in China and produced results that were much lower than those reported by Jia et al. (Citation2016). The present work uses an inferential model to generate maps of inorganic N deposition and then uses ground measurements to validate those results. Our aim is to obtain an overall insight into the spatial and seasonal variations of total N deposition based on the method mentioned above and to guide monitoring plans in the future in North China.
2. Data and methods
2.1. Data
The tropospheric NO2 columns were retrieved from the OMI (http://www.temis.nl/airpollution/no2.html), with a spatial resolution of 0.125° × 0.125°. The tropospheric NH3 columns were retrieved from IASI (http://www.ulb.ac.be/cpm/atmosphere.html), with a horizontal resolution of 0.25° × 0.25°. The NO2 and NH3 profiles were obtained using the Model for Ozone and Related Chemical Tracers, version 4 (MOZART-4), CTM. The land-use map was obtained from http://www.globallandcover.com. The monthly precipitation data in 2012 were obtained from the China Meteorological Administration, with a spatial resolution of 0.5° × 0.5°. The monthly Vd over China was calculated based on the CMAQ CTM, version 4.5.1, and the MM5 mesoscale meteorological model, version 3.7 (Chen et al. Citation2007). More detailed data information is provided in Section S1 of the supplementary material.
2.2. Methods
For dry deposition, a regression model was established by using ground NO2 and NH3 concentrations and monitoring data to obtain the ground gaseous HNO3 and particulate NO3− and NH4+ concentrations, which cannot be directly observed by satellites. Then, the five components of dry deposition could be calculated using the corresponding ground concentrations and Vd. The Vd can be simulated using the big-leaf model, which has been widely applied in atmospheric CTMs (Pan et al. Citation2012; Xu et al. Citation2015). The steps of this calculation are presented in Figure S1(a).
For wet deposition, the contribution of NO2 to the dissolved NO3−-N in precipitation is very limited because NO2 is not directly very soluble. Related studies have shown that most of the wet NO3−-N in precipitation originates from HNO3 and aerosol nitrate (NO3−) (Ervens Citation2015; Sutton et al. Citation2011). First, we retrieved the HNO3 and NO3− columns by using OMI NO2 columns and the relationship of NO2, HNO3, and NO3− columns from MOZART-4. Then, a statistical model was established based on the monitoring of wet nitrate deposition, the HNO3 and NO3− columns, and the precipitation amount. Finally, the monthly wet nitrate deposition was estimated via the constructed model. Wet ammonium deposition was estimated by a similar method. The steps of this calculation are presented in Figure S1(b).
The inferential model established in this study is the same as that employed in Liu et al. (Citation2017a, Citation2017b, Citation2017c, Citation2017d), and Zhang et al. (Citation2017). More detailed methodological information is provided in Section S2 of the supplementary material.
3. Results and discussion
3.1. Accuracy assessment of the estimated N deposition
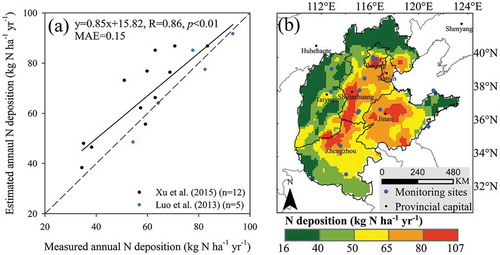
We used 17 ground-based monitoring sites to assess the accuracy of the estimated N deposition flux in North China (Luo et al. Citation2013; Xu et al. Citation2015). The measured annual N deposition ranged from 34.4 to 93.3 kg N ha−1 yr−1, with an average of 62.1 kg N ha−1 yr−1. The estimated annual N deposition ranged from 38.4 to 91.7 kg N ha−1 yr−1, with an average of 67.8 kg N ha−1 yr−1. Both the ranges and averages of the measured and estimated values were close. The correlation between the estimated and measured annual N deposition was 0.86 (p< 0.01), with a mean absolute error of 0.15 ()). All of this indicated that the constructed model could be used to estimate the N deposition on a regional scale.
Figure 1. (a) Comparison between the measured and estimated annual N deposition and (b) the spatial distribution of N deposition.
3.2. Spatial distribution of N species deposition
The spatial distribution of N deposition is shown in ). The N deposition fluxes ranged from 16.3 to 106.5 kg N ha−1 yr−1, with an average of 54.5 ± 17.2 kg N ha−1 yr−1. This result is very close to the average total N deposition of 56.2 ± 14.8 kg N ha−1 yr−1 based on 13 sites in North China (Xu et al. Citation2015). Comparing with Figure S2, we can see that the areas with high N deposition (>50 kg N ha−1 yr−1) were highly consistent with urban and builtup areas and farmland, which were the main emission sources of NOx and NH3. In addition, the areas with highest N deposition (>80 kg N ha−1 yr−1) were dotted (such as the megacities of Beijing and Jinan) or zonal (such as the city belt from Shijiazhuang to Zhengzhou); the lowest N deposition areas (<40 kg N ha−1 yr−1) were mostly concentrated in forests and grasslands (Figure S2). This spatial distribution of N deposition is consistent with the conclusions reported by Xu et al. (Citation2018) based on ground monitoring; that is, the total N deposition in urban areas is higher than that in rural areas, and that in rural areas is higher than at background sites.
The average dry N deposition in North China was 34.8 ± 13.9 kg N ha−1 yr−1 (Figure S3(h)). This result is very close to the ground-monitoring results of 36.7 and 31.9 kg N ha−1 yr−1 reported by Pan et al. (Citation2012) and Xu et al. (Citation2015), respectively (Table S1). Among the components of dry deposition, the spatial distributions of gHNO3, gNO2, pNO3− (Figure S3(a, c, e)) deposition are similar and highly consistent with that of NO3−-N deposition (Figure S3(k)); plus, the spatial distributions of gNH3 and pNH4+ (Figure S3(b, d)) deposition are also similar and consistent with that of NH4+-N deposition (Figure S3(j)). The similarity and consistency are determined by the spatial pattern of NOx and NH3 emission sources from the Emission Database for Global Atmospheric Research (https://edgar.jrc.ec.europa.eu/). Generally, NOx emissions come from power plants, industry, and transportation, which are concentrated in urban and suburban areas (Wang et al. Citation2012). NH3 emissions mainly come from N fertilizer volatilization of farmland and livestock production, which is concentrated in rural areas far from urban areas (Galloway et al. Citation2004; Shen et al. Citation2018).
The average wet N deposition in North China was 19.7 ± 4.1 kg N ha−1 yr−1 (Figure S3(i)). This result is comparable to the ground-monitoring results of 23.9 and 24.6 kg N ha−1 yr−1 reported by Pan et al. (Citation2012) and Xu et al. (Citation2015), respectively (Table S1). Among the components of wet deposition, the spatial distributions of wNH4+ and wNO3− deposition (Figure S3(f, g)) are not completely consistent with those of NH4+-N and NO3−-N deposition (Figure S3(j, k)). The main reason is that the spatial distribution of wet deposition is affected by emission sources and precipitation. Pan et al. (Citation2012) reported a positive relationship between monthly wet N deposition and precipitation. The areas in this region, where the annual rainfall (Figure S3(l)) is higher than 580 mm (average precipitation), are mainly near the eastern coast. This corresponds to the high wet N deposition area (except for eastern Shangdong Province) (Figure S3(i)). The main reason for the low wet N deposition of eastern Shandong Province may be the low emission sources.
Due to the different emission sources of NOx and NH3, the spatial patterns of atmospheric NH4+-N deposition and NO3−-N deposition are different. The primary sources for NH3 are intensive agricultural production, such as domestic animals and N fertilizer application (Galloway et al. Citation2004). The high NH4+-N deposition was mainly scattered in agricultural areas in the suburbs of cities, such as the west of Jinan, northwest of Zhengzhou, and south of Beijing (Figure S3(j)). However, NOx comes mostly from industry, power plants, and transportation (Wang et al. Citation2012). The high NO3−-N deposition was mainly distributed in points (Beijing and Tianjin), in a triangular area (Jinan and its two eastern cities), and along a city belt (from Shijiazhuang to Zhengzhou) (Figure S3(k)). Interestingly, the spatial distribution of NO3−-N (Figure S3(k)) was very similar to that of total N deposition ()), mainly because NO3−-N dominates in this region, accounting for 57% of the total N deposition.
3.3. Seasonal variation of dry and wet N deposition
The monthly dry N deposition flux ranged from 0.21 to 1.92 kg N ha−1/month for gNH3 and from 0.17 to 0.79 kg N ha−1/month for pNH4+ (). The seasonal variation of gNH3 and pNH4+ deposition is in agreement with NH3 emissions (Liu et al. Citation2017d), for which the highest concentrations occurred in summer, followed by spring, autumn, and winter. The dominant cropping system in this region is a winter wheat–summer maize rotation. Farmers usually apply N fertilizers (mainly as urea and ammonium bicarbonate) in March–April, June–August, and October (Xu et al. Citation2015). In addition, high temperatures in summer will favor ammonia volatilization from fertilizers, animal waste, city garbage, farmers’ toilets, and vehicles (Pan et al. Citation2013). Therefore, the gNH3 and pNH4+ deposition in summer and spring is significantly higher than that in autumn and winter. However, a previous study showed that the pNH4+ deposition flux was higher in winter due to high NOx and SO2 concentrations caused by the formation of secondary ammonium aerosols (Shen et al. Citation2011). This difference indicates that pNH4+ deposition is dependent on variable emissions, deposition velocity, and meteorological conditions.
Figure 2. Seasonal variations of the atmospheric deposition flux of N species in North China.
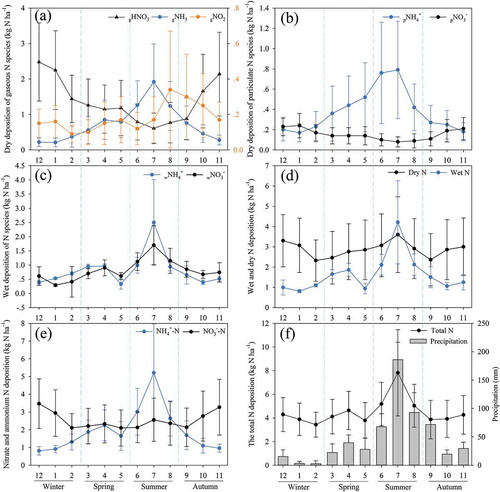
The monthly dry N deposition flux ranged from 0.61 to 2.48 kg N ha−1/month for gHNO3, from 0.09 to 0.34 kg N ha−1/month for gNO2, and from 0.08 to 0.24 kg N ha−1/month for pNO3− (). The gHNO3 and pNO3− showed their highest values in winter, and then in autumn and spring, with minimum values in summer. The consumption of coal or wood for heating and cooking in this region can lead to large NOx emissions, subsequently causing high concentrations of NOx in winter (Yang et al. Citation2010) and further contributing to pNO3− (Shen et al. Citation2013); then, HNO3 is removed by precipitation (Liu, Zhang, and Lu Citation2016). The gNO2 deposition showed no obvious seasonal variation. Generally, high temperatures in summer can increase the transformation of gNO2 to gHNO3 (Lamsal et al. Citation2008). Both the emissions and atmospheric conditions determine the seasonal variations of NO2 concentrations. In addition, the seasonal variations in NO2 deposition velocities are different under different land surface conditions (Nowak, Crane, and Stevens Citation2006). All the above factors determine the seasonal variations of gNO2 deposition. The variations of monthly gNO2 deposition are in agreement with the findings of Zhang et al. (Citation2017), who showed that the peak value occurred in August and the lowest value in February.
The monthly wet N deposition flux ranged from 0.33 to 2.50 kg N ha−1/month for wNH4+ and from 0.29 to 1.70 kg N ha−1/month for wNO3− ()). The seasonal variations of those two N species were in agreement with the variations of precipitation, which showed that the highest value occurred in summer. The wNH4+ and wNO3− in summer accounted for 45% and 41% of the annual wNH4+ and wNO3− deposition, respectively. Correspondingly, precipitation in summer ()) accounted for 60% of the annual precipitation in this region. This indicates that precipitation is an influential factor for the seasonal variations of wet N deposition (Pan et al. Citation2012). Of course, wet N deposition is also related to the seasonal variations of NOx and NH3 emissions. For example, the wNH4+ deposition flux (2.50 kg N ha−1/month) in July was significantly higher than the wNO3− deposition flux (1.70 kg N ha−1/month), which is closely related to ammonia volatilization from N fertilizers.
The monthly dry and wet N deposition flux ranged from 2.30 to 3.57 kg N ha−1/month for dry N deposition and from 0.82 to 4.20 kg N ha−1/month for wet N deposition ()). Overall, the monthly dry N deposition was higher than the monthly wet N deposition (except for July), indicating that dry deposition (64% of the annual N deposition) was the dominant form of N deposition in this region. The proportion is slightly higher than the results of 61% reported by Pan et al. (Citation2012) and 57% reported by Xu et al. (Citation2015).
3.4. Seasonal variation of NH4+-N and NO3−-N deposition
The monthly ammonium (sum of gNH3, pNH4+, and wNH4+) and nitrate (sum of gNO2, gHNO3, pNO3−, and wNO3−) N deposition flux ranged from 0.81 to 5.21 kg N ha−1/month for NH4+-N deposition and from 2.10 to 3.47 kg N ha−1/month for NO3−-N deposition ()). In general, the monthly NO3−-N deposition was higher than the monthly NH4+-N deposition (except for summer), indicating that NO3−-N deposition (57% of the annual N deposition) is the main form of N deposition in this region. The NH4+-N deposition was higher in spring and summer and lower in autumn and winter. On the contrary, the NO3−-N deposition was higher in autumn and winter and lower in spring and summer. This is consistent with seasonal variations in the sources and intensity of NOx and ammonia emissions. Ammonia mainly comes from agricultural fertilizer ammonia volatilization (usually applied in spring and summer) (Shen et al. Citation2009), in addition to industry, power plants, and transportation, and domestic heating, which are also important sources of NOx emissions (Shen et al. Citation2013).
The monthly N deposition flux ranged from 3.41 to 7.77 kg N ha−1/month ()). Comparing with ), we can see that the variational trend of N deposition in spring and summer was consistent with that of NH4+-N deposition, while the variational trend of N deposition in winter and autumn was consistent with that of NO3−-N deposition. This is closely related to the sources and intensity of NOx and ammonia emissions mentioned above. The results show that NH4+-N deposition dominates in summer, while NO3–N deposition dominates in other seasons in this region. The extreme points of monthly N deposition fluxes are December, April, and July, respectively, and the NO3−-N/NH4+-N deposition flux ratio in December, April, and July is 4.3, 1.0, and 0.5, respectively. It also reflects the seasonal variation trend of NOx and NH3 emissions.
4. Conclusions
This study estimates the total N deposition flux in North China to range from 16.3 to 106.5 kg N ha−1 yr−1, with an average of 54.5 ± 17.2 kg N ha−1 yr−1. High N deposition fluxes are mainly concentrated in urban and agricultural land areas, especially in urban and built-up land, while low N deposition fluxes are mainly found in forest and grassland areas, which are less affected by human activities. The gHNO3 and pNO3− deposition shows a clear seasonal variation, with high deposition occurring in winter and spring and low deposition appearing in summer and autumn. On the contrary, gNH3 and pNH4+ show high deposition in summer and autumn and low deposition in winter and spring. The gNO2 deposition did not show a strong seasonal pattern, with high values from August to October and low ones in February. The seasonal variations of wNH4+ and wNO3− deposition are significantly influenced by precipitation, and the maximum values appear in autumn (especially in July). The maximum value of total N deposition was found to occur in summer, while the difference in N deposition between winter, spring, and autumn was not significant.
Satellite-retrieved N deposition is helpful to assess the status of N deposition without ground measurements, and the results presented here provide a basis for the formulation of a satellite-based N deposition monitoring program in China in the future. In addition, the generated spatial and seasonal patterns of atmospheric N deposition in North China provide basic information for evaluating the influence of N enrichment on regional biogeochemical cycles, such as in forests, grasslands, and farmland ecosystems. However, there are uncertainties in our inference model, such as the input data, the CTM, the Vd, and the constructed model itself. Therefore, in addition to overcoming these existing difficulties, future research should focus on satellite inversions of N deposition with higher spatial and temporal resolutions. Such data could be used to identify hotspots of N deposition and provide powerful means for government supervision.
Supplemental Material
Download PDF (1.2 MB)Acknowledgments
The authors acknowledge the use of OMI NO2 columns (http://www.temis.nl/) and IASI NH3 columns (http://www.ulb.ac.be/cpm/atmosphere.html), NO2 and NH3 profiles from MOZART-4 (http://www.acd.ucar.edu/wrf-chem/mozart.shtml), and the land-use map of China (http://www.globallandcover.com).
Data availability
The data used are listed in the tables and supplementary material. All other data are archived at Nanjing University and may be obtained from X. Y. Zhang ([email protected] or [email protected]) upon request.
Disclosure statement
No potential conflict of interest was reported by the authors.
Supplementary material
Supplemental data for this article can be accessed here.
Additional information
Funding
Related Research Data
References
- Chen, D. M., Y. Feng, and X. Y. Zhang. 2017. “Comparison of Variability and Change Rate in Tropospheric NO2 Column Obtained from Satellite Products across China during 1997–2015.” International Journal of Digital Earth 10: 814–828. doi:10.1080/17538947.2016.1252435.
- Chen, D. S., S. Y. Cheng, L. Liu, T. Chen, and X. R. Guo. 2007. “An Integrated MM5-CMAQ Modeling Approach for Assessing Trans-boundary PM10 Contribution to the Host City of 2008 Olympic Summer games-Beijing, China.” Atmospheric Environment 41: 1237–1250. doi:10.1016/j.atmosenv.2006.09.045.
- Ervens, B. 2015. “Modeling the Processing of Aerosol and Trace Gases in Clouds and Fogs.” Chemical Reviews 115: 4157–4198. doi:10.1021/cr5005887.
- Fowler, D., J. A. Pyle, J. A. Raven, and M. A. Sutton. 2013. “The Global Nitrogen Cycle in the Twenty-first Century: Introduction.” Philosophical Transactions: Biological Sciences 368: 1–2. doi:10.1098/rstb.2013.0164.
- Galloway, J. N., F. J. Dentener, D. G. Capone, E. W. Boyer, R. W. Howarth, S. P. Seitzinger, G. P. Asner, et al. 2004. “Nitrogen Cycles: Past, Present, and Future.” Biogeochemistry 70: 153–226. doi:10.1007/s10533-004-0370-0.
- Galloway, J. N., A. R. Townsend, J. W. Erisman, M. Bekunda, Z. Cai, J. R. Freney, L. A. Martinelli, S. P. Seitzinger, and M. A. Sutton. 2008. “Transformation of the Nitrogen Cycle: Recent Trends, Questions, and Potential Solutions.” Science 320: 889–892. doi:10.1126/science.1136674.
- Jia, Y. L., G. R. Yu, Y. N. Gao, N. P. He, Q. F. Wang, C. C. Jiao, and Z. Yao. 2016. “Global Inorganic Nitrogen Dry Deposition Inferred from Ground- and Space-based Measurements.” Scientific Reports 6: 19810. doi:10.1038/srep19810.
- Lamsal, L. N., R. V. Martin, A. van Donkelaar, M. Steinbacher, E. A. Celarier, E. Bucsela, E. J. Dunlea, and J. P. Pinto. 2008. “Ground-level Nitrogen Dioxide Concentrations Inferred from the Satellite-borne Ozone Monitoring Instrument.” Journal of Geophysical Research Atmospheres 113: 1–15. doi:10.1029/2007JD009235.
- Liu, L., X. Y. Zhang, and X. H. Lu. 2016. “The Composition, Seasonal Variation, and Potential Sources of the Atmospheric Wet Sulfur (S) and Nitrogen (N) Deposition in the Southwest of China.” Environmental Science and Pollution Research 23: 6363–6375. doi:10.1007/s11356-015-5844-1.
- Liu, L., X. Y. Zhang, W. Xu, X. J. Liu, D. M. Chen, X. M. Zhang, S. Q. Wang, and W. T. Zhang. 2017a. “Estimation of Monthly Bulk Nitrate Deposition in China Based on Satellite NO2 Measurement by the Ozone Monitoring Instrument.” Remote Sensing of Environment 199: 93–106. doi:10.1016/j.rse.2017.07.005.
- Liu, L., X. Y. Zhang, W. Xu, X. J. Liu, Y. Li, X. H. Lu, Y. H. Zhang, and W. T. Zhang. 2017b. “Temporal Characteristics of Atmospheric Ammonia and Nitrogen Dioxide over China Based on Emission Data, Satellite Observations and Atmospheric Transport Modeling since 1980.” Atmospheric Chemistry and Physics 17: 9365–9378. doi:10.5194/acp-17-9365-2017.
- Liu, L., X. Y. Zhang, W. Xu, X. J. Liu, X. H. Lu, S. Q. Wang, W. T. Zhang, and L. M. Zhao. 2017c. “Ground Ammonia Concentrations over China Derived from Satellite and Atmospheric Transport Modeling.” Remote Sensing 9 (5): 467. doi:10.3390/rs9050467.
- Liu, L., X. Y. Zhang, Y. Zhang, W. Xu, X. J. Liu, X. M. Zhang, and J. L. Feng. 2017d. “Dry Particulate Nitrate Deposition in China.” Environmental Science and Technology 51: 5572–5581. doi:10.1021/acs.est.7b00898.
- Liu, X. J., L. Duan, J. M. Mo, E. Z. Du, J. L. Shen, X. K. Lu, Y. Zhang, X. B. Zhou, C. He, and F. S. Zhang. 2011. “Nitrogen Deposition and Its Ecological Impact in China: An Overview.” Environmental Pollution 159: 2251–2264. doi:10.1016/j.envpol.2010.08.002.
- Liu, X. J., Y. Zhang, W. X. Han, A. Tang, J. L. Shen, Z. L. Cui, P. Vitousek, et al. 2013. “Enhanced Nitrogen Deposition over China.” Nature 494: 459–462. doi:10.1038/nature11917.
- Lu, X. H., H. Jiang, X. Y. Zhang, J. X. Liu, Z. Zhang, J. X. Jin, Y. Wang, J. H. Xu, and M. M. Cheng. 2013. “Estimated Global Nitrogen Deposition Using NO2 Column Density.” International Journal of Remote Sensing 34: 8893–8906. doi:10.1080/01431161.2013.853894.
- Luo, M., M. W. Shephard, K. E. Cady-Pereira, D. K. Henze, L. Y. Zhu, J. O. Bash, R. W. Pinder, S. L. Capps, J. T. Walker, and M. R. Jones. 2015. “Satellite Observations of Tropospheric Ammonia and Carbon Monoxide: Global Distributions, Regional Correlations and Comparisons to Model Simulations.” Atmospheric Environment 106: 262–277. doi:10.1016/j.atmosenv.2015.02.007.
- Luo, X. S., P. Liu, A. H. Tang, J. Y. Liu, X. Y. Zong, Q. Zhang, C. L. Kou, et al. 2013. “An Evaluation of Atmospheric Nr Pollution and Deposition in North China after the Beijing Olympics.” Atmospheric Environment 74: 209–216. doi:10.1016/j.atmosenv.2013.03.054.
- Nowak, D. J., D. E. Crane, and J. C. Stevens. 2006. “Air Pollution Removal by Urban Trees and Shrubs in the United States.” Urban Forestry and Urban Greening 4: 115–123. doi:10.1016/j.ufug.2006.01.007.
- Nowlan, C. R., R. V. Martin, S. Philip, L. N. Lamsal, N. A. Krotkov, E. A. Marais, S. Wang, and Q. Zhang. 2014. “Global Dry Deposition of Nitrogen Dioxide and Sulfur Dioxide Inferred from Space-based Measurements.” Global Biogeochemical Cycles 28: 1025–1043. doi:10.1002/2014GB004805.Received.
- Pan, Y. P., Y. S. Wang, G. Q. Tang, and D. Wu. 2012. “Wet and Dry Deposition of Atmospheric Nitrogen at Ten Sites in Northern China.” Atmospheric Chemistry and Physics 12: 6515–6535. doi:10.5194/acp-12-6515-2012.
- Pan, Y. P., Y. S. Wang, G. Q. Tang, and D. Wu. 2013. “Spatial Distribution and Temporal Variations of Atmospheric Sulfur Deposition in Northern China: Insights into the Potential Acidification Risks.” Atmospheric Chemistry and Physics 13: 1675–1688. doi:10.5194/acp-13-1675-2013.
- Shen, J. L., D. L. Chen, M. Bai, J. L. Sun, S. Kee, A. Mosier, and X. L. Liu. 2018. “Spatial Variations in Soil and Plant Nitrogen Levels Caused by Ammonia Deposition near a Cattle Feedlot.” Atmospheric Environment 176: 120–127. doi:10.1016/j.atmosenv.2017.12.022.
- Shen, J. L., Y. Li, X. J. Liu, X. S. Luo, H. Tang, Y. Z. Zhang, and J. S. Wu. 2013. “Atmospheric Dry and Wet Nitrogen Deposition on Three Contrasting Land Use Types of an Agricultural Catchment in Subtropical Central China.” Atmospheric Environment 67: 415–424. doi:10.1016/j.atmosenv.2012.10.068.
- Shen, J. L., X. J. Liu, Y. Zhang, A. Fangmeier, K. Goulding, and F. S. Zhang. 2011. “Atmospheric Ammonia and Particulate Ammonium from Agricultural Sources in the North China Plain.” Atmospheric Environment 45: 5033–5041. doi:10.1016/j.atmosenv.2011.02.031.
- Shen, J. L., A. H. Tang, X. J. Liu, A. Fangmeier, K. T. W. Goulding, and F. S. Zhang. 2009. “High Concentrations and Dry Deposition of Reactive Nitrogen Species at Two Sites in the North China Plain.” Environmental Pollution 157: 3106–3113. doi:10.1016/j.envpol.2009.05.016.
- Sutton, M. A., C. M. Howard, J. W. Erisman, G. Billen, A. Bleeker, P. Grennfelt, H. V. Grinsven, and B. Grizzetti. 2011. The European Nitrogen Assessment: Sources, Effects and Policy Perspectives. Cambridge: Cambridge University Press. doi:10.1017/CBO9780511976988.
- Wang, S. W., Q. Zhang, D. G. Streets, K. B. He, R. V. Martin, L. N. Lamsal, D. Chen, Y. Lei, and Z. Lu. 2012. “Growth in NOx Emissions from Power Plants in China: Bottom-up Estimates and Satellite Observations.” Atmospheric Chemistry and Physics 12: 4429–4447. doi:10.5194/acp-12-4429-2012.
- Xu, W., L. Liu, M. M. Cheng, Y. H. Zhao, L. Zhang, Y. P. Pan, X. M. Zhang, et al. 2018. “Spatial–Temporal Patterns of Inorganic Nitrogen Air Concentrations and Deposition in Eastern China.” Atmospheric Chemistry and Physics 18: 10931–10954. doi:10.5194/acp-18-10931-2018.
- Xu, W., X. S. Luo, Y. P. Pan, L. Zhang, A. H. Tang, J. L. Shen, Y. Zhang, et al. 2015. “Quantifying Atmospheric Nitrogen Deposition through a Nationwide Monitoring Network across China.” Atmospheric Chemistry and Physics Discussions 15: 18365–18405. doi:10.5194/acpd-15-18365-2015.
- Yang, R., K. Hayashi, B. Zhu, F. Li, and X. Yan. 2010. “Atmospheric NH3 and NO2 Concentration and Nitrogen Deposition in an Agricultural Catchment of Eastern China.” Science of the Total Environment 408: 4624–4632. doi:10.1016/j.scitotenv.2010.06.006.
- Zhang, X., X. H. Lu, L. Liu, D. M. Chen, X. M. Zhang, X. J. Liu, and Y. Zhang. 2017. “Dry Deposition of NO2 over China Inferred from OMI Columnar NO2 and Atmospheric Chemistry Transport Model.” Atmospheric Environment 169: 238–249. doi:10.1016/j.atmosenv.2017.09.017.