
ABSTRACT
This report provides a summary of the climate, as well as the major weather and climate events, over the Three Gorges Region of the Yangtze River (TGR) in 2018. The annual mean temperature over the TGR in 2018 was 0.2°C above normal, and precipitation was near normal. Seasonal highlights included a second warmest spring in the 58-year period of records, with abundant rainfall, which resulted in the wettest March on record. Furthermore, this was the fourth-warmest summer on record in the TGR, which contributed a higher-than-normal number of hot days in 2018. Precipitation was 17% and 30% less-than-normal in winter and summer, and 40% and 6% above average in spring and autumn, respectively. The annual mean wind speed in the TGR was higher than normal, and the annual mean relative humidity was near normal. The intensity of acid rain was relatively weak, being the second-weakest year since 1999. The major meteorological disaster types in the TGR include heat waves, drought, rainstorms and flooding, freezing rain, and snow. Heat waves occurred early in the summer and persisted for long durations with strong intensities. Long-term precipitation deficits resulted in drought conditions in summer 2018 across most regions of the TGR. Frequent heavy rainfall caused urban waterlogging. The early-year and late-year cold snaps were accompanied by heavy snowfall and rain over some locations across the TGR, which had adverse impacts on transportation, agriculture, electricity, and people’s lives.
摘要
2018年长江三峡地区气温较常年偏高,降水量接近常年,暴雨日数少,风速偏大,相对湿度接近常年,酸雨弱。年内高温出现早, 持续时间长, 强度大;夏季出现阶段性伏旱;暴雨和强降水引发城市内涝。
1. Introduction
The Three Gorges Region (TGR) of the Yangtze River, physically located at a conjunction that connects the Sichuan Basin and the lower and middle reaches of the Yangtze River, is well known as one of the largest hydro-junction projects in operation in the world. With Gezhouba Hydropower Station near its downstream, a cascade dispatching power station has been formed to control the basin area of 1 000 000 km2, accounting for 55.6% of the total basin area of the Yangtze River. It has played an important role in flood control and power generation, with great economic and social benefits.
The pros and cons of building a dam so large in scale, and its possible impacts on neighboring areas, is an ongoing debate. Against the background of global warming, extreme climate/weather events have been frequently reported in China. The Three Gorges Project is repeatedly questioned whenever rainstorms, floods, or drought hit the area in and around the reservoir ever since its water level began to be raised to the desired target. Therefore, understanding the climate state over the Three Gorges Project area is helpful in assessing the changes of the climate across the whole region.
Climatic monitoring and services have run throughout the construction and operational stages of the Three Gorges Project. The National Climate Center has released its Annual Climate Report of the TGR each year since 1996, providing information on climate monitoring, meteorological disasters, and climate impacts. However, these annual reports are not published formally and are therefore inconvenient for scientists to cite or study. Thus, the climate conditions of the TGR in 2018, as well as the major weather and climate events that year, are introduced in this paper, which can provide basic climate monitoring facts and data for further climate assessment and studies.
2. Data
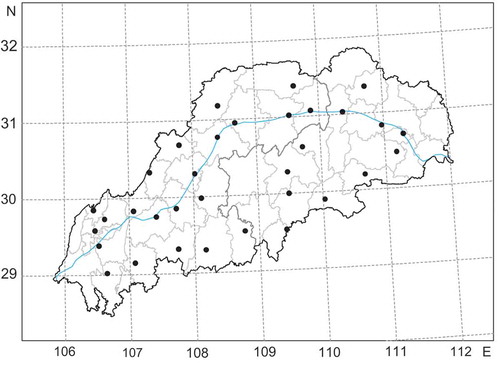
The TGR resides in the upper reaches of the Yangtze River. It covers the city of Chongqing and the southwestern region of Hubei Province. The westernmost part of the Three Gorges Area is located at the eastern brim of the Sichuan Basin, which is the largest basin in China. Daily observations from a total of 33 meteorological stations in the period 1961–2018 across the TGR were used in this study. Those data and some metadata information presented in this paper were originally sourced from the National Meteorological Information Center of China and two regional meteorological divisions, Chongqing Municipal Meteorological Bureau and Hubei Provincial Meteorological Bureau. The stations are reasonably well spatially distributed across the TGR ().
Figure 1. Distribution of 33 meteorological stations over the TGR.
The terms ‘above normal’, ‘below normal’, ‘near normal’, or ‘close to normal’ in this paper refer to the long-term average for the period 1981–2010 unless otherwise stated.
3. Temperature and precipitation
3.1. Temperature
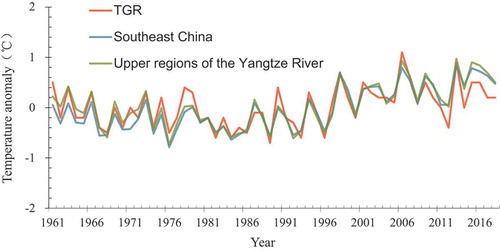
In 2018, the average annual temperature in the TGR was 17.4°C, which was 0.2°C above normal. In the past 60 years, the reservoir area has registered an ascending trend for annual mean temperature, with the largest increase in the last 20 years. Since the start of the twenty-first century, two record annual temperatures have been observed in the reservoir area. The warmest year on record since 1961 was 2006, when the annual average temperature was 18.3°C, and the second- and third-warmest years were 2013 (18.1°C) and 1998 (17.9°C), respectively. After reaching its second peak annual temperature in 2013, temperature began to decrease slowly in magnitude in the latest 5 years. The rate of increase in annual temperature during the past 58 years is consistent with the changes in annual temperature of the upper regions of the Yangtze River and Southeast China ().
Figure 2. Variations of annual temperature anomalies for the TGR, the upper regions of the Yangtze River, and Southeast China, during the period 1961–2018.
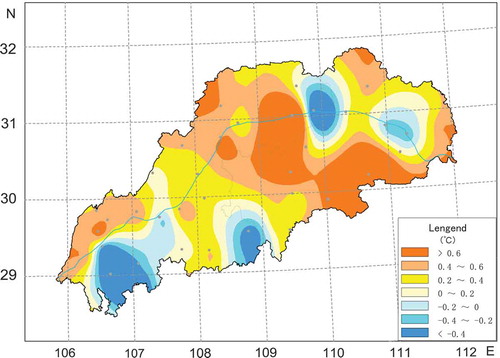
The year 2018 was characterized by warmer-than-average conditions across much of the TGR. The spatial and temporal distribution of temperature was quite uneven. Compared with the long-term average of 1981–2010, the annual temperatures in most of the central TGR were higher than 0.4°C, and even higher than 1.0°C to 2.0°C in some areas, while temperatures of stations in western areas were 0.5°C to 1.0°C below normal ().
Figure 3. Annual temperature anomalies in 2018 for the TGR (units: °C) with respect to the period 1981–2010.
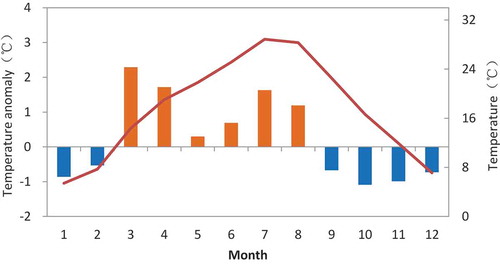
The variation of monthly temperature presents a ‘cold–warm–cold’ distribution pattern (). January, February, and the months from September to December were colder than normal, while the months from March to August were warmer than normal. Also, the TGR experienced its second-warmest March on record in 2018. The seasonal mean temperatures in the TGR for winter (December 2017 to February 2018), spring (March to May), summer (June to August), and autumn (September to November) were 7.1°C, 18.4°C, 27.4°C, and 17.0°C, respectively. The TGR recorded its second-warmest spring since 1961, and the seasonal temperature was 1.4°C above normal. Summer ranked as the fourth-warmest on record, being 1.2°C above normal. The winter and autumn mean temperatures were colder than normal.
Figure 4. Monthly temperature anomalies (bars) in 2018 for the TGR (units: °C) with respect to the period 1981–2010. The actual temperature is shown as the red line.
In 2018, the number of hot days (daily maximum temperature exceeding 35°C) for the TGR was 42.6 days, which was the fifth-highest number since 1961 and 18.2 days more than normal. Most of the TGR reported above normal hot days, especially in central and northern parts.
3.2. Precipitation
The total area-averaged rainfall in the TGR in 2018 was 1170.4 mm, which was close to normal (). After five consecutive dry years, the precipitation was above average since the year 2014. Compared with the rainfall variations of the upper regions of the Yangtze River and Southeast China, the decadal and interdecadal changes of annual precipitation are similar (), indicating the changes of precipitation in the TGR are mainly influenced by the atmospheric circulation of the background area.
Figure 5. Variations of annual precipitation anomalies for the TGR, the upper regions of the Yangtze River, and Southeast China, during the period 1961–2018.
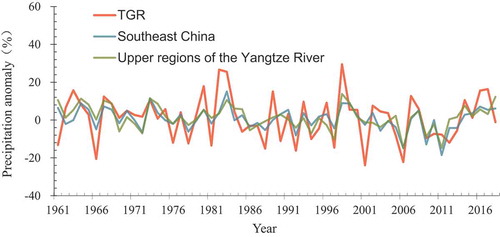
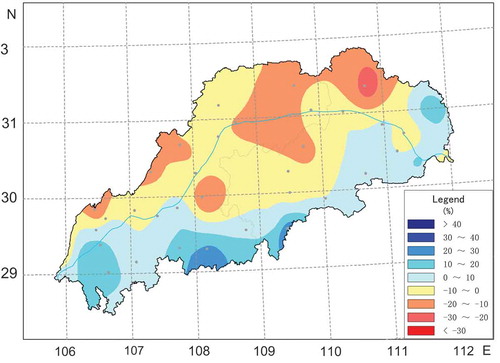
Precipitation varied across the TGR during 2018. Much of the southwestern TGR had above-average precipitation for the year, which was generally 10%–30% wetter than normal, while the northeastern area had 10%–20% drier-than-average conditions ().
Figure 6. Annual rainfall anomalies in 2018 for the TGR (units: %) with respect to the 1981–2010 average.
The winter and summer of 2018 were relatively dry across most of the TGR. The rainfall total in winter was 59.2 mm, which was 17% less than normal. The total rainfall in spring was 438.6 mm, which was 40% more than normal, marking it the third-wettest spring since 1961. Summer 2018 was quite dry, with 371.9 mm of precipitation, which was 30% less than normal. June 2018 was the TGR’s third-driest June since 1961. Autumn 2018 received 281.8 mm of precipitation, which was 6% more than normal.
The annual number of rainstorm days (daily precipitation greater than or equal to 50.0 mm) in the TGR in 2018 was 2.7 days, which was 0.6 days less than normal. The number of rainstorm days was close to normal across most of the TGR, with 1–5 days more than normal in the southern areas and 1–3 days less than normal in the central areas of the TGR.
4. Wind, relative humidity and fog
In 2018, the average annual wind speed in the TGR was 1.5 m s−1, which was 0.5 m s−1 higher than normal. The annual mean wind speed was about 1.5–2.7 m s−1 in the west and northeast of the TGR, while in most other areas it was about 0.7–1.5 m s−1. The annual variation of the mean wind speed in the TGR was small. The maximum monthly mean wind speed of 1.7 m s−1 occurred in July and August, and the minimum wind speed of 1.3 m s−1 occurred in October, November, and December.
In 2018, the annual mean relative humidity in the TGR was 78%, which was close to normal. The annual mean relative humidity of each station was about 70% to 83%, which was larger in the western and central regions and smaller in the northeast. The annual mean relative humidity was close to normal in most parts of the TGR. The annual mean relative humidity was 2%–6% less than normal in some regions of the northern TGR, and 2%–4% more than normal in the southeastern TGR. Relative humidity was close to normal for the four seasons.
The TGR of the Yangtze River is a fog-prone area in China. The spatial distribution of fog days in the TGR has obvious local characteristics. The number of fog days varies greatly across the TGR. The fog days in the western part of the TGR and some areas along the Yangtze River in 2018 were more than 100 days, such as Qijiang, Fuling, Zhongxian, Nanchuan, Qianjiang, Banan, Wushan, and Wulong. Qijiang and Nanchuan had 205 and 181 fog days, respectively. There were fewer fog days in the central and eastern parts of the TGR in 2018, such as Kaizhou, Wanzhou, and Hefeng, where there were fewer than 10 fog days.
5. Acid rain
In 2018, the annual precipitation pH values were 5.67, 5.24, 5.92, 6.00, 5.86, and 5.61, respectively, in the six acid-rain observation stations of Chongqing, Fuling, Wanzhou, Fengjie, Badong, and Yichang. The degree of acid rain was normal in Chongqing, Wanzhou, Fengjie, Badong, and Yichang in 2018, whereas it was classified as light acid rain in Fuling.
In 2018, the strongest acid-rain intensity occurred in winter, and the lightest was in summer. The average pH values of precipitation in the four seasons were 5.55 (winter), 5.78 (spring), 5.86 (summer), and 5.64 (autumn). The monthly acid-rain intensity was light during March–October and December, while the intensity in January–February and November was generally normal and the strongest acid rain was observed in February, with a precipitation pH value of 5.53.
The average precipitation pH value of the six stations in the TGR in 2018 was 5.71, which is a normal rainfall pH. The precipitation pH value was slightly lower than that in 2017. The average acid-rain intensity in the TGR has been decreasing since 2006. Generally speaking, the acid-rain intensity in the TGR has shown an obvious weakening trend in the past 20 years.
6. Major climate events and meteorological disasters
In 2018, the main climate events and meteorological disaster types in the TGR included heat waves, drought, heavy rain and flooding, low temperatures, freezing rain, and snow. The heat waves appeared early in the summer and lasted for a long time with strong intensity. Drought phases occurred during the summer. Frequent heavy rainstorms led to urban waterlogging in some regions. Low temperatures and snow hit the TGR at the beginning and end of the year.
6.1. Strong and persistent heat waves in summer
In summer 2018, the TGR experienced some intense sunny and hot weather. The heat waves occurred early in the season with strong intensity. Kaizhou, Shapingba, Beibei, Shizhu, Changshou, and Fengjie experienced 40–50 hot days during 2018, ranking as the second-highest hot-day numbers on record. The first heat wave persisted for 3 days in mid-May, which was earlier than normal (late-May). This culminated in a prolonged heatwave in July and August, which included numerous record-high temperatures and record durations of warm temperatures in Chongqing, such as the heat waves during 10–29 July, 1–16 August, 18–21 August, and 24–31 August. The maximum temperature exceeded 40°C in some regions of the TGR during August. Wushan and Fengjie had their maximum temperatures on record, with 43.2°C and 42.2°C on 19 July and 20 August, respectively.
Seven consecutive high-temperature red warnings were announced in mid-August, and eight consecutive warnings were issued from 28 August to 4 September. Heatwaves increased the use of air conditioning and put strain on the power load.
6.2. Drought in summer
The precipitation varied greatly across the TGR in summer, with most of the area experiencing dry, hot, and sunny weather, resulting in drought in some areas. The summer drought in 2018 was slightly worse than that in 2017, but was no more serious than normal.
The first period of summer drought in 2018 was from mid-July to late July. It developed and aggravated rapidly, with severe and extreme drought in Xingshan. Drought alleviated across most of the TGR at the end of July owing to the occurrence of precipitation. From mid- to late-August, drought developed again in the TGR, especially in areas of Hubei. Severe drought occurred in Yichang and Yidu of Hubei Province. Drought was alleviated during the period of late-August and early-September owing to persistent convective weather. Crop growth was affected by the drought and high temperatures in summer.
6.3. Frequent heavy rain and associated urban waterlogging
In 2018, heavy rain and rainstorms hit the TGR frequently. There were 10 heavy rainstorm processes. The rainstorm processes during 20–22 April and 2–6 July had comparatively serious impacts.
During 21–22 April, heavy rainstorms hit Yichang, Changyang, and Yidu of Hubei Province, with torrential rain in Xiaotingqu and the northern part of Yidu, accompanied by strong convective weather (e.g. thunder and lightning). A precipitation total of 186 mm in 24 h was recorded in Yidu, claiming a new record in its history. Heavy precipitation triggered urban flooding and waterlogging in the cities of Yichang and Yidu. Some streets, houses, shops, and underground garages were flooded, and nearly 200 flood discharge ditches and dikes overflowed, which impacted upon people’s lives and transportation in the region.
During 2–6 July, the TGR suffered a major flooding event as a result of heavy rain, mainly in the Yichang Dam area, with 76 mm of rain in an hour recorded in Taipingxi of Yiling District. Numerous heavy rainfall events caused waterlogging and floods in some regions along several rivers, which also triggered landslides and debris flows in some areas.
6.4. Low-temperature freezing rain and snow in early and late 2018
The periods of 3–6 and 24–28 January constituted two low-temperature freezing rain and snow weather events in the TGR, with heavy snowstorms in some regions, and with more than 15 cm of snow cover observed in the dam area and surrounding high-altitude mountain areas. Extreme low temperatures occurred at many stations in the TGR.
During 25–31 December, affected by a strong cold snap across the country, the TGR suffered its most severe snow and freezing-rain event of the year. Temperatures dropped sharply, and the daily average temperature in some areas was below 0°C for four consecutive days. After the snowfall, the snow cover melted slowly and the freezing on the roads was seriously hazardous, with adverse impacts on transportation, agriculture, power transmission, and people’s daily lives.
7. Conclusion and discussion
The climate in the TGR in 2018 was slightly warmer (0.2°C above normal) than normal but the same as that in 2017. It was colder in winter and autumn, while the temperature in spring and summer was higher. Temperature in the region tended to increase, with the highest temperature in the past two decades for 60 years, and there was a significant increase in temperature in the mid- and late-1990s. The annual precipitation was 1170.4 mm, which was close to normal and 15% drier than that in the previous year, with more precipitation in spring and autumn.
The TGR experienced exceptional heat and drought throughout the late spring and summer of 2018. Heavy rain and flash flooding affected various parts of the TGR and led to urban waterlogging in some regions. Low temperatures and snow hit the TGR at the beginning and end of the year.
The intensity of acid rain was weak in 2018, ranking as the second-weakest year since 1999, with an obvious weakening trend in the past 10 years in the TGR.
As for the regional climate effects of the TGR, it is known that the climate in the TGR is not only related to its own special local geographical conditions, but is also influenced by large-scale climate systems. The most direct and main factors of influence are the changes in atmospheric circulation (including the western Pacific subtropical high, the East Asian monsoon, and the South Asian high), as well as external forcing factors (e.g. sea temperature, snow cover, etc.).
After the impoundment of the Three Gorges Project, the expansion of the water area had a regulating effect on the temperature of adjacent areas. The main manifestation of this was that there has been a warming effect in winter and a weak cooling effect in summer, but the temperature regulation is generally less than 0.5°C, and the range of influence is no more than 20 km. The extent of abnormal fluctuations of large-scale climate systems and their impacts on the climate in the TGR are far greater than that of reservoir impoundment.
Acknowledgments
The authors thank the reviewers for their constructive comments and suggestions. We would also like to thank our colleagues at Hubei Provincial Meteorological Bureau and Chongqing Meteorological Bureau for their contributions.
Disclosure statement
No potential conflict of interest was reported by the authors.