
 ?Mathematical formulae have been encoded as MathML and are displayed in this HTML version using MathJax in order to improve their display. Uncheck the box to turn MathJax off. This feature requires Javascript. Click on a formula to zoom.
ABSTRACT
Precipitation extremes are among the most dangerous climate-related hazards over China, and they are expected to significantly increase in the future in both frequency and intensity. Exposure to precipitation extremes and changes therein are determined by extreme events and the corresponding population changes. Here, the authors analyze the changing population exposure across China in the future using ensembles of high-resolution simulations with RegCM4 and population scenarios. The authors find that aggregate exposure over China increases by nearly 21.6% under the RCP4.5-SSP2 scenario by the end of this century, although populations are projected to decrease. East China will experience the largest absolute increase in exposure from 424 million person-events to 546 million person-events, while the Tibetan Plateau region will experience the largest relative increase of nearly 44.4%. This increase in exposure mainly results from the climate effect contribution. Further assessments indicate that the exposure increase over China does not rely on the greenhouse gas emissions and population growth scenarios, but the higher emissions scenario generally leads to higher exposure regardless of population growth, highlighting the efficacy of mitigation efforts in reducing exposure to precipitation extremes.
Graphical Abstract
摘要
极端降水(暴雨)是我国最为主要的自然灾害之一,每年均造成巨大经济损失和人员伤亡。现有预估研究表明,未来全球持续增暖使得我国极端降水发生频次显著增加, 强度增强。那么,未来极端降水增加会对社会,尤其是人们生活造成多大影响?围绕这个问题,本研究基于多个高分辨率区域气候模式模拟和人口数据,分析了未来我国极端降水人口暴露度的可能变化。结果指出,在 RCP4.5-SSP2 情景下,到了21世纪末,虽然预估的我国人口数量大幅减少,但极端降水人口暴露度却显著增加,相对当前气候增加了约 21.6%,其中东部地区是增加最为显著的区域。进一步研究发现,人口暴露度的增加不依赖于情景的选择,但高排放情景增加幅度更大,而且增加主要是由于气候变化的贡献。
1. Introduction
Risks associated with climate change have been reported to have significantly increased around the world due to the significantly increasing temperatures, which have already exerted substantial impacts on human economies, livelihoods and health, and even on natural resources and ecosystems (IPCC Citation2014). Over the past several decades, thousands of people have died from the increase in natural hazards around the world, mainly resulting from climate change, such as the heat wave in China in 2013, the severe flood in northern India in 2013, the winter floods in southern England in 2014, and the persistent drought in California in 2014 (AghaKouchak et al. Citation2014; Sun Citation2014; Sun et al. Citation2014; Cho et al. Citation2016; Schaller et al. Citation2016). With the ongoing emissions of greenhouse gases in the future, the world’s population will be exposed to increased hazards and even to several simultaneous hazards that could have deadly impacts on human systems (Mora et al. Citation2018). Thus, the mitigation and adaptation of climate change have received increasing concern from governmental bodies, scientific communities, and the general public in recent years.
Precipitation extremes and the associated secondary disasters (including flash floods and landslides) are among the most dangerous climate-related hazards in the world, as well as in China. Notable events such as the 2010 Zhouqu debris flow and 2012 Beijing flash floods in China led to thousands of deaths and large economic losses (Yu, Sun, and Xiang Citation2013; Wang, Wang, and Hong Citation2016), and these sorts of hazards caused by serious precipitation extremes have been reported to have increased in recent decades (Pei et al. Citation2017; Sun and Wang Citation2018; Sun et al. Citation2019). Furthermore, both simulations from phase 5 of the Coupled Model Intercomparison Project (CMIP5) and high-resolution regional climate models suggest that China is likely to experience more precipitation extreme events in the coming decades, which will lead to an increased probability of the occurrence of related hazards (Chen Citation2013; Zhou et al. Citation2014, Citation2016; Xu et al. Citation2015; Gao, Shi, and Giorgi Citation2016; Chen and Sun Citation2017, Citation2018; Li et al. Citation2018; Sui, Lang, and Jiang Citation2018; Yu Citation2018). Thus, assessments of the changing associated risks, especially the impacts from the increased precipitation extremes, are critical for mitigation and adaptation management.
Many prior studies have focused on future heat wave risk assessment and attempted to evaluate the number of people exposed to heat-related hazards and even the probable related mortality of people in China (Liu et al. Citation2017; Huang et al. Citation2018; Zhan et al. Citation2018). Additionally, the effects of droughts on human populations have been studied recently, and the results indicated a significantly increased population exposure to droughts across China in the future due to continuous greenhouse gas emissions (Sun et al. Citation2017; Chen et al. Citation2018; Chen and Sun Citation2019). However, to date, less concern has been given to the effects of changes in precipitation extremes on human populations in China. Thus, the key issues we aim to address in this study are the future changes in population exposure to precipitation extremes in China and the importance of climate change and population growth.
2. Data and method
A set of high-resolution simulations (~0.25° horizontal grid) for the future climate change projections over East Asia from the regional climate model RegCM4 runs was used for the assessment of precipitation extreme changes across China in this study. RegCM4 was driven by four CMIP5 models, including CSIRO-Mk3.6.0, EC-EARTH, HadGEM2-ES, and MPI-ESM-MR, under the greenhouse gas concentration pathway RCP4.5 scenario (Gao et al. Citation2018). The model was also driven by EC-EARTH and MPI-ESM-MR under RCP8.5. The simulations cover the period 1979–2098, where the years 1986–2005 are considered as the reference period and 2079–2098 as the end of this century. Additional details on these simulations can be found in Gao et al. (Citation2018).
The spatial population projections under SSP2 and SSP3 from the NCAR-CIDR were used in this study for future population change assessment. These two pathways assume divergent global population outcomes, with SSP2 (middle of the road) assuming middle population growth in most regions, while SSP3 (regional rivalry) assumes high population growth (Jones and O’Neill Citation2016). This spatial population is at a resolution of 1/8°, and we aggregated these projections to the 0.25° grid for this work. The population in the base year of 2000 (representing the mean for the years of 1991–2000) is considered the present day conditions, and the year 2100 (representing the mean for the years of 2091–2100) is considered the future period.
To validate the capability of RegCM4 in simulating precipitation extremes, a newly gridded daily precipitation dataset across China developed by Wu and Gao (Citation2013) was employed here. These observed data were produced via interpolation using the ‘anomaly approach’ from more than 2400 stations in China, with a high spatial resolution of 0.25° × 0.25°.
To calculate exposure, we multiplied the projected population by the projected number of precipitation extreme events for each grid cell. The annual maximum accumulated 5-day precipitation (RX5D), a frequently used index of precipitation extreme in flood risk assessment, was used here. An extreme event was defined as the RX5D exceeding the 20-year return value from the 1986–2005 baseline by the generalized extreme value fit. Additionally, the influences of climate and population on exposure are also discussed using the method proposed by Jones et al. (Citation2015). We decompose the exposure change into three parts, including the climate effect, the population effect, and their interaction effect, as displayed in Equation (1):
where ΔE is the total change in exposure and P1 and C1 are the populations and precipitation extreme events in the present day, respectively. ΔP and ΔC are the changes in populations and extreme events at the end of this century with respect to the present day. Thus, the term P1× ΔC represents the climate effect, C1× ΔP is the population effect, and ΔP × ΔC is their interaction effect.
3. Results
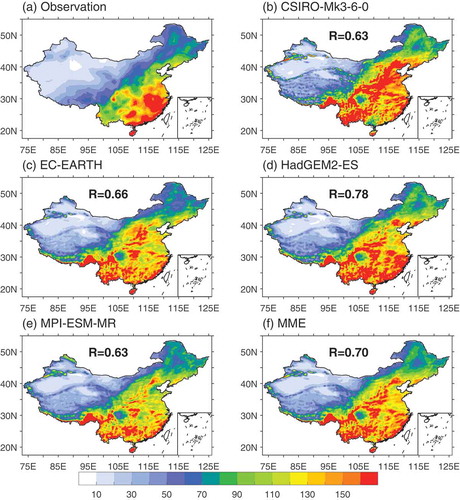
The observed RX5D averaged over the period 1986–2005 is dominated by a decrease from southeast to northwest across China, and the high values are mainly located over the regions of East China and the coast of South China (; for the subregions across China, please see Figure S1). This spatial pattern is reasonably reproduced by all simulations, with spatial correlations spanning from 0.63 to 0.78 with observation. However, overestimation is clear for the simulations across China, especially over North China and Southwest China. The multimodel mean ensemble (MME) presents a relatively high skill in simulating the RX5D, with a spatial correlation of 0.70, and the results from MME will thus be discussed in the following.
Figure 1. Regional climate model simulations of RX5D over China in present day conditions (1986–2005) driven by four CMIP5 GCM simulations: (a) observation; (b) CSIRO-Mk3-6-0; (c) EC-EARTH; (d) HadGEM2-ES; (e) MPI-ESM-MR; and (f) MME. The value in each panel is the simulated spatial correlation coefficient with the observation. Units: mm.
shows the projected change in precipitation extreme over China at the end of this century with respect to the present day conditions. The RX5D presents an obvious increase across China in response to global warming, and the regional mean is shown to increase by approximately 10.3% at the end of the 21st century under the RCP4.5 scenario. Regional differences are also clear for future changes in RX5D across China. Relatively larger increases happen over the regions of the Tibetan Plateau, western Northwest China, and East China, with increases of 13.5%, 13.2%, and 11.1%, respectively. Relatively smaller increases are observed over the regions of Southwest China and North China, by approximately 4.9% and 7.3% respectively. A similar change pattern can also be observed for RX5D under the RCP8.5 scenario but with a relatively larger increasing magnitude (Figure S2), and the regional aggregated mean shows an increase at the end of this century against the present day of approximately 18.9%.
Figure 2. Response of precipitation extreme over China to global warming: (a) projected change in RX5D at the end of the 21st century (2079–2098) with respect to present day conditions (1986–2005) under the RCP4.5 scenario; (b) probability ratio for precipitation extremewith a 20-year return period.
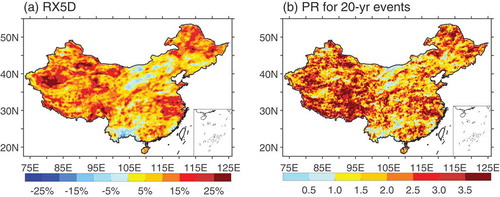
We further evaluated the response of severe precipitation extreme events to warming over China (). A severe precipitation extreme event here is defined as a case in which the RX5D exceeds the 20-year return value from the 1986–2005 baseline. The change in precipitation extreme events is represented by the probability ratio, which is defined as R1/R0, where R0 is the occurrence probability of precipitation extremes during the baseline years, and R1 is the probability for the future period. Clearly, severe precipitation extreme events also present significant increases across China due to future warming, and statistically, more than 80% of the grid cells in mainland China experience an increasing trend. Especially over the regions of the Tibetan Plateau, western Northwest China, Northeast China, and East China, the occurrence probabilities of extreme events are shown to more than double over most grid cells at the end of this century when compared with the present day conditions. The aggregate mean over China is also shown to double in the future. This finding implies that these severe precipitation extreme events that generally occurred once in 20 years in the present day period will occur once in approximately 10 years at the end of this century.
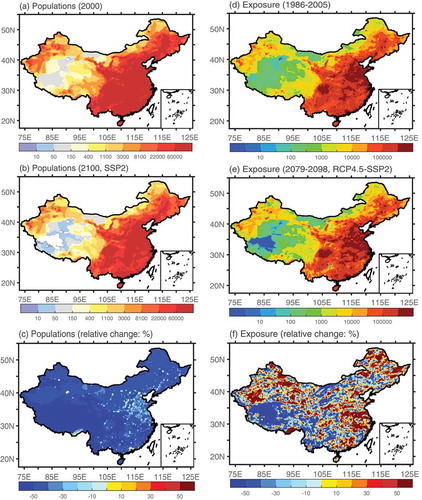
In terms of social impacts, extreme events that deviate from the mean state generally result in great losses. To examine the change in population exposure to these dangerous extremes, shows the spatial patterns of population exposure for the 1986–2005 and 2079–2098 periods under the RCP4.5-SSP2 scenario, as well as their associated differences. During the historical period, the geographic distributions of exposure are generally presented as a function of population and tend to be relatively high in some parts of North China, East China, and the Sichuan basin. By the end of this century, population exposure remains high in these regions. Relatively low exposure occurs over the western parts of the Tibetan Plateau and the deserts in Northwest China, mainly resulting from the sparse populations in these regions, in both the present and future periods. However, assessment of the exposure difference indicates that there will be an increasing chance of exposure over most regions of China caused by these dangerous precipitation extremes, although the populations in China are projected to significantly decrease (by approximately 39% under the SSP2 scenario) at the end of this century (). The population exposure to severe precipitation extreme events will increase by approximately 21.6%, aggregated over China, with warming in the future.
Figure 3. Changes in population and population exposure to precipitation extreme events over China under future warming scenarios: (a, b) spatial distributions of populations across China in the present day period and the year 2100 under the SSP2 scenario, respectively, and (c) their associated relative changes; (d, e) distributions of population exposure to precipitation extreme in the present day period and at the end of the 21st century under the RCP4.5-SSP2 scenario, respectively, and (f) their relative changes.
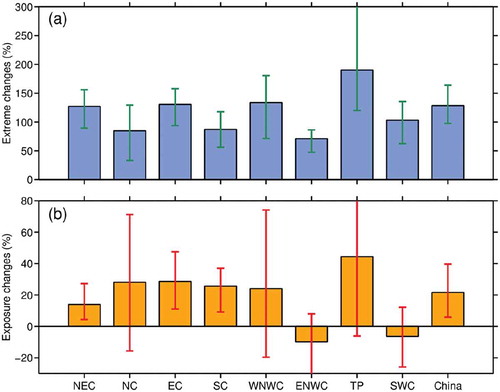
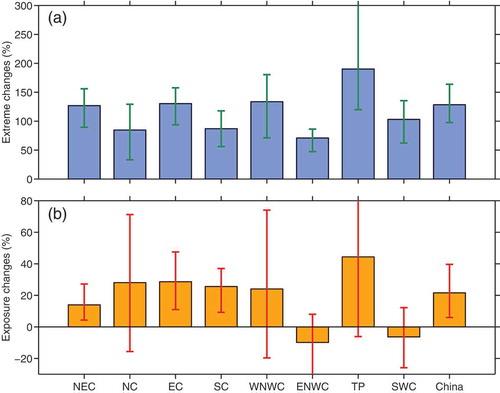
To better discern the magnitude of the exposure changes, we aggregated the values across eight subregions (). As noted before, the initial population exposure values are highest over East China (). By the end of this century, the exposure increases to approximately 546 million person-events from 424 million person-events, increasing by approximately 28.6% with respect to that in the present day period. The Tibetan Plateau region experiences the fastest increase in exposure, from 5.7 million person-events to 8.2 million person-events, equivalent to an increase of nearly 44.4% against the current values. However, the exposure in some regions of the Tibetan Plateau shows a decrease at the end of this century, especially over its western parts, as shown in . The aggregate increase in exposure over this region is mainly due to the large increase over the eastern parts of the Tibetan Plateau, while very low exposure occurs in its western parts. Meanwhile, the regions of Northeast China, North China, South China, and western Northwest China also experience a substantial increase, and the exposure is equivalent to increases of approximately 14.0%, 28.1%, 25.6%, and 24.1%, respectively. In contrast, there will be fewer populations exposed to severe precipitation extreme events in the future over the regions of Southwest China and eastern Northwest China, in which the exposure is reported to decrease by nearly 6.3% and 9.9%, respectively. The higher emissions scenario of RCP8.5-SSP3 yields relatively higher levels of exposure across China, including the regions of Southwest China and eastern Northwest China (Figure S3).
Figure 4. Relative changes in (a) extreme precipitation events with a 20-year return period under the RCP4.5 scenario and (b) its associated population exposure under the RCP4.5-SSP2 scenario for different regions over China at the end of 21st century with respect to the present day conditions. Error bars show the minimum and maximum values from the model simulations to represent the uncertainty. Units: %.
We also evaluated the exposure changes based on a 2 × 5 matrix across RCPs and SSPs (Table S1). Except for the RCP4.5-SSP4 scenario, all scenarios produce increased exposure to the extremes over China at the end of this century, ranging from a low of 1.6% to a high of 107.1%. The largest increase is observed under the RCP8.5-SSP3 scenario. Furthermore, RCP8.5 always leads to higher exposure than RCP4.5 for any given SSP. This finding implies that there is high confidence that there will be a substantial increase in populations exposed to severe precipitation extremes over China in the future, regardless of the RCP and SSP.
But what causes the exposure increase across China? To address this issue, we further decomposed the exposure change under the RCP4.5-SSP2 scenario into the contribution from the climate effect, population effect, and interaction effect. For all regions of China, the climate effect is the main contributor to increasing the total exposure, while the population effect contributes to decreasing the exposure because of the significant decrease in populations across China by the end of this century. As noted earlier, the largest relative increase in exposure is expected to occur over the Tibetan Plateau, which mainly results from the climate effect (nearly 182.6% to the increase in exposure), which presented the largest contribution across China, and the population effect contribution decreases to approximately 54.9%. The climate effect contribution shows the smallest increase in exposure over eastern Northwest China, but its absence would lead to a reduction in exposure of approximately 66.1%. The large proportion of the negative contribution from the population effect (nearly −43.8%) and interaction effect (nearly −32.2%) finally resulted in reduced exposure over this region. At the national level, our assessment shows that the increase in total exposure over China is mainly caused by the climate effect, with an increase of approximately 115.5%, and the population effect and the interaction effect generally cause a negative contribution of 38.6% and 55.3%, respectively. The contribution of the climate effect would further increase to nearly 214.3% with the increase in total exposure over China under the RCP8.5-SSP3 scenario. Thus, our assessment highlights the considerable role of future climate change in increasing exposure to precipitation extreme in China.
4. Conclusions
The changing population exposure to precipitation extremes over China was analyzed using RegCM4 high-resolution simulations driven by four CMIP5 models under future mid- and high-emission/growth scenarios. With rapid warming in the future, the precipitation extreme of RX5D is projected to significantly increase across China, with the largest increase of approximately 13.5% occurring over the Tibetan Plateau and the lowest increase of nearly 4.9% over Southwest China under the RCP4.5 scenario by the end of this century with respect to the present day conditions. The related severe extreme events that exceed the 20-year return values also present significant increases over China. The occurrences over most regions are estimated to more than double in the future, which implies that these precipitation extreme events that generally occurred once in 20 years in the present day period will happen frequently by the end of this century, occurring once in 10 years or even less. This significant increase in precipitation extremes over China causes more populations to be exposed to these severe events, although populations in China are projected to decrease in the future. The total exposure increases by nearly 21.6% when aggregated over China under the RCP4.5-SSP2 scenario. The region of the Tibetan Plateau experiences the largest relative increase in exposure of approximately 44.4%, while the region of East China suffers from the largest absolute increase from 424 million person-events in the present day period to 546 million person-events by the end of this century.
This increase in exposure to precipitation extremes over China does not depend on the RCP or SSP. However, the high emissions under the RCP8.5 scenario generally lead to a higher exposure level than under RCP4.5 for any given population scenario. In addition, our assessment further shows that the exposure increase mainly derives from the climate change contribution, while the population effect and the interaction effect generally reduce the exposure. Thus, the results of this study reconfirm the benefits of climate mitigation efforts for the reduction in population exposure to precipitation extremes over China in future years.
Supplemental Material
Download PDF (358.3 KB)Disclosure statement
No potential conflict of interest was reported by the authors.
Supplementary material
Supplemental data for this article can be accessed here
Additional information
Funding
Related Research Data
References
- AghaKouchak, A., L. Cheng, O. Mazdiyasni, and A. Farahmand. 2014. “Global Warming and Changes in Risk of Concurrent Climate Extremes: Insights from the 2014 California Drought.” Geophysical Research Letters 41: 8847–8852. doi:10.1002/2014GL062308.
- Chen, H. P. 2013. “Projected Change in Extreme Rainfall Events in China by the End of the 21st Century Using CMIP5 Models.” Chinese Science Bulletin 58: 1462–1472. doi:10.1007/s11434-012-5612-2.
- Chen, H. P., and J. Q. Sun. 2017. “Contribution of Human Influence to Increased Daily Precipitation Extremes over China.” Geophysical Research Letters 44: 2436–2444. doi:10.1002/grl.v44.5.
- Chen, H. P., and J. Q. Sun. 2018. “Projected Changes in Climate Extremes in China in a 1.5°c Warmer World.” International Journal of Climatology 38: 3607–3617. doi:10.1002/joc.5521.
- Chen, H. P., and J. Q. Sun. 2019. “Increased Population Exposure to Extreme Droughts in China Due to 0.5°C of Additional Warming.” Environmental Research Letters 14: 064011. doi:10.1088/1748-9326/ab072e.
- Chen, J., Y. J. Liu, T. Pan, Y. H. Liu, F. B. Sun, and Q. S. Ge. 2018. “Population Exposure to Droughts in China under 1.5 °C Global Warming Target.” Earth System Dynamic 9: 1097–1106. doi:10.5194/esd-9-1097-2018.
- Cho, C., R. Li, S. Y. Wang, J. H. Yoon, and R. Gillies. 2016. “Anthropogenic Footprint of Climate Change in the June 2013 Northern India Flood.” Climate Dynamic 46: 797–805. doi:10.1007/s00382-015-2613-2.
- Gao, X. J., Y. Shi, and F. Giorgi. 2016. “Comparison of Convective Parameterizations in RegCM4 Experiments with CLM as the Land Surface Model over China.” Atmospheric and Oceanic Science Letters 9: 246–254. doi:10.1080/16742834.2016.1172938.
- Gao, X. J., J. Wu, Y. Shi, J. Wu, Z. Y. Han, D. F. Zhang, Y. Tong, R. K. Li, Y. Xu, and F. Giorgi. 2018. “Future Changes in Thermal Comfort Conditions over China Based on multi-RegCM4 Simulations.” Atmospheric and Oceanic Science Letters 11: 291–299. doi:10.1080/16742834.2018.1471578.
- Huang, D. P., L. Zhang, G. Gao, and S. Sun. 2018. “Projected Changes in Population Exposure to Extreme Heat in China under a RCP8.5 Scenario.” Journal of Geographical Sciences 28: 1371–1384. doi:10.1007/s11442-018-1550-5.
- Intergovernmental Panel on Climate Change. 2014. Climate Change 2014: Impacts, Adaptation, and Vulnerability. Part A: Global and Sectoral Aspects. Contribution of Working Group II to the Fifth Assessment Report of the Intergovernmental Panel on Climate Change, edited by C. B. Field, V. R. Barros, D. J. Dokken, K. J. Mach, M. D. Mastrandrea, T. E. Bilir, M. Chatterjee. 1132. Cambridge; New York, NY.: Cambridge University Press.
- Jones, B., and B. C. O’Neill. 2016. “Spatially Explicit Global Population Scenarios Consistent with the Shared Socioeconomic Pathways.” Environmental Research Letters 11: 084003. doi:10.1088/1748-9326/11/8/084003.
- Jones, B., B. C. O’Neill, L. McDaniel, S. McGinnis, L. O. Mearns, and C. Tebaldi. 2015. “Future Population Exposure to US Heat Extremes.” Nature Climate Change 5: 652–655. doi:10.1038/nclimate2631.
- Li, H. X., H. P. Chen, H. J. Wang, and E. T. Yu. 2018. “Future Precipitation Changes over China under 1.5°c and 2.0°c Global Warming Targets by Using CORDEX Regional Climate Models.” Science of the Total Environment 640–641: 543–554. doi:10.1016/j.scitotenv.2018.05.324.
- Liu, Z., B. Anderson, K. Yan, W. H. Dong, H. Liao, and P. J. Shi. 2017. “Global and Regional Changes in Exposure to Extreme Heat and the Relative Contributions of Climate and Population Change.” Scientific Reports 7: 43909. doi:10.1038/srep43909.
- Mora, C., D. Spirandelli, E. C. Franklin, J. Lynham, M. B. Kantar, W. Miles, C. Z. Smith, et al. 2018. “Broad Threat to Humanity from Cumulative Climate Hazards Intensified by Greenhouse Gas Emissions.” Nature Climate Change 8: 1062–1071. doi:10.1038/s41558-018-0315-6.
- Pei, L., J. J. Xia, Z. W. Yan, and H. Yang. 2017. “Assessment of the Pacific Decadal Oscillation’s Contribution to the Occurrence of Local Torrential Rainfall in North China.” Climatic Change 144: 391–403. doi:10.1007/s10584-016-1610-8.
- Schaller, N., A. L. Kay, R. Lamb, N. R. Massey, G. J. van Oldenborgh, F. E. L. Otto, S. N. Sparrow, et al. 2016. “Human Influence on Climate in the 2014 Southern England Winter Floods and Their Impacts.” Nature Climate Change 6: 627–634. doi:10.1038/nclimate2927.
- Sui, Y., X. M. Lang, and D. B. Jiang. 2018. “Projected Signals in Climate Extremes over China Associated with a 2°c Global Warming under Two RCP Scenarios.” International Journal of Climatology 38 (S1): e678–e697. doi:10.1002/joc.5399.
- Sun, B., and H. J. Wang. 2018. “Interannual Variation of the Spring and Summer Precipitation over the Three-River-Source Region in China and the Associated Regimes.” Journal of Climate 31: 7441–7457. doi:10.1175/JCLI-D-17-0680.1.
- Sun, B., H. J. Wang, B. T. Zhou, and H. Li. 2019. “Interdecadal Variation in the Synoptic Features of Meiyu in the Yangtze River Valley Region and Relationship with the Pacific Decadal Oscillation.” Journal of Climate 32: 6251–6270. doi:10.1175/JCLI-D-19-0017.1.
- Sun, H. M., Y. J. Wang, J. Chen, J. Zhai, C. Jing, X. Zeng, H. Ju, et al. 2017. “Exposure of Population to Droughts in the Haihe River Basin under Global Warming of 1.5 And 2.0°C Scenarios.” Quarternary International 453: 74–84. doi:10.1016/j.quaint.2017.05.005.
- Sun, J. Q. 2014. “Record-breaking SST over mid-North Atlantic and Extreme High Temperature over the Jianghuai–Jiangnan Region of China in 2013.” Chinese Science Bulletin 59: 3465–3470. doi:10.1007/s11434-014-0425-0.
- Sun, Y., X. B. Zhang, F. W. Zwiers, L. C. Song, H. Wan, T. Hu, H. Yin, and G. Y. Ren. 2014. “Rapid Increase in the Risk of Extreme Summer Heat in Eastern China.” Nature Climate Change 4: 1082–1085. doi:10.1038/nclimate2410.
- Wang, J., H. J. Wang, and Y. Hong. 2016. “Comparison of Satellite-estimated and Model-forecasted Rainfall Data during a Deadly Debris-flow Event in Zhouqu, Northwest China.” Atmospheric and Oceanic Science Letters 9: 139–145. doi:10.1080/16742834.2016.1142825.
- Wu, J., and X. J. Gao. 2013. “A Gridded Daily Observation Dataset over China Region and Comparison with the Other Datasets (In chinese).” Chinese Journal of Geophysics 56: 1102–1111.
- Xu, Y., J. Wu, Y. Shi, B. T. Zhou, R. K. Li, and J. Wu. 2015. “Change in Extreme Climate Events over China Based on CMIP5.” Atmospheric and Oceanic Science Letters 8: 185–192. doi:10.1080/16742834.2015.11447258.
- Yu, E. T. 2018. “Warmer, Wetter and Less Windy China in the 21st Century Projected by a Nested High Resolution Simulation Using the Weather Research and Forecasting (WRF) Model.” Asia-Pacific Journal of Atmospheric Science 55 (1): 53–74.
- Yu, E. T., J. Q. Sun, and W. L. Xiang. 2013. “High-resolution Hindcast of Record-breaking Rainfall in Beijing and Impact of Topography.” Atmospheric and Oceanic Science Letters 6: 253‒258.
- Zhan, M. J., X. C. Li, H. M. Sun, J. Q. Zhai, T. Jiang, and Y. J. Wang. 2018. “Changes in Extreme Maximum Temperature Events and Population Exposure in China under Global Warming Scenarios of 1.5 And 2.0 Degrees C: Analysis Using the Regional Climate Model COSMO-CLM.” Journal of Meteorological Research 32: 99‒112. doi:10.1007/s13351-018-7016-y.
- Zhou, B. T., Q. Z. Wen Han, Y. Xu, L. C. Song, and X. B. Zhang. 2014. “Projected Changes in Temperature and Precipitation Extremes in China by the CMIP5 Multimodel Ensembles.” Journal of Climate 27: 6591–6611. doi:10.1175/JCLI-D-13-00761.1.
- Zhou, B. T., Y. Xu, J. Wu, S. Y. Dong, and Y. Shi. 2016. “Changes in Temperature and Precipitation Extreme Indices over China: Analysis of a High-resolution Grid Dataset.” International Journal of Climatology 36: 1051–1066. doi:10.1002/joc.2016.36.issue-3.