
ABSTRACT
Based on online observations of fine particulate matter (PM2.5) for five consecutive years from January 2013 to December 2017 in Beijing, combined with simultaneous measurement of gaseous precursors and meteorological parameters, the evolution and meteorological causes of fine-particle explosive growth (FPEG) events were analyzed. During the 5-year observation period, 132 FPEG events were observed and these events were further divided into three types (3-, 6-, and 9-h events) according to their evolution duration. The majority of FPEG events were observed in winter under the conditions of higher gas precursor concentrations and unfavorable meteorological conditions. The average concentration of PM2.5 during winter FPEG events changed little from 2013 to 2016, whereas it decreased significantly in 2017, in accordance with the similar variation of gaseous species (SO2, NO2, and CO). In addition, the higher wind speeds and lowest relative humidity observed in 2017 were also conducive to the decrease in PM2.5. The evolutions of FPEG events and normal haze episodes were analyzed, revealing that the rate of increase in NO2 was much greater than that of SO2, suggesting more of a contribution from mobile sources than stationary sources. The polarPlot results suggest that the transportation from the southeast area of Beijing plays a major role in the formation of 3-h events, whereas local emissions is the main contributory factor for 9-h events and normal haze episodes. However, further quantitative analysis regarding the contributions of these factors is still needed.
Graphical Abstract
摘要
本文详细分析了2013–2017年北京地区细颗粒物爆发增长事件的演变特征, 并结合气态前体物和常规气象要素对3种事件类型 (3h, 6h和9h事件) 的污染来源及其气象成因进行了探讨。北京地区细颗粒物爆发增长事件呈逐年下降趋势, 且多发生在秋冬季;事件的生消过程中NO2的增长速率远高于SO2, 表明移动源的贡献要高于固定源。风向-风速-PM2.5的polarPlot结果表明, 来自北京东南方向气团的污染物输送对于3h事件有较大影响, 9h事件受主要受局地排放及二次转化的影响, 6h事件则源于局地排放和区域传输的共同贡献。
1. Introduction
Due to socioeconomic development and the associated increase in the population and number of motor vehicles, there has been an increase in the level of anthropogenic pollution in central and eastern China in the past two or three decades (Zhang et al. Citation2011). Also, the type of air pollution in China has developed from point-source pollution in the 1980s to urban pollution in the 1990s. Since the turn of the twenty-first century, the nature of pollution has further evolved into a regional complex (Chan and Yao Citation2008), mainly characterized by the coexistence of high concentrations of fine particulate matter (PM2.5) and O3 (Hao, Cheng, and Wang Citation2012). PM2.5 levels and exceedances of national and international standards are several times higher in Asian countries, while levels in Europe and the USA are mostly well below their respective standards (Mukherjee and Agrawal Citation2017). It is believed that the combination of meteorological conditions, long-range transport, and local sources result in the high particulate matter pollution episodes (Vreeland et al. Citation2016; Begum, Hopke, and Markwitz Citation2013; Parrish et al. Citation2011). Exceeding standards set for the concentration of PM2.5 will not only cause a rapid deterioration of atmospheric visibility but will also affect air quality and have considerable detrimental impacts on human health. As such, haze pollution has captured widespread attention from the general public and research communities alike (Dockery and Pope Citation1994; Deng et al. Citation2008; Tie, Wu, and Brasseur Citation2009).
The Beijing–Tianjin–Hebei (BTH), Yangtze River Delta, and Pearl River Delta regions are three major hotspots of serious and frequent PM2.5 pollution events in China (Wang et al. Citation2013b). In order to study the characteristics of the evolution of fine particles during the process of haze pollution, many researchers have carried out long-term fixed-point atmospheric field observations and enhanced observations during pollution periods in the above three regions. Wang et al. (Citation2014) analyzed strong haze pollution events that occurred in the BTH region in January 2013, and their results showed consistency in the evolution of haze episodes among the cities in the region. In another study conducted in the BTH region, an average wind speed of less than 2 m s−1 was suggested to be a necessary condition for pollutant accumulation. In a haze episode study in the Yangtze River Delta region, Yang, He, and Ye (Citation2018) found that the superposition of local emissions and regional transmission of pollutants was the main contributory factor for the heavy haze pollution, while the duration of the haze pollution’s evolution was governed by the adverse meteorological conditions. Despite these research outcomes, the formation mechanism and evolution of heavy haze pollution episodes are not yet fully understood, particularly with respect to identifying the major contributory factors to the explosive growth of PM2.5 mass concentrations. Most of the previous works mentioned above on the explosive growth of PM2.5 events were based on case studies, with the overall temporal patterns having rarely been investigated. Therefore, the use of long-term online observational data and a more detailed comparison of emissions and meteorological conditions in different years is essential for better elucidating the impacts on haze pollution of changes in emissions and meteorological conditions.
In this study, 5 years (from January 2013 to December 2017) of online observations of PM2.5 at an urban site in Beijing were employed. In another paper (Liu et al. Citation2019), we established a method to define fine-particle explosive growth (FPEG) events (see Section 3.1) and discussed the evolutionary characteristics and formation mechanism of aerosol chemical components in cases of FPEG. This study combines observational data of gaseous precursors and meteorological elements in the same period of FPEG events to focus on the characteristics of their gaseous precursors and meteorological causes, thus providing a scientific basis for the proposal of optimal regulation measures to alleviate heavy haze pollution events in this region.
2. Methods
Five years of observations of hourly PM2.5 mass concentration, gaseous precursors (SO2, CO, NO2, O3) and meteorological data (wind speed, wind direction, temperature, humidity, pressure) were gathered continually at the Tower Branch of the Institute of Atmospheric Physics (IAP), Chinese Academy of Sciences (39°58′N, 116°22′E) from January 2013 to December 2017. The IAP site is located between the north third and fourth ring roads of Beijing, within educational, commercial and residential areas, representative of an area of typical urban particulate pollution in Beijing. In this study, the online measurements of PM2.5 and gaseous pollutants were achieved by using Tapered Element Oscillating Microbalance 1405-DF (TEOM 1405-DF) and Thermo Scientific™ i-series gas analyzers, respectively. In addition, the meteorological parameters were measured simultaneously with automatic meteorological observation instruments. A description of the observation site and the instruments is available in our previous paper (Liu et al. Citation2019); however, a brief summary is also provided in the Supplemental Material.
3. Results and discussion
3.1 General characteristics of fine particles and FPEG events during 2013–17
The interannual trend of the mass concentration of fine particles in Beijing from 2013 to 2017 is shown in Figure S1. The year of 2013 was the most polluted year in the 5-year period, with the annual average value of PM2.5 reaching 85.9 ± 80.9 μg m−3 and 43% of all days exceeding the National Ambient Air Quality (NAAQ) grade II standard (75 μg m−3). The annual average PM2.5 decreased to 57.1 ± 51.8 μg m−3 in 2017, with only 23% of days exceeding the NAAQ grade II standard, suggesting measures such as clean energy transformation, the demolition of coal-fired boilers, or the elimination of high-emission vehicles have had a significant effect on the improvement of air quality in Beijing (http://www.bjwmb.gov.cn/zxgc/sskd/t20180104_856228.htm). The seasonal trend of PM2.5 showed lowest values in summer (59.9 ± 46.4 μg m−3) and highest values in winter (97.6 ± 102.9 μg m−3) (Figure S1), consistent with previous results reported for Beijing (Wang et al. Citation2017). Generally, changes in emissions, meteorology, and patterns of long-rang transport can play an important role in the observed seasonal PM2.5 variations for Beijing (Liu et al. Citation2015). The higher concentrations of NO2 and SO2 observed during wintertime suggest both increased coal consumption for heating and a lack of oxidation during this season (Meng et al. Citation2010).
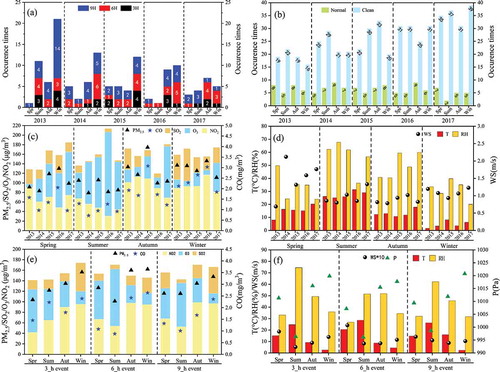
An FPEG event, based on our previous study (Liu et al. Citation2019), is denoted by the concentration of PM2.5 increasing rapidly from tens of micrograms per cubic meter (initial concentration less than 75 μg m−3) to hundreds of micrograms per cubic meter (peak concentration greater than 150 μg m−3) within less than several hours (usually 9 h). According to their duration, FPEG events were further divided into three types: 3-, 6-, and 9-h events. From 2013 to 2017, a total of 132 FPEG events were identified, showing a downward trend year by year ()), which is consistent with that of fine particles. In addition, FPEG events occurred mostly in winter and autumn, accounting for 70% of all events. Note that a significant decreasing trend of FPEG events was only observed in winter, decreasing from 21 events in 2013 to 5 events in 2017, and the 9-h events showed the most obvious decline. In contrast, the FPEG events in the other three seasons were almost stable. Aside from FPEG events, for comparative purposes, normal haze episodes, defined as two successive days with daily PM2.5 exceeding 75 μg m−3, were also analyzed (Wang et al. Citation2014). It was found that the interannual and seasonal trends of normal haze episodes were similar to those of FPEG events, showing a downward trend from 2013 to 2017 and mostly occurring in autumn and winter. On the contrary, clean days (daily PM2.5 < 35 μg m−3) increased year on year, and most were observed in summer.
Figure 1. Yearly and seasonal occurrence of (a) the three types of FPEG events (3-, 6-, and 9-h), and (b) normal haze episodes and clean days, from 2013 to 2017. (c, d) Yearly and (e, f) seasonal variations of average concentrations of gaseous precursors and meteorological parameters during FPEG events from 2013 to 2017.
3.2 Influence of gaseous precursors and meteorological factors
3.2.1 Interannual variations of gaseous precursors and meteorological factors
The concentration of atmospheric particulate matter is not only related to the intensity of emission sources but is also affected by atmospheric horizontal diffusion and vertical transport (Gao et al. Citation2017). Therefore, meteorological factors play an important role in the formation, evolution, transmission, and dissipation of pollutants (Zhong Citation2015). In order to further explore the interannual variation of fine particles in FPEG events, the yearly variation of gaseous species and meteorological factors in each season were analyzed during the observation period (January 2013 to December 2017). As shown in ), the concentration of PM2.5 during FPEG events in winter did not change obviously from 2013 to 2016 but decreased significantly in 2017. In winter 2017, the concentrations of CO and NO2 also decreased significantly compared with other years. Note that the higher wind speeds and lowest relative humidity (RH) in 2017 were conducive to the spread of pollutants and favored a decrease in air pollutants ()). Interestingly, the concentrations of CO and NO2 showed an upward trend from 2013 to 2016, indicating that FPEG events were more affected by traffic source emissions in the winters of 2013–16. In autumn, higher concentrations of PM2.5 were observed in 2015, whereas higher PM2.5 concentrations in summer appeared in 2013 and 2015, and that of spring appeared in 2016. Note that the higher PM2.5 concentrations in specific years were all in accordance with simultaneously higher concentrations of CO and NO2, as well as higher RH and lower winds.
3.2.2 Seasonal variations of gaseous precursors and meteorological factors
As shown in ), the majority of FPEG events in the North China were observed in winter, possibly because of enhanced anthropogenic emissions from, for example, coal-fired heating. In fact, the concentrations of NO2, SO2, and CO during the three types of FPEG events in winter were obviously higher than in other seasons ()), whereas the O3 concentration showed a summer-high and winter-low pattern, consistent with previous studies (So and Wang Citation2003; Wang et al. Citation2013a). In addition, the lowest temperatures and highest atmospheric pressures were also observed in winter, which may indicate a lower atmospheric boundary layer, weaker turbulent motion, and atmospheric convection (Tang et al. Citation2016), coupled with the occurrence of inversion phenomena in winter and increased stability of the atmosphere. Therefore, under the conditions of higher gas precursor concentrations and unfavorable meteorological conditions, the occurrence frequency of FPEG events is relatively high in winter. The concentrations of NO2, SO2, and CO during 6- and 9-h events were higher in spring than in summer, but the occurrence frequency of FPEG events was lower in spring than in summer, mainly due to the fact that the RH of 6- and 9-h events in spring was about 1.9 times lower than that in summer. Moreover, the wind speeds of 6-h (9-h) events in spring were about 2.9 (1.3) times higher than those in summer. The lower RH was not conducive to the secondary transformation of pollutants, and the higher wind speeds were conducive to the diffusion of pollutants, both of which contributed to the lower occurrence frequency of FPEG events in spring.
3.2.3 The evolutionary processes of FPEG events and normal haze episodes
In order to further explore the evolutionary processes of different types of FPEG events, the average hourly concentrations of gaseous precursors and meteorological factors during each type of FPEG event were calculated. In addition, the average concentrations of gaseous precursors and meteorological factors at different pollution levels during normal haze episodes were also calculated for comparison.
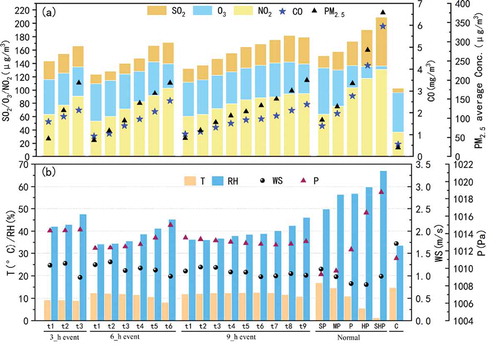
As shown in and Table S1, the concentrations of NO2, SO2, and CO increased with the development of 3-, 6-, and 9-h events and normal haze episodes. The growth rate of NO2 was 9.1 and 8.3 μg m−3 h−1 in 3 and 6-h events, respectively, while the value for normal haze episodes was 13.5 μg m−3 h−1, which was much higher than that for 9-h events (3.8 μg m−3 h−1). In comparison, the rate of increase for SO2 was much weaker than that for NO2, suggesting different contributions of mobile and stationary sources to the formation of haze episodes. Note that the concentration of O3 stayed almost constant during the evolution of FPEG events, while a significant decrease in O3 was observed during normal haze episodes, which decreased 44% from ‘slight pollution’ to ‘severely heavy pollution’. Interestingly, the average value of temperature decreased significantly during normal haze episodes, whereas the temperature kept constantly as FPEG developed (), which may suggest a stronger solar radiation during FPEG events and thus favoring the formation of O3. Therefore, the photochemical activity and atmospheric oxidation capacity should be more prevalent in FPEG events than in normal haze episodes. In addition, much lower wind speeds (around 1.0 m s−1) were observed for the three types of FPEG events and normal haze episodes, compared with those on clean days (1.75 m s−1), and a steady decrease in wind speed appeared when FPEG events developed. In contrast, the RH in FPEG events and normal haze episodes was much higher than that on clean days, among which normal haze episodes had the highest RH, followed by 3-, 6-, and then 9-h events. The turbulence and movement of convection became weaker under lower wind speeds, which was not conducive to the horizontal and vertical transport of pollutants (Tian Citation2013), and thus led to the accumulation of pollutants. In addition, the increase in RH would have caused more water vapor to condense on the surface of particles. After forming fog droplets, they would then sink in the lower atmosphere, making particles stay in the atmosphere for a long time, which is not conducive to the diffusion of pollutants (Wang and Wang Citation2018).
Figure 2. The variation of (a) gaseous precursors and (b) meteorological factors during the evolution of the three types of FPEG events (3-, 6-, and 9-h), as well as under different pollution levels of normal haze episodes and on clean days. The five pollution levels for normal haze episodes were identified according to the daily average concentration of PM2.5: slight pollution (SP, 75 μg m−3 < PM2.5 ≤ 115 μg m−3); moderate pollution (MP, 115 μg m−3 < PM2.5 ≤ 150 μg m−3); pollution (P, 150 μg m−3 < PM2.5 ≤ 250 μg m−3); heavy pollution (HP, 250 μg m−3 < PM2.5 ≤ 350 μg m−3 HP); and severely heavy pollution (SHP, PM2.5 > 350 μg m−3).
3.4 Source region analysis of FPEG events
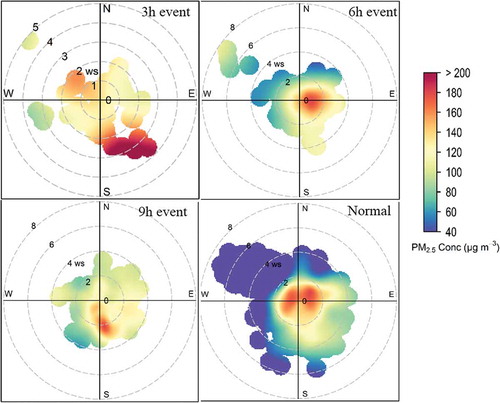
Meteorological factors play an important role in the formation, evolution, transmission, and dissipation of pollutants, and airflow in different directions and flow velocity have significant impacts on the concentrations of pollutants (Jiang et al. Citation2018). To explore from which direction air masses had a greater impact on the occurrence of FPEG events in Beijing, the polarPlot function in the open-air program package of the R program was used to analyze the radar chart of wind direction–velocity–PM2.5 mass concentration () for the three types of FPEG events and normal haze episodes. The polarPlot results show that the PM2.5 concentrations were generally lower than average with winds from the northwest and clockwise through to the northeast; meanwhile, they were generally greater than average with winds from the northeast through to the south. This kind of PM2.5–wind direction correlation pattern was similar among the three types of FPEG events and normal haze episodes. The higher values of PM2.5 mass concentration were concentrated in the southeast direction, consistent with previous findings (Liu et al. Citation2015). Air masses from regions southeast of Beijing, including Langfang, Hebei Province and Tianjin, which mostly emit large amounts of pollutants from industrial parks, chemical plants, and steel plants, and thus are relatively seriously polluted regions, increased the PM2.5 concentration in Beijing (Wang et al. Citation2009). Previous studies have shown that regional sources are a significant factor for particulate matter pollution in Beijing, suggesting about 70% of which can be attributed to sources outside Beijing during southerly wind flow (Streets et al. Citation2007). The observational results in the present study also suggest that regional sources are large contributors to the PM2.5 concentrations during FPEG events, and that the PM2.5 derived from sources south of Beijing, most likely secondary aerosols, significantly affects concentrations at the sampling site. The low concentrations of PM2.5 in FPEG events and normal haze episodes are concentrated in the northwest of Beijing, which, combined with higher wind speeds (>2 m s−1), are mainly due to the clean air masses that originate from remote regions northwest of Beijing (Wang et al. Citation2009). Note that a slight difference in wind speed dependence of PM2.5 was observed among the three types of FPEG events in the south-southeast direction; the average wind speed corresponding to high concentrations of PM2.5 in 3-h events was relatively higher than that for 6-h events, 9-h events, and normal haze episodes, indicating that the transportation of the southeast plays a more important role in the formation of 3-h events. Meanwhile, the relatively lower wind speeds in 9-h events and normal haze episodes reflect a more important contribution from local emissions. Note that the average wind speed during 6-h events in the northwest direction was higher than for the other three types, and associated with higher PM2.5 values, which suggests a combined contribution from both local emissions and regional transportation during 6-h events. It should be noted that the conclusion about the sources of 6-h events is different from that of our previous study (Liu et al. Citation2019), in which it is indicated, based on the evolution of the chemical composition of PM2.5, that there is a greater contribution from regional sources to the formation of 6-h events. This difference may come from the different observation periods of these two studies. In our previous study (Liu et al. Citation2019), only 4 months’ data (January, February, November, and December) were considered, while 1 year’s data were used in this study. In fact, if the same four months of data are analyzed with the polarPlot method, it is found that regional transportation in the northeast direction plays a major role in the formation of 6-h events (Figure S2), consistent with our previous study.
Figure 3. Radar chart of wind direction–velocity–PM2.5 mass concentration for the three types of FPEG events (3-, 6-, and 9-h) and the normal haze episodes.
4. Conclusion
During 2013–17, a total of 132 FPEG events were identified in Beijing, showing a downward trend year by year. Among the three types of FPEG events, 9-h events were the most abundant, with a total of 63. In terms of seasonal variation, the occurrence frequency of events in autumn and winter was higher than that in spring and summer, and the variation or trend of FPEG events was consistent with that of PM2.5. The majority of FPEG events were observed in winter under the conditions of higher gas precursor concentrations and unfavorable meteorological conditions. The average concentration of PM2.5 during winter FPEG events changed little from 2013 to 2016, whereas it decreased significantly in 2017, in accordance with similar variations of gaseous species (SO2, NO2, and CO), suggesting an important role played by emission control measures in decreasing fine particles. In addition, the higher wind speeds and lowest RH observed in 2017 favored the decrease in PM2.5. The evolutions of FPEG events and normal haze episodes were analyzed, revealing that the rate of increase in SO2 was much weaker than that of NO2, suggesting a greater contribution from mobile sources than stationary sources in the formation of FPEG events. The polarPlot results showed that PM2.5 concentrations were generally lower than average with winds from the northwest and clockwise through to northeast, whereas they were generally greater than average with winds from the northeast through to the south. This pattern of PM2.5–wind direction correlation was similar among the three types of FPEG events and normal haze episodes. Further analysis associated with the wind speed pattern suggested that the transportation of the southeast plays a more important role in the formation of 3-h events, while local emissions contribute more to 9-h events and normal haze episodes. In addition, the formation of 6-h events originated from the combined contributions of both local emissions and regional transportation. Our study suggests different roles played by local emissions and regional transportation in the formation of FPEG events and normal haze episodes; however, the quantitative contributions of these factors should be further resolved in future studies using numerical models.
Supplemental Material
Download PDF (470.3 KB)Disclosure statement
No potential conflict of interest was reported by the authors.
Supplemental data
Supplementary data for this article can be accessed here.
Additional information
Funding
Related Research Data
References
- Begum, B. A., P. K. Hopke, and A. Markwitz. 2013. “Air Pollution by Fine Particulate Matter in Bangladesh.” Atmospheric Pollution Research 4 (1): 75–86. doi:10.5094/APR.2013.008.
- Chan, K. C., and X. Yao. 2008. “Air Pollution in Mega Cities in China.” Atmospheric Environment 42 (1): 1–42. doi:10.1016/j.atmosenv.2007.09.003.
- Deng, X., X. Tie, D. Wu, X. Zhou, X. Bi, H. Tan, F. Li, and C. Hang. 2008. “Long-term Trend of Visibility and Its Characterizations in the Pearl River Delta (PRD) Region, China.” Atmospheric Environment 42 (7): 1424–1435. doi:10.1016/S0895-7061(02)03004-2.
- Dockery, D. W., and C. Pope. 1994. “Acute Respiratory Effects of Particulate Air Pollution.” Annual Review of Public Health 15 (1): 107–132. doi:10.1146/annurev.pu.15.050194.000543.
- Gao, M., Z. Liu, Y. Wang, X. Lu, D. Ji, L. Wang, M. Li, Z. Wang, Q. Zhang, and R. Carmichael Gregory. 2017. “Distinguishing the Roles of Meteorology, Emission Control Measures, Regional Transport, and Co-benefits of Reduced Aerosol Feedbacks in ‘APEC Blue’.” Atmospheric Environment 167: 476–486. doi:10.1016/j.atmosenv.2017.08.054.
- Hao, J., Z. Cheng, and S. Wang. 2012. “Research on the Current Situation and Control Measures of Air Pollution in China.” in Chinese. Environmental Protection (9): 17–20. doi:10.14026/j.cnki.0253-9705.2012.09.010.
- Jiang, Q., F. Wang, H. Zhang, and J. He. 2018. “Analysis of Relationship between PM2.5 And Gaseous Precursors in Beijing.” [In Chinese.] Environmental Science & Technology 41 (4): 77–84. doi:10.19672/j.cnki.1003-6504.2018.04.014.
- Liu, Z., B. Hu, L. Wang, F. Wu, W. Gao, and Y. Wang. 2015. “Seasonal and Diurnal Variation in Particulate Matter (PM10 and PM2.5) At an Urban Site of Beijing: Analyses from a 9-year Study.” Environmental Science Pollution Research 22: 627–642. doi:10.1007/s11356-014-3347-0.
- Liu, Z., B. Hu, D. Ji, M. Cheng, W. Gao, S. Shi, Y. Xie, et al. 2019. “Characteristics of Fine Particle Explosive Growth Events in Beijing, China: Seasonal Variation, Chemical Evolution Pattern and Formation Mechanism.” Science Total Environment 687 :1073–1086. doi:10.1016/j.scitotenv.2019.06.068.
- Meng, Z., X. Xu, T. Wang, X. Zhang, X. Yu, S. Wang, L. Lin, Y. Chen, Y. Jiang, and X. An. 2010. “Ambient Sulfur Dioxide, Nitrogen dioxide, and Ammonia at Ten Background and Rural Sites in China during 2007–2008.” Atmospheric Environment 44: 2625–2631. doi:10.1016/j.atmosenv.2010.04.008.
- Mukherjee, A., and M. Agrawal 2017. “A Global Perspective of Fine Particulate Matter Pollution and Its Health Effects.” In Reviews of Environmental Contamination and Toxicology. Reviews of Environmental Contamination and Toxicology (Continuation of Residue Reviews). Vol. 244, edited by F. A. Gunther and P. de Voogt, 5–51. doi:10.1007/398_2017_3
- Parrish, D. D., H. B. Singh, L. Molina, and S. Madronich. 2011. “Air Quality Progress in North American Megacities: A Review.” Atmospheric Environment 45 (39): 7015–7025. doi:10.1016/j.atmosenv.2011.09.039.
- So, K. L., and T. Wang. 2003. “On the Local and Regional Influence on Ground-level Ozone Concentrations in Hong Kong.” Environmental Pollution 123 (2): 307–317. doi:10.1016/S0269-7491(02)00370-6.
- Streets, D. G., J. S. Fu, C. Jang, J. Hao, K. He, X. Tang, Y. Zhang, et al. 2007. “Air Quality during the 2008 Beijing Olympic Games.” Atmospheric Environment 41 (3): 480–492. doi:10.1016/j.atmosenv.2006.08.046.
- Tang, G., J. Zhang, X. Zhu, T. Song, C. Munkel, B. Hu, K. Schafer, et al. 2016. “Mixing Layer Height and Its Implications for Air Pollution over Beijing, China.” Atmospheric Chemistry and Physics 16 (4): 2459–2475. doi:10.5194/acp-16-2459-2016.
- Tian, M. 2013. “Characteristics of PM2.5 And Its Precursor Pollutants during Haze Pollution in Beijing-Tianjin-Hebei Region.” [in Chinese.] Master diss., Beijing University of Chemical Technology.
- Tie, X., D. Wu, and G. Brasseur. 2009. “Lung Cancer Mortality and Exposure to Atmospheric Aerosol Particles in Guangzhou, China.” Atmospheric Environment 43 (14): 2375–2377. doi:10.1016/j.atmosenv.2009.01.036.
- Vreeland, H., J. J. Schauer, A. G. Russell, J. D. Marshall, A. Fushimi, G. Jain, K. Sethuraman, V. Verma, S. N. Tripathi, and M. H. Bergin. 2016. “Chemical Characterization and Toxicity of Particulate Matter Emissions from Roadside Trash Combustion in Urban India.” Atmospheric Environment 147: 22–30. doi:10.1016/j.atmosenv.2016.09.041.
- Wang, Y., X. Zhang, J. Zhao, X. Yu, and Q. Jiang. 2017. “Study on the Response of PM2.5 And PM10 Concentrations to the Ground Meteorological Conditions in Different Seasons in Beijing.” in Chinese. Environmental Monitoring in China 33 (2): 34–41. doi:10.19316/j.issn.1002-6002.2017.02.06.
- Wang, Y., and Z. Wang. 2018. “Characteristics of PM2.5 Concentration Variability and Its Meteorological Factors in Shanghai.” in Chinese. Arid Land Geography 41 (5): 1088–1096. doi:10.12118/j.issn.1000-6060.2018.05.22.
- Wang, Y., B. Hu, G. Tang, D. Ji, H. Zhang, J. Bai, X. Wang, and Y. Wang. 2013a. “Characteristics of Ozone and Its Precursors in Northern China: A Comparative Study of Three Sites.” Atmospheric Research 132 (4): 450–459. doi:10.1016/j.atmosres.2013.04.005.
- Wang, Y., L. Yao, Z. Liu, D. Ji, L. Wang, and J. Zhang. 2013b. “Formation of Haze Pollution in Beijing-Tianjin-Hebei Region and Their Control Strategies.” in Chinese. Bulletin of Chinese Academy of Sciences 28 (3): 353–363. doi:10.3969/j.issn.1000-3045.2013.03.009.
- Wang, Y., L. Yao, L. Wang, Z. Liu, D. Ji, G. Tang, J. Zhang, Y. Sun, B. Hu, and J. Xin. 2014. “Mechanism for the Formation of the January 2013 Heavy Haze Pollution Episode over Central and Eastern China.” Science China Earth Sciences 57: 14–25. doi:10.1007/s11430-013-4773-4.
- Wang, W., T. Primbs, S. Tao and S. L. M. Simonich. 2009. “Atmospheric Particulate Matter Pollution during the 2008 Beijing Olympics.” Environmental Science & Technology 43 (14): 5314–5320. doi:10.1021/es9007504.
- Yang, W., T. He, and X. Ye. 2018. “Analysis of a Process of Continuous Heavy Pollution in Yangtze River Delta in 2018.” in Chinese. Environmental Monitoring and Forewarning 10 (5): 12–17. doi:10.3969/j.issn.1674-6732.2018.05.003.
- Zhang, X., Y. Wang, T. Niu, X. C. Zhang, S. L. Gong, Y. Zhang, and J. Sun. 2011. “Atmospheric Aerosol Compositions in China: Spatial/temporal Variability, Chemical Signature, Regional Haze Distribution and Comparisons with Global Aerosols.” Atmospheric Chemistry and Physics 12 (2): 779–799. doi:10.5194/acp-12-779-2012.
- Zhong, X. 2015. “Research Progress of Height Characteristics of Atmospheric Boundary Layer under Pollution Weather in Beijing-Tianjin-Hebei.” in Chinese. Journal of Agricultural Catastrophology 5 (9): 33–34. doi:10.19383/j.cnki.nyzhyj.2015.09.012.