
 ?Mathematical formulae have been encoded as MathML and are displayed in this HTML version using MathJax in order to improve their display. Uncheck the box to turn MathJax off. This feature requires Javascript. Click on a formula to zoom.
ABSTRACT
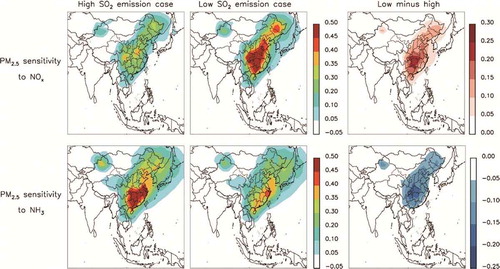
The authors evaluated and compared the behavior of PM2.5 with respect to NOx and NH3 emission changes in high (the year 2013) and low (the year 2018) SO2 emission cases. Two groups of simulations were conducted based on anthropogenic emissions from China in 2013 and 2018, respectively. In each group of simulations, a respective 25% reduction in NOx and NH3 emissions were assumed. A sensitivity factor (β) was defined as the relative change in PM2.5 concentration due to 1% change in NOx or NH3 emissions. In the high SO2 emissions case, PM2.5 was more sensitive to NH3 (0.31) emissions change than NOx (0.21). Due to the significant decrease in SO2 emissions from the high to low SO2 emissions case, the sensitivity of PM2.5 to NOx increased to 0.33, while its sensitivity to NH3 decreased to 0.22. The result implies that now and in the future, PM2.5 is/will be less sensitive to NH3 emissions change, while NOx emissions control is more effective in reducing the surface PM2.5 concentration. Seasonally, in the low SO2 emissions case, the sensitivities of PM2.5 to NOx and NH3 in winter were higher than those in summer, indicating that to deal with severe winter haze more attention should be paid to the emissions control of inorganic PM2.5 precursors, especially NOx.
Graphical abstract
摘要
随着大气污染防治计划的实施, 我国SO2排放量从2013年的25.4 Tg下降至2018年的10.5 Tg。SO2排放的大幅变化是否会影响PM2.5对NOx和NH3排放的敏感性尚不清楚。为此, 本研究采用GEOS-Chem全球大气化学传输模式, 评估了中国东部不同SO2排放水平下PM2.5对NOx和NH3敏感性的变化。结果表明: 2013年, PM2.5对NH3的敏感性 (0.31) 比NOx (0.21) 更强。2013~2018年, 由于SO2排放大幅下降, PM2.5对NOx的敏感性上升至0.33, 而对NH3的敏感性则下降到0.22。因此, 在较低的SO2排放情景下, 考虑到PM2.5对NH3的敏感性降低, 进一步消减NOx排放可能对降低PM2.5浓度有更好的效果。
1. Introduction
Secondary inorganic aerosols (sulfate, nitrate, and ammonium; simplified to SNA) are important constituents of PM2.5, occupying up to a half of the total PM2.5 mass (Pan et al. Citation2016; Wang et al. Citation2014). Sulfur dioxide (SO2), nitrogen oxides (NOx), and ammonia (NH3) are precursors of SNA. In the atmosphere, SO2 and NOx are oxidized to sulfuric acid (H2SO4) and nitric acid (HNO3), and then they are neutralized by NH3. NH3 prefers to form ammonium sulfate ((NH4)2SO4) first for its stability. Ammonium nitrate (NH4NO3) is semi-volatile, and the low temperature and high humidity are favorable for NH4NO3 staying in the condensation state. Emission changes of SO2, NOx, and NH3 will lead to changes in SNA concentration and then PM2.5 concentration.
The sensitivity of PM2.5 to SO2, NOx, and NH3 emission changes is estimated to evaluate emission control strategies and to design effective emission control policies (Wang et al. Citation2013; Zhang et al. Citation2019, Citation2015b). Wang et al. (Citation2013) reported that from 2000 to 2006, a large increase in SO2 (60%) and NOx (80%) emissions resulted in a 60% lifting of the SNA concentration over China. Since then, from 2006 to 2015, changes in SO2 (−16%) and NOx (+16%) emissions have led to an overall decrease in the surface SNA concentration, while an increase in NH3 emissions has offset the benefit of SO2 and NOx emissions control (Wang et al. Citation2013). Fu et al. (Citation2017) and Wang et al. (Citation2013) pointed out the necessity of NOx and NH3 emissions control for the high sensitivity of PM2.5 with respect to NOx and NH3 emissions change. However, these studies were conducted at a relatively high SO2 emissions level. From 2013 through 2017, observations from satellites have indicated a significant decrease in the SO2 column over China (Figure S1), and SO2 emissions from China were estimated to have decreased by 59% (Zheng et al. Citation2018). Considering the thermodynamic equilibrium among H2SO4, HNO3, and NH3, a sharp reduction in SO2 emissions will alter the sensitivity of the PM2.5 response to NOx and NH3 emission changes (Wang et al. Citation2013).
The purpose of this paper is to assess the influence of the large SO2 emissions reduction from 2013 to 2018 on the sensitivity of PM2.5 to NOx and NH3 emissions control and make recommendations for future emission control policies with respect to PM2.5 precursors. We introduce the model and simulation scenarios in section 2. In section 3, we discuss the sensitivity of PM2.5 to NOx and NH3 emission changes at different SO2 emission levels. Concluding remarks are given in section 4.
2. Model and simulation
2.1. Model description
We used the GEOS-Chem global chemical transport model (http://www.geos-chem.org), v11-1. The global version with a horizontal resolution of 2° × 2.5° was employed, driven by the MERRA-2 meteorology field. All simulations in this study used meteorology fields from December 2012 to December 2013, and the first month was for spin-up. The aerosol species considered in the GEOS-Chem model include SNA aerosol, carbonaceous aerosol, dust aerosol, sea salt, and marine POA (primary organic aerosols). SNA aerosol simulation coupled to gas-phase chemistry was originally described by Park et al. (Citation2004). SNA thermodynamics are calculated using the module of ISORROPIA II, developed by Fountoukis and Nenes (Citation2007). The default anthropogenic emissions in GEOS-Chem are from EDGAR v4.2 (EC-JRC/PBL, http://edgar.jrc.ec.europa.eu), and NH3 emissions are from the MASAGE inventory developed by Paulot et al. (Citation2014). We overwrote the anthropogenic emissions in East Asia with the MIX inventory (Li et al. Citation2017).
GEOS-Chem has been used to simulate PM2.5 and its constituents in China, and it has been proven to have good skill in simulating the spatiotemporal distribution and concentration level of aerosols. Zhang et al. (Citation2015a) reported a spatial correlation coefficient (R) of 0.65 between modeled and simulated PM2.5 in China, and Zhang et al. (Citation2018) reported an R of 0.85 for the day-to-day variation of PM2.5. Both found an underestimation of ~40% in the PM2.5 concentration simulated by the model, but the bias was within a reasonable performance level for chemical models to simulate PM2.5 (Eder and Yu Citation2006; Stewart et al. Citation2019). GEOS-Chem also performs well in simulating SNA aerosols. Wang et al. (Citation2013) and Zhang et al. (Citation2015b) reported a good ability of GEOS-Chem to simulate SO42− at weekly, monthly, and seasonal scales. However, the model was found to underpredict the SO42− concentration during severe haze days for a large percentage of them (Wang et al. Citation2014). It was improved through adding a heterogeneous oxidation procedure of SO2 to H2SO4 in the model, which was included in the simulations carried out in this work. NO3− and NH4+ overestimation is a typical problem of chemical models (Stewart et al. Citation2019; Wang et al. Citation2013). Heald et al. (Citation2012) recommended to reduce the HNO3 concentration when it is read into the SNA aerosol chemical module in the model, which was also included in this study.
2.2 Simulation scenarios
Two groups of simulations were conducted based on the emissions in the years 2013 and 2018, which are referred to as the high and low SO2 emission cases, respectively. We assumed a separate 25% decrease in NOx and NH3 emissions from China and calculated the sensitivity of PM2.5 to them.
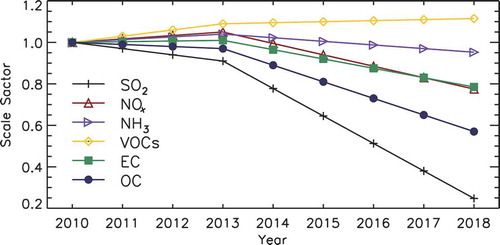
As mentioned, the default MIX inventory in GEOS-Chem is for the year 2010, and we scaled it up to obtain the emissions for 2013 and 2018. According to Zheng et al. (Citation2018), from 2010 to 2013, the emissions of the main PM2.5 precursors, i.e. SO2, NOx, non-methane volatile organic carbon (NMVOC), NH3, elemental carbon (EC), and organic carbon (OC), changed by −9%, 5%, 9%, 4%, 1%, and −3%, respectively. After the Air Pollution Prevention and Control Action Plan was delivered in 2013, emissions of the above species dropped largely from 2013 through 2017, especially for SO2. The relative emissions change of the six precursors were −59% for SO2, −21% for NOx, 2% for NMVOC, −3% for NH3, −28% for EC, and −32% for OC. We assumed emission changes were linear from 2010 to 2013 and from 2013 to 2017, and then performed a linear extrapolation for the year 2018. The scale factors are displayed in .
Figure 1. Emission scale factors based on the year 2010 for the main PM2.5 precursors.
3. Sensitivity of PM2.5 to NOx and NH3 emissions at different SO2 emission levels and in different seasons
Here, we discuss the sensitivity of PM2.5 with respect to NOx and NH3 emissions control in different SO2 emission cases and different seasons. We defined an efficiency factor (β) following the work of Zhang et al. (Citation2019), Zhang et al. (Citation2015b) to quantify and compare the PM2.5 sensitivities to NOx emissions change. β is defined as follows:
where represents the relative changes in the PM2.5 concentration and
denotes the relative change in NOx or NH3 emissions. In this study,
was 0.25 for all the simulations.
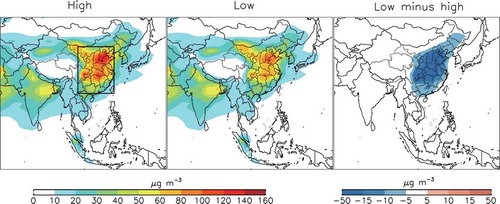
shows the annual mean PM2.5 distribution in the high and low SO2 emission cases and the difference between them. The PM2.5 concentration was much higher in the east than in the northeast or west, for both the high and low SO2 emission cases. Therefore, we focused on the east of China (22°–42°N, 102°–122°E) where the PM2.5 concentrations were highest. The annual mean PM2.5 concentration over East China decreased by 10.3 μg m−3 (19.6%) due to the emissions reduction from the high to low SO2 emissions case, 55% of which was driven by a reduction in the sulfate concentration. Seasonally, the reduction in the PM2.5 concentration was lower in winter (January, February, and December) than in summer (June, July, and August). Relatively, the PM2.5 reduction rate was 17.8% in winter, which was lower than the annual mean level; and it was 28.2% in summer, which was much higher than the annual mean rate of decrease. This indicates that the formation of aerosols is more easily affected by the emissions of precursors in summer.
Figure 2. Annual mean PM2.5 concentrations in the high and low SO2 emission cases, and their difference. The black box denotes the region of interest.
As shown in , in the high SO2 emissions case, the annual mean PM2.5 sensitivity with respect to NOx emissions reduction (β) was 0.21 over the region of interest. Seasonally, β in winter (0.22) and summer (0.23) was close to that of the annual mean. There was a sharp increase in β (53.3%) from the high to low SO2 emissions case at the annual mean level. In other words, under low SO2 emissions, the behavior of PM2.5 becomes more sensitive to NOx emissions change. This indicates that now and in the future, NOx emissions control is/will be more effective in reducing the PM2.5 concentration. The increase in β from the high to low SO2 emissions case varied from season to season. For the East China regional mean, β increased by more than 80% in winter, while in summer the rate of increase was approximately 20%. Different to that in the high SO2 emissions case, the wintertime β was much higher than the summertime one in the low SO2 emissions case. In winter, a reduction in SO2 emissions would release more free NH3 into the atmosphere, making NH4NO3 more sensitive to NOx emissions change. This explains the large increase in β in winter. The results imply that now and in the future, NOx emissions control is/will be more effective in dealing with severe winter haze than in previous years.
Figure 3. PM2.5 sensitivity to NOx emissions change in the high (left-hand column) and low (middle column) SO2 emission cases, and their difference (right-hand column). The rows show the annual (top), winter (middle), and summer (bottom) mean.
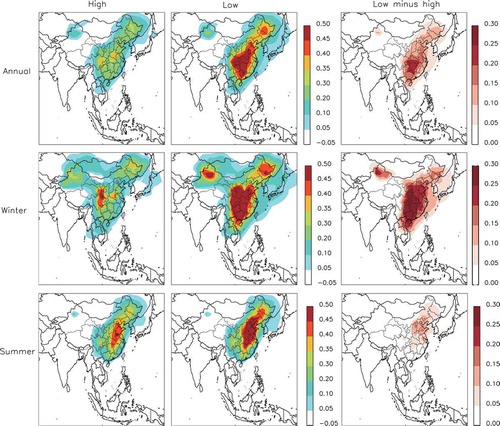
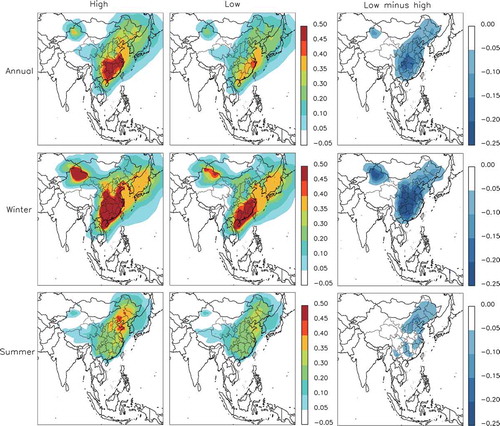
The behavior of PM2.5 with respect to NH3 emissions control is displayed in . In the high SO2 emissions case, PM2.5 was 47.6% more sensitive to NH3 than to NOx emissions change, with an annual mean β of 0.31. Seasonally, β was higher in winter (0.43) than in summer (0.24), in contrast to that in the NOx emissions control condition. The sensitivity of PM2.5 to NH3 emissions change fell by 30.1% from the high to low SO2 emissions case, and the decrease was more significant in winter (32.6%) than in summer (20.7%). Notably, in the low SO2 emissions case, the sensitivity of PM2.5 to NH3 emissions change (0.22) was 32.7% lower than it was to NOx emissions change. The result indicates that (1) when SO2 emissions decrease, more free NH3 is released to the atmosphere, making NH3 emissions control less effective at reducing the surface PM2.5 concentration; and (2) now and in the future, it is/will be more effective to reduce the PM2.5 concentration by controlling NOx rather than NH3 emissions.
Figure 4. PM2.5 sensitivity to NH3 emissions change in the high (left-hand column) and low (middle column) SO2 emission cases, and their difference (right-hand column). The rows show the annual (top), winter (middle), and summer (bottom) mean.
4. Conclusion
The reduction in emissions of the precursors of PM2.5 from 2013 to 2018 resulted in a 19.6% decrease in the surface PM2.5 concentration over East China (22°–42°N, 102°–122°E), most of which was driven by the significant decrease in the sulfate concentration. The substantial decrease in SO2 emissions and the sulfate concentration were expected to have altered the sensitivity of PM2.5 to NOx and NH3 emission changes. Therefore, we conducted model sensitivity studies to assess the changes in PM2.5 sensitivities to NOx and NH3 emission changes owing to the large decrease in SO2 emissions from 2013 to 2018.
In the high SO2 emissions case (the year 2013), PM2.5 was 47.6% more sensitive to NH3 emissions change than NOx, which was mostly driven by winter. From the high to low SO2 emissions case, the PM2.5 sensitivity factor (β) for NH3 decreased by 30.1%, while for NOx it increased by 53.3%, and the PM2.5 sensitivity was 48.6% higher to NOx than NH3. Seasonally, in the low SO2 emissions case, the PM2.5 sensitivities to both NOx and NH3 were higher in winter than in summer.
Based on the results of this work, we conclude that now and in the future, the behavior of PM2.5 is/will become less sensitive to NH3 emission changes, while NOx emissions control is more effective at reducing the surface PM2.5 concentration, especially in winter.
Supplemental Material
Download PDF (273.1 KB)Disclosure Statement
No potential conflict of interest was reported by the authors.
Supplementary material
Supplemental data for this article can be accessed here.
Additional information
Funding
References
- Eder, B., and S. C. Yu. 2006. “A Performance Evaluation of the 2004 Release of Models-3 Cmaq.” Atmospheric Environment 40 (26): 4811–4824. doi:10.1016/j.atmosenv.2005.08.045.
- Fountoukis, C., and A. Nenes. 2007. “Isorropia Ii: A Computationally Efficient Thermodynamic Equilibrium Model for K+–Ca2+–Mg2+–NH4+–Na+–SO42––NO3––Cl––H2O Aerosols.” Atmospheric Chemistry and Physics 7 (17): 4639–4659. doi:10.5194/acp-7-4639-2007.
- Fu, X., S. Wang, J. Xing, X. Zhang, T. Wang, and J. Hao. 2017. “Increasing Ammonia Concentrations Reduce the Effectiveness of Particle Pollution Control Achieved via So2 and Nox Emissions Reduction in East China.” Environmental Science & Technology Letters 4 (6): 221–227. doi:10.1021/acs.estlett.7b00143.
- Heald, C. L., J. L. Collett, T. Lee, K. B. Benedict, F. M. Schwandner, Y. Li, L. Clarisse, et al. 2012. “Atmospheric Ammonia and Particulate Inorganic Nitrogen over the United States.” Atmospheric Chemistry and Physics 12 (21): 10295–10312. doi:10.5194/acp-12-10295-2012.
- Li, M., Q. Zhang, J. Kurokawa, J. H. Woo, K. B. He, Z. F. Lu, T. Ohara, et al. 2017. “Mix: A Mosaic Asian Anthropogenic Emission Inventory under the International Collaboration Framework of the Mics-asia and Htap.” Atmospheric Chemistry and Physics 17 (2): 935–963. doi:10.5194/acp-17-935-2017.
- Pan, Y. P., Y. S. Wang, J. K. Zhang, Z. R. Liu, L. Wang, S. L. Tian, G. Q. Tang, et al. 2016. “Redefining the Importance of Nitrate during Haze Pollution to Help Optimize an Emission Control Strategy.” Atmospheric Environment 141 : 197–202. doi:10.1016/j.atmosenv.2016.06.035.
- Park, R. J., D. J. Jacob, B. D. Field, R. M. Yantosca, and M. Chin. 2004. “Natural and Transboundary Pollution Influences on Sulfate-nitrate-ammonium Aerosols in the United States: Implications for Policy.” Journal of Geophysical Research-Atmospheres 109 (D15). doi:10.1029/2003jd004473.
- Paulot, F., D. J. Jacob, R. W. Pinder, J. O. Bash, K. Travis, and D. K. Henze. 2014. “Ammonia Emissions in the United States, European Union, and China Derived by High-resolution Inversion of Ammonium Wet Deposition Data: Interpretation with a New Agricultural Emissions Inventory (Masage_nh3).” Journal of Geophysical Research-Atmospheres 119 (7): 4343–4364. doi:10.1002/2013jd021130.
- Stewart, D. R., E. Saunders, R. Perea, R. Fitzgerald, D. E. Campbell, and W. R. Stockwell. 2019. “Projected Changes in Particulate Matter Concentrations in the South Coast Air Basin Due to Basin-wide Reductions in Nitrogen Oxides, Volatile Organic Compounds, and Ammonia Emissions.” Journal of the Air & Waste Management Association 69 (2): 192–208. doi:10.1080/10962247.2018.1531795.
- Wang, Y. X., Q. Zhang, J. Jiang, W. Zhou, B. Wang, K. He, F. Duan, et al. 2014. “Enhanced Sulfate Formation during China’s Severe Winter Haze Episode in January 2013 Missing from Current Models.” Journal of Geophysical Research: Atmospheres 119 (17): 10,425–410,440. doi:10.1002/2013jd021426.
- Wang, Y. X., Q. Q. Zhang, K. He, Q. Zhang, and L. Chai. 2013. “Sulfate-nitrate-ammonium Aerosols over China: Response to 2000–2015 Emission Changes of Sulfur Dioxide, Nitrogen Oxides, and Ammonia.” Atmospheric Chemistry and Physics 13 (5): 2635–2652. doi:10.5194/acp-13-2635-2013.
- Zhang, L., L. Liu, Y. Zhao, S. Gong, X. Zhang, D. K. Henze, S. L. Capps, et al. 2015a. “Source Attribution of Particulate Matter Pollution over North China with the Adjoint Method.” Environmental Research Letters 10 (8): 084011. doi:10.1088/1748-9326/10/8/084011.
- Zhang, Q. Q., Q. Ma, B. Zhao, X. Liu, Y. Wang, B. Jia, and X. Zhang. 2018. “Winter Haze over North China Plain from 2009 to 2016: Influence of Emission and Meteorology.” Environmental Pollution 242 (Pt B): 1308–1318. doi:10.1016/j.envpol.2018.08.019.
- Zhang, Q. Q., Y. Pan, Y. He, Y. Zhao, L. Zhu, X. Zhang, X. Xu, et al. 2019. “Bias in Ammonia Emission Inventory and Implications on Emission Control of Nitrogen Oxides over North China Plain.” Atmospheric Environment 214 : 116869. doi:10.1016/j.atmosenv.2019.116869.
- Zhang, Q. Q., Y. Wang, Q. Ma, Y. Yao, Y. Xie, and K. He. 2015b. “Regional Differences in Chinese SO2 Emission Control Efficiency and Policy Implications.” Atmospheric Chemistry and Physics 15 (11): 6521–6533. doi:10.5194/acp-15-6521-2015.
- Zheng, B., D. Tong, M. Li, F. Liu, C. P. Hong, G. N. Geng, H. Y. Li, et al. 2018. “Trends in China’s Anthropogenic Emissions since 2010 as the Consequence of Clean Air Actions.” Atmospheric Chemistry and Physics 18 (19): 14095–14111. doi:10.5194/acp-18-14095-2018.