
 ?Mathematical formulae have been encoded as MathML and are displayed in this HTML version using MathJax in order to improve their display. Uncheck the box to turn MathJax off. This feature requires Javascript. Click on a formula to zoom.
ABSTRACT
The intensity of interannual variability (IIV) of the monsoon and monsoon–ENSO biennial relationship (MEBR) were examined and compared for both the Indian summer monsoon (ISM) and western North Pacific summer monsoon (WNPSM) during 1958–2018. Covariability of the IIV and MEBR were identified for the two monsoons. When the MEBR was strong (weak), the IIV of the monsoon was observed to be large (small). This rule applied to both the ISM and WNPSM. Out-of-phase relationships were found between the ISM and the WNPSM. When the IIV and MEBR of the ISM were strong (weak), those of the WNPSM tended to be weak (strong). During the period with a stronger (weaker) ENSO–Atlantic coupling after (before) the mid-1980s, the IIV and MEBR of the WNPSM (ISM) were observed to be stronger. The increasing influences from the tropical Atlantic sea surface temperature (SST) may trigger the observed seesaw pattern of the ISM and WNPSM in terms of the IIV and MEBR multidecadal variability. The results imply that tropical Atlantic SST may need to be given more attention and consideration when predicting future monsoon variability of the ISM and WNPSM.
Graphical Abstract

摘要
印度夏季风和西北太平洋夏季风是亚洲季风系统的重要组成部分, 研究这两个季风的变异规律具有重要的科学和现实意义。我们在研究中发现热带大西洋海温的影响在最近年代的显著增强可以激发印度和西北太平洋夏季风之间的‘跷跷板’现象, 引起这两个季风在年际变化强度和季风–ENSO准两年关系方面的年代际反位相变化。在80年代中期之后(之前), ENSO和热带大西洋 (热带印度洋) 海表面温度具有更强的耦合, 从而支持西北太平洋夏季风 (印度夏季风) 可以表现出更强的年际变化强度和季风–ENSO准两年关系。在预测未来的亚洲夏季风变化时, 热带大西洋海温的影响可能需要给予更多的考虑。
1. Introduction
The Indian summer monsoon (ISM) and western North Pacific summer monsoon (WNPSM) are two major subcomponents of the Asian summer monsoon (Wang, Wu, and Lau Citation2001). A better understanding of the ISM and WNPSM variability is of vital importance both in a socioeconomic and scientific sense.
It is known that the ISM and WNPSM experience prominent interannual variations in close association with ENSO (e.g., Rasmusson and Carpenter Citation1983; Li and Wang Citation2005). Remarkably different interannual variability has also been revealed by contrasting these two monsoons (Wang, Wu, and Lau Citation2001; Gu et al. Citation2010). Significant interdecadal changes in these two monsoons and their relationship with ENSO have also been found (e.g., Kumar, Rajagopalan, and Cane Citation1999; Torrence and Webster Citation1999; Krishnamurthy and Goswami Citation2000; Wang et al. Citation2008).
The ISM and WNPSM may also feed back to ENSO (e.g., Yasunari Citation1990; Chung and Nigam Citation1999; Kirtman and Shukla Citation2000; Kim and Lau Citation2001; Wu and Kirtman Citation2003). Therefore, there may be an interaction between the monsoon and ENSO, rendering the biennial variability and biennial relationship in the ENSO–monsoon system (e.g., Kim and Lau Citation2001; Loschnigg et al. Citation2003; Wu and Kirtman Citation2004). For the WNPSM, it tends to be strengthened (weakened) in the El Niño developing (decaying) summer, which can form the monsoon–ENSO biennial relationship (MEBR) (e.g., Li and Wang Citation2005). A similar biennial relationship can be found between the ISM and ENSO (e.g., Wu and Kirtman Citation2004), involving a remarkable biennial monsoon tendency associated with the ENSO turnabout.
However, an integrated picture of the covariability in the intensity of interannual variability (IIV) of the monsoon and the MEBR has not been examined quantitatively for the ISM and WNPSM in previous studies. The results presented here are dedicated to filling the knowledge gap in this area.
2. Data and method
The following two monthly datasets were used in this study: the NCEP–NCAR reanalysis (Kalnay et al. Citation1996) and ERSST.v3b (Smith et al. Citation2008).
The following climate indices were used in the analysis: (1) The ISM index was defined as the difference in the 850-hPa zonal winds between (5°–15°N, 40°–80°E) and (20°–30°N, 70°–90°E) (Wang, Wu, and Lau Citation2001); (2) The WNPSM index was defined by using the 850-hPa zonal winds difference between (5°–15°N, 100°–130°E) and (20°–30°N, 110°–140°E) (Wang and Fan Citation1999); (3) The Niño3.4 index was defined by the sea surface temperature (SST) anomalies averaged over (5°S–5°N, 170°–120°W); (4) A tropical Atlantic SST index during boreal summer (June–July–August; JJA) was defined by the SST anomalies averaged over (20°S–20°N, 80°W–10°E), according to Jin and Huo (Citation2018); (5) The Indian Ocean Dipole Mode Index (DMI) (Saji et al. Citation1999) was defined by the SST difference between (10°S–10°N, 50°–70°E) and (10°S–0°, 90°–110°E).
The IIV of the monsoon was defined by the standard deviation of the interannual monsoon index. A 9-yr high-pass filter was applied to obtain the interannual variability, with the long-term trend and seasonal cycle having first been removed from the original time series.
To measure the strength of the MEBR quantitatively, we defined an MEBR index (MEBRI) as follows:
where Cor1 is the correlation coefficient between the JJA monsoon index and preceding boreal winter (December–January–February; DJF) Niño3.4 index, and Cor2 is the correlation coefficient between the JJA monsoon index and subsequent DJF Niño3.4 index. We added the factor of −1 into EquationEquation (1)(1)
(1) to ensure that the calculated MEBRI was a large positive value if there was a strong MEBR, considering that a strong MEBR requires opposite signs of Cor1 and Cor2 (one to be positive and the other to be negative). Therefore, a larger (smaller) MEBRI indicates a stronger (weaker) biennial relationship between the monsoon and ENSO.
3. Results
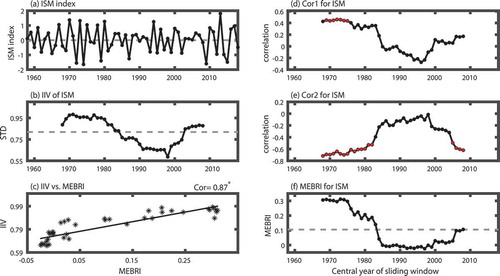
The ISM index experienced remarkable interannual variability during 1958–2018 ()). A 21-yr running standard deviation ()) was used to examine possible decadal changes in the IIV of the ISM. Also, 21-yr sliding correlation analyses (,e)) were applied to assess the decadal changes in the MEBR of the ISM (()). The temporal variations of the curves in ,f) are similar, supporting the in-phase covariability of IIV and MEBR ()). Before the mid-1980s, a relatively larger IIV of the ISM could be observed ()). Meanwhile, significantly positive Cor1 ()) and negative Cor2 ()) produced a stronger MEBR ()). After the mid-1980s, significant weakening was observed for both the IIV and MEBR.
Figure 1. In-phase covariability of the IIV and MEBR for the ISM. (a) Time series of JJA ISM index on the interannual time scale during 1958–2018. (b) The 21-yr sliding IIV of the ISM based on the 21-yr running standard deviation. (c) Scatterplot between the 21-yr sliding IIV of the ISM and 21-yr sliding MEBRI for the ISM. 21-yr sliding correlation coefficients between (d) the JJA monsoon index and preceding DJF Niño3.4 index (i.e., Cor1 in EquationEquation (1)(1)
(1) ), (e) the JJA monsoon index and subsequent DJF Niño3.4 index (i.e., Cor2 in EquationEquation (1)
(1)
(1) ). (f) The 21-yr sliding MEBRI for the ISM based on EquationEquation (1)
(1)
(1) . The dashed lines in (b) and (f) represent the long-term mean values during the analysis period. The red dots in (d) and (e) denote the correlation is significant at the 0.05 level. The asterisk next to the correlation coefficient in the upper-right corner of (c) indicates that the correlation is significant at the 0.05 level.
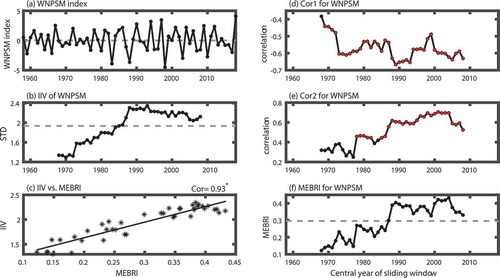
A similar in-phase covariability of the IIV and MEBR could also be found for the WNPSM (). After the mid-1980s, the IIV of the WNPSM intensified greatly ()). Interestingly, the IIV of the WNPSM has strengthened substantially during recent decades, even though the IIV of ENSO has weakened (e.g., Hu et al. Citation2013). Meanwhile, significantly negative Cor1 ()) and larger positive Cor2 ()) caused a stronger MEBR for the WNPSM after the mid-1980s ()). Direct comparisons also supported a close in-phase relationship ()).
Figure 2. In-phase covariability of the IIV and MEBR for the WNPSM. (a) Time series of JJA WNPSM index on the interannual time scale during 1958–2018. (b) The 21-yr sliding IIV of the WNPSM based on the 21-yr running standard deviation. (c) Scatterplot between the 21-yr sliding IIV of the WNPSM and 21-yr sliding MEBRI for the WNPSM. 21-yr sliding correlation coefficients between (d) the JJA WNPSM index and preceding DJF Niño3.4 index (i.e., Cor1 in EquationEquation (1)(1)
(1) ), (e) the JJA WNPSM index and subsequent DJF Niño3.4 index (i.e., Cor2 in EquationEquation (1)
(1)
(1) ). (f) The 21-yr sliding MEBRI for the WNPSM based on EquationEquation (1)
(1)
(1) . The dashed lines in (b) and (f) represent the long-term mean values during the analysis period. The red dots in (d) and (e) denote the correlation is significant at the 0.05 level. The asterisk next to the correlation coefficient in the upper-right corner of (c) indicates that the correlation is significant at the 0.05 level.
These results indicate that the variation of the ISM and WNPSM could follow the same rule, in terms of the in-phase covariability between the IIV of the monsoon and MEBR. When the MEBR is strong (weak), the IIV of the monsoon is observed to be large (small). The above rule applies to both the ISM and WNPSM.
We further took more detailed comparisons between the ISM and WNPSM (), in terms of the IIV and MEBR. A particularly noticeable seesaw pattern of the ISM and WNPSM could be observed ( and ), supporting the out-of-phase relationships between the two monsoons in terms of their IIV ()) and MEBR ()). After the mid-1980s, an enhanced (suppressed) IIV and MEBR were observed for the WNPSM (ISM). In contrast, before the mid-1980s, the opposite situation occurred with the opposite sign.
Figure 3. Out-of-phase covariability between the ISM and the WNPSM in terms of their IIV and MEBR variability. (a) Scatterplot between the 21-yr sliding IIV of the ISM and that of the WNPSM, (b) Scatterplot between the 21-yr sliding MEBRI of the ISM and that of the WNPSM. The asterisk next to the correlation coefficient in the upper-right corner indicates that the correlation is significant at the 0.05 level.
Why could an obvious out-of-phase relationship be observed between the ISM and the WNPSM in terms of both their IIV and MEBR? The increasing influences from the JJA tropical Atlantic SST anomalies associated with ENSO during recent decades () might be one important modulator. The JJA tropical Atlantic SST could exert different influences on the ISM and WNPSM, leading to changes in opposite signs of the two monsoons in terms of their IIV and MEBR.
Figure 4. Increasing influences from the tropical Atlantic SST. 21-yr sliding correlation coefficients between (a) JJA Niño3.4 index and JJA tropical Atlantic SST index, (b) JJA tropical Atlantic SST index and JJA WNPSM index. Scatterplot between the 21-yr sliding ENSO–Atlantic coupling index and (c) 21-yr sliding IIV of the WNPSM, and (d) 21-yr sliding MEBRI of the WNPSM. (e) The warming trend of JJA tropical Atlantic SST during 1958–2018. (f) 21-yr sliding correlation coefficients between JJA Niño3.4 index and JJA DMI. Scatterplot between the 21-yr sliding ENSO–Indian Ocean coupling index and (g) 21-yr sliding IIV of the ISM, and (h) 21-yr sliding MEBRI of the ISM. The red dots in (a), (b), and (f) denote the correlation is significant at the 0.05 level. The asterisk next to the correlation coefficient in the upper-right corner indicates that the correlation is significant at the 0.05 level.
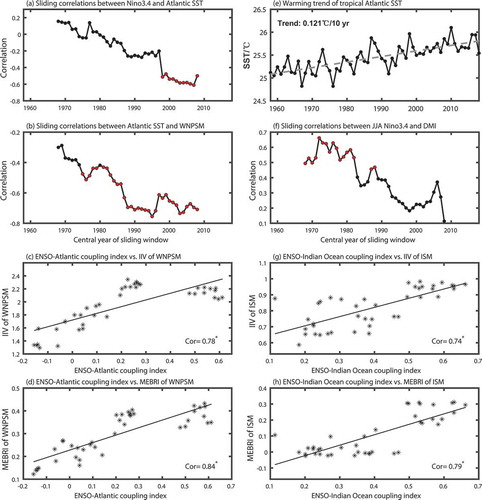
Negative correlations could be found between the JJA Niño3.4 index and tropical Atlantic SST ()), indicating that warm JJA Niño3.4 SST anomalies were coincidental with cold JJA tropical Atlantic SST anomalies. The associations between the JJA Niño3.4 index and tropical Atlantic SST showed a strengthening trend ()), suggesting that the coupling between ENSO and the tropical Atlantic was possibly intensified. Negative simultaneous correlations could also be observed between the JJA tropical Atlantic SST and WNPSM ()). The negative correlation indicated that warm JJA tropical Atlantic SST anomalies may cause the WNPSM to weaken, which is consistent with the results reported by Jin and Huo (Citation2018). The sliding correlations further revealed that the influences from tropical Atlantic SST on the WNPSM have been increasing ()). Recent studies have also suggested the possibility of increasing impacts of the tropical Atlantic SST on the WNPSM and ISM during recent decades (e.g., Wang and Yu Citation2018; Srivastava, Chakraborty, and Nanjundiah Citation2019).
Increasing influences from the tropical Atlantic SST may be related to its persistent warming trend ()). The calculated warming trend of the background tropical Atlantic SST during 1958–2018 was 0.121°C/10 yr, which was significantly higher than the mean global SST warming trend (0.105°C/10 yr) in tropical regions between 20°S and 20°N. Furthermore, the warming trend of tropical Atlantic SST was found to be higher than other individual tropical regions, including the tropical eastern North Pacific (0.093°C/10 yr), tropical western North Pacific (0.112°C/10 yr), and tropical Indian Ocean (0.116°C/10 yr). The highest SST warming rate in the tropical Atlantic and lowest one in the tropical eastern North Pacific may greatly enhance the inter-basin SST gradient, possibly favoring a stronger Pacific–Atlantic coupling. The observed persistent warming trend of background tropical Atlantic SST may be due to combined effects from the global warming trend and the recent phase change (from a negative to a positive phase) of the Atlantic Multidecadal Oscillation, as suggested in Wang, Yu, and Paek (Citation2017).
The joint effects from JJA Niño3.4 SST and tropical Atlantic SST could exert different influences on the ISM and WNPSM. The physical processes and mechanisms for the impact from JJA tropical Atlantic SST have been proposed and documented in previous studies on the ISM (e.g., Kucharski et al. Citation2008, Citation2009) and WNPSM (e.g., Hong, Chang, and Hsu Citation2014; Jin and Huo Citation2018). Generally, it is through atmospheric teleconnection (e.g., atmospheric waves and Walker circulation anomalies) that the JJA tropical Atlantic SST can convey its impacts on both the ISM and WNPSM. The warm JJA tropical Atlantic SST anomalies may excite the trans-basin atmospheric zonal vertical circulation anomalies with ascending anomalies over the tropical Atlantic and descending anomalies over the equatorial central Pacific (e.g., Hong, Chang, and Hsu Citation2014; Jin and Huo Citation2018). This anomalous descending motion over the equatorial central Pacific could further induce a low-level anticyclonic anomaly to the west, which could suppress the WNPSM. In the meantime, the warm tropical Atlantic SST anomalies could produce heating anomalies and excite Gill–Matsuo-type atmospheric wave responses, which could suppress the ISM (e.g., Kucharski et al. Citation2007, Citation2008, Citation2009; Wang et al. Citation2009). Therefore, warm (cold) tropical Atlantic SST anomalies could suppress (enhance) both the ISM and WNPSM. Next, we examine a situation where warm JJA Niño3.4 SST and cold JJA tropical Atlantic SST anomalies co-occurred, considering the negative correlation between them ()). Warm JJA Niño3.4 SST anomalies tended to weaken (strengthen) the ISM (WNPSM), while cold Atlantic SST anomalies tended to strengthen (strengthen) the ISM (WNPSM). Hence, the reinforcing effects (offsetting effects) from JJA cold Atlantic SST anomalies could amplify (overshadow) the influences from JJA Niño3.4 SST anomalies on the WNPSM (ISM) due to the constructive interference (destructive interference), leading to more active (inactive) variation and stronger (weaker) correlation with ENSO in the WNPSM (ISM). The conclusion that the influences from tropical Atlantic SST could change the strength of the monsoon–ENSO relationship is also supported by previous studies of the ISM by using numerical modeling (e.g., Kucharski et al. Citation2007) and for the WNPSM (e.g., Rong, Zhang, and Li Citation2010; Wu and Wang Citation2019). Therefore, after the mid-1980s, the WNPSM (ISM) showed a strong (weak) IIV and MEBR due to the enhanced influences from tropical Atlantic SST, generating the out-of-phase relationship between the WNPSM and ISM.
Before the mid-1980s, weaker ENSO–Atlantic coupling ()) and suppressed influences from JJA tropical Atlantic SST ()) were found. In contrast, stronger coupling between the JJA Niño3.4 SST and JJA tropical Indian Ocean SST anomalies could be identified during this period (Wang and Yu Citation2018). The warm JJA western North tropical Indian Ocean SST anomalies could hamper and cancel out the influences of JJA warm Niño3.4 SST anomalies on the WNPSM, resulting in the weakening of the WNPSM–ENSO correlation (Wu and Wang Citation2019). In contrast, stronger ENSO–Indian Ocean coupling may support an active ISM (e.g., Wang and Yu Citation2018; Srivastava, Chakraborty, and Nanjundiah Citation2019), possibly with stronger variations and closer associations with ENSO. Therefore, stronger ENSO–Indian Ocean coupling may support the stronger (weaker) IIV and MEBR of the ISM (WMPSM) before the mid-1980s.
This ENSO–Indian Ocean coupling tended to weaken remarkably after the mid-1980s ()), accompanying the striking enhancement in the ENSO–Atlantic coupling ()). This out-of-phase tendency in the strength between the ENSO–Indian Ocean and ENSO–Atlantic coupling can be understood from the perspective of the ENSO type shift during recent decades. Central Pacific (CP)-type ENSO events have occurred more frequently during recent decades (e.g., Yu et al. Citation2015), while Eastern Pacific (EP)-type ENSO events were the dominant ENSO type before the 1990s. Considering that tropical Indian Ocean SST anomalies have a stronger association with EP ENSO than with CP ENSO (Yuan, Yang, and Zhang Citation2012), it is natural that stronger (weaker) ENSO–Indian Ocean coupling can be observed when EP (CP) ENSO is more dominant. In contrast, CP ENSO tends to be more related with the influences from the tropical Atlantic SST (e.g., Ham et al. Citation2013), possibly supporting a stronger ENSO–Atlantic coupling. In addition, more frequent occurrences of CP ENSO may be associated with the increased influences of the Atlantic SST on the Pacific during recent decades (e.g., Yu et al. Citation2015; Wang, Yu, and Paek Citation2017). Therefore, the increasing influences from the Atlantic SST may contribute to the ENSO type shift from EP to CP ENSO, thus giving rise to the weakening (strengthening) in the ENSO–Indian Ocean (ENSO–Atlantic) coupling.
We further defined an ENSO–Atlantic coupling index using the reversed-sign correlation coefficient between JJA Niño3.4 index and tropical Atlantic SST index. We used the correlation coefficient with opposite sign in defining this index to ensure that the index value is positive when the ENSO–Atlantic coupling is strong, due to the original negative correlation coefficients ()). The ENSO–Indian Ocean coupling index used the correlation coefficient between JJA Niño3.4 index and JJA DMI. During the period with a stronger ENSO–Atlantic coupling index, the IIV and MEBR of the WNPSM were stronger (,d)). Similarly, during the period with a stronger ENSO–Indian Ocean coupling index, the IIV and MEBR of the ISM were stronger (,h)). The out-of-phase tendency between the ENSO–Atlantic coupling index and ENSO–Indian Ocean coupling index could contribute to the observed seesaw pattern of the ISM and WNPSM in terms of their IIV and MEBR multidecadal variability as shown in .
4. Conclusions and discussion
In this study, the IIV of the monsoon and MEBR were examined and compared quantitatively for both the ISM and WNPSM.
Out-of-phase covariability was observed between the ISM and WNPSM. When the IIV and MEBR of the ISM were strong (weak) before (after) the mid-1980s, the IIV and MEBR of the WNPSM tended to be weak (strong). During the period with a stronger ENSO–Atlantic (ENSO–Indian Ocean) coupling, the IIV and MEBR of the WNPSM (ISM) were observed to be stronger. The increasing influences from the tropical Atlantic SST may contribute to the ENSO type shift from EP to CP ENSO, thus giving rise to the weakening (strengthening) in the ENSO–Indian Ocean (ENSO–Atlantic) coupling during recent decades. The increasing influences from the tropical Atlantic Ocean may trigger the observed seesaw pattern of the ISM and WNPSM in terms of their IIV and MEBR multidecadal variability.
In-phase covariability of the IIV of the monsoon and MEBR were identified. When the MEBR was strong (weak), the IIV of the monsoon was observed to be large (small). This rule applied to both the ISM and WNPSM. The IIV of the two monsoons and their biennial relationship with ENSO could be simultaneously modulated by the enhanced influences from tropical Atlantic SST anomalies and stronger ENSO–Atlantic coupling; therefore, we could observe significant in-phase covariability of the IIV and MEBR for the two monsoons as shown in and .
It is noted that the warming trend of tropical Atlantic SST ()) was not completely consistent with the trend of the MEBR ()). It is possible that there may be a threshold for the tropical Atlantic SST, i.e., once the tropical Atlantic SST exceeds the threshold, it plays a role but does not add weight to modulating the MEBR. In addition to the influences of the tropical SST anomalies, there are other factors that modulate the monsoon variations, such as Eurasian land conditions (e.g., Kumar, Rajagopalan, and Cane Citation1999; Hu et al. Citation2000), Tibetan Plateau snow cover (e.g., Zhao and Moore Citation2004; Xiao and Duan Citation2016), mid–high latitude processes (e.g., Li et al. Citation2019; Chen et al. Citation2019), and hemispherical asymmetric global warming (e.g., Wang et al. Citation2013). These other influencing factors may also contribute to some inconsistency between the observed tropical Atlantic SST warming trend and the trend of monsoon characteristics.
Srivastava, Chakraborty, and Nanjundiah (Citation2019) also revealed a multidecadal seesaw pattern of ENSO’s influence on the Indian and African summer monsoons, due to the increased impact from the Atlantic Ocean. They argued that the observed decadal variations of ENSO–monsoon correlations are physical rooted and possibly not induced by pure noise in two random time series as suggested in other studies (e.g., Gershunov, Schneider, and Barnett Citation2001; Yun and Timmermann Citation2018). Our results here have further revealed the out-of-phase relationship between the ISM and WNPSM, in terms of both their IIV and MEBR. Our results support the viewpoint of Srivastava, Chakraborty, and Nanjundiah (Citation2019) that observed decadal variations of ENSO–monsoon correlations among different monsoon subcomponents may be physically linked and possibly not purely due to random noise. Lee, Ha, and Jhun (Citation2014) also suggested that there are significant interrelationships among global monsoon subcomponents, supporting the close physical linkage between different monsoon subsystems globally. It is desirable to further investigate the possible associations in variations between global monsoon subcomponents in future work.
Our results here suggest that the increasing influences from the tropical Atlantic SST may trigger the observed seesaw pattern of the ISM and WNPSM. The results imply that tropical Atlantic SST anomalies may need to be given more attention when predicting future monsoon variability of the ISM and WNPSM. It is necessary to carry out further research on the inter-basin interactions (e.g., Cai et al. Citation2019; Wang Citation2019), which may be the key to understanding the recent climate variability.
It should be noted that the results reported here were mainly based on statistical analysis, which therefore need to be further confirmed by more observational and numerical modeling experiments in the future. It would also be desirable to examine if the observed seesaw pattern of the ISM and WNPSM in this study can be captured by climate models, which need further development and improvement.
Acknowledgments
We thank the anonymous reviewers for their comments and suggestions, which helped to greatly improve the manuscript.
Disclosure statement
No potential conflict of interest was reported by the authors.
Additional information
Funding
References
- Cai, W., L. Wu, M. Lengaigne, T. Li, S. McGregor, J. S. Kug, J. Y. Yu, et al. 2019. “Pantropical Climate Interactions.” Science 363 (6430): eaav4236. doi:10.1126/science.aav4236.
- Chen, W., L. Wang, J. Feng, Z. P. Wen, T. J. Ma, X. Q. Yang, and C. H. Wang. 2019. “Recent Progress in Studies of the Variabilities and Mechanisms of the East Asian Monsoon in a Changing Climate.” Advances in Atmospheric Sciences 36 (9): 887–901. doi:10.1007/s00376-019-8230-y.
- Chung, C., and S. Nigam. 1999. “Asian Summer monsoon–ENSO Feedback on the Cane–Zebiak Model ENSO.” Journal of Climate 12 (9): 2787–2807. doi:10.1175/1520-0442(1999)012<2787:ASMEFO>2.0.CO;2.
- Gershunov, A., N. Schneider, and T. Barnett. 2001. “Low-frequency Modulation of the ENSO–Indian Monsoon Rainfall Relationship: Signal or Noise?” Journal of Climate 14 (11): 2486–2492. doi:10.1175/1520-0442(2001)014<2486:LFMOTE>2.0.CO;2.
- Gu, D. J., T. Li, Z. Li, and B. Zheng. 2010. “On the Phase Relations between the Western North Pacific, Indian, and Australian Monsoons.” Journal of Climate 23: 5572–5589. doi:10.1175/2010JCLI2761.1.
- Ham, Y. G., J. S. Kug, J. Y. Park, and F. F. Jin. 2013. “Sea Surface Temperature in the North Tropical Atlantic as a Trigger for El Niño/Southern Oscillation Events.” Nature Geosciences 6 (2): 112–116. doi:10.1038/ngeo1686.
- Hong, C. C., T. C. Chang, and H. H. Hsu. 2014. “Enhanced Relationship between the Tropical Atlantic SST and the Summertime Western North Pacific Subtropical High after the Early 1980s.” Journal of Geophysical Research: Atmospheres 119 (7): 3715–3722. doi:10.1002/2013JD021394.
- Hu, Z. Z., A. Kumar, H. L. Ren, H. Wang, M. L’Heureux, and F. F. Jin. 2013. “Weakened Interannual Variability in the Tropical Pacific Ocean since 2000.” Journal of Climate 26 (8): 2601–2613. doi:10.1175/JCLI-D-12-00265.1.
- Hu, Z. Z., M. Latif, E. Roeckner, and L. Bengtsson. 2000. “Intensified Asian Summer Monsoon and Its Variability in a Coupled Model Forced by Increasing Greenhouse Gas Concentrations.” Geophysical Research Letters 27 (17): 2681–2684. doi:10.1029/2000GL011550.
- Jin, D., and L. Huo. 2018. “Influence of Tropical Atlantic Sea Surface Temperature Anomalies on the East Asian Summer Monsoon.” Quarterly Journal of the Royal Meteorological Society 144 (714): 1490–1500. doi:10.1002/qj.3296.
- Kalnay, E., M. Kanamitsu, R. Kistler, W. Collins, D. Deaven, L. Gandin, M. Iredell, et al. 1996. “The NCEP/NCAR 40-Year Reanalysis Project.” Bulletin of the American Meteorological Society 77 (3): 437–471. doi:10.1175/1520-0477(1996)077<0437:TNYRP>2.0.CO;2.
- Kim, K. M., and K. M. Lau. 2001. “Dynamics of Monsoon-induced Biennial Variability in ENSO.” Geophysical Research Letters 28 (2): 315–318. doi:10.1029/2000GL012465.
- Kirtman, B. P., and J. Shukla. 2000. “Influence of the Indian Summer Monsoon on ENSO.” Quarterly Journal of the Royal Meteorological Society 126 (562): 213–239. doi:10.1002/qj.49712656211.
- Krishnamurthy, V., and B. N. Goswami. 2000. “Indian monsoon–ENSO Relationship on Interdecadal Timescale.” Journal of Climate 13 (3): 579–595. doi:10.1175/1520-0442(2000)013<0579:IMEROI>2.0.CO;2.
- Kucharski, F., A. Bracco, J. H. Yoo, and F. Molteni. 2007. “Low-frequency Variability of the Indian monsoon–ENSO Relationship and the Tropical Atlantic: The “Weakening” of the 1980s and 1990s.” Journal of Climate 20 (16): 4255–4266. doi:10.1175/JCLI4254.1.
- Kucharski, F., A. Bracco, J. H. Yoo, and F. Molteni. 2008. “Atlantic Forced Component of the Indian Monsoon Interannual Variability.” Geophysical Research Letters 35 (4): L04706. doi:10.1029/2007GL033037.
- Kucharski, F., A. Bracco, J. H. Yoo, A. M. Tompkins, L. Feudale, P. Ruti, and A. Dell’Aquila. 2009. “A Gill-Matsuno-type Mechanism Explains the Tropical Atlantic Influence on African and Indian Monsoon Rainfall.” Quarterly Journal of the Royal Meteorological Society 135 (640): 569–579. doi:10.1002/qj.406.
- Kumar, K. K., B. Rajagopalan, and M. A. Cane. 1999. “On the Weakening Relationship between the Indian Monsoon and ENSO.” Science 284 (5423): 2156–2159. doi:10.1126/science.284.5423.2156.
- Lee, E. J., K. J. Ha, and J. G. Jhun. 2014. “Interdecadal Changes in Interannual Variability of the Global Monsoon Precipitation and Interrelationships among Its Subcomponents.” Climate Dynamics 42 (9–10): 2585–2601. doi:10.1007/s00382-013-1762-4.
- Li, J. P., F. Zheng, C. Sun, J. Feng, and J. Wang. 2019. “Pathways of Influence of the Northern Hemisphere Mid–high Latitudes on East Asian Climate: A Review..” Advances in Atmospheric Sciences 36 (9): 902–921. doi:10.1007/s00376-019-8236-5.
- Li, T., and B. Wang. 2005. “A Review on the Western North Pacific Monsoon: Synoptic-to-interannual Variabilities.” Terrestrial, Atmospheric and Oceanic Sciences 16 (2): 285–314. doi:10.3319/TAO.2005.16.2.285(A).
- Loschnigg, J., G. A. Meehl, P. J. Webster, J. M. Arblaster, and G. P. Compo. 2003. “The Asian Monsoon, the Tropospheric Biennial Oscillation, and the Indian Ocean Zonal Mode in the NCAR CSM.” Journal of Climate 16 (11): 1617–1642. doi:10.1175/1520-0442(2003)016<1617:TAMTTB>2.0.CO;2.
- Rasmusson, E. M., and T. H. Carpenter. 1983. “The Relationship between Eastern Equatorial Pacific Sea Surface Temperatures and Rainfall over India and Sri Lanka.” Monthly Weather Review 111 (3): 517–528. doi:10.1175/1520-0493(1983)111<0517:TRBEEP>2.0.CO;2.
- Rong, X. Y., R. H. Zhang, and T. Li. 2010. “Impacts of Atlantic Sea Surface Temperature Anomalies on Indo-East Asian Summer monsoon-ENSO Relationship.” Chinese Science Bulletin 55 (22): 2458–2468. doi:10.1007/s11434-010-3098-3.
- Saji, N. H., B. N. Goswami, P. N. Vinayachandran, and T. Yamagata. 1999. “A Dipole Mode in the Tropical Indian Ocean.” Nature 401 (6751): 360–363. doi:10.1038/43854.
- Smith, T. M., R. W. Reynolds, T. C. Peterson, and J. Lawrimore. 2008. “Improvements to NOAA’ S Historical Merged Land - Ocean Surface Temperature Analysis (1880-2006).” Journal of Climate 21: 2283–2296. doi:10.1175/2007JCLI2100.1.
- Srivastava, G., A. Chakraborty, and R. S. Nanjundiah. 2019. “Multidecadal See-saw of the Impact of ENSO on Indian and West African Summer Monsoon Rainfall.” Climate Dynamics 52 (11): 6633–6649. doi:10.1007/s00382-018-4535-2.
- Torrence, C., and P. J. Webster. 1999. “Interdecadal Changes in the ENSO–monsoon System.” Journal of Climate 12 (8): 2679–2690. doi:10.1175/1520-0442(1999)012<2679:ICITEM>2.0.CO;2.
- Wang, B., and Z. Fan. 1999. “Choice of South Asian Summer Monsoon Indices.” Bulletin of the American Meteorological Society 80: 629–638. doi:10.1175/1520-0477(1999)080<0629:COSASM>2.0.CO;2.
- Wang, B., J. Liu, H. J. Kim, P. J. Webster, S. Y. Yim, and B. Q. Xiang. 2013. “Northern Hemisphere Summer Monsoon Intensified by mega-El Niño/southern Oscillation and Atlantic Multidecadal Oscillation.” Proceedings of the National Academy of Sciences 110 (14): 5347–5352. doi:10.1073/pnas.1219405110.
- Wang, B., R. Wu, and K. M. Lau. 2001. “Interannual Variability of Asian Summer Monsoon: Contrast between the Indian and Western North Pacific-East Asian Monsoons.” Journal of Climate 14: 4073–4090. doi:10.1175/1520-0442(2001)014<4073:IVOTAS>2.0.CO;2.
- Wang, B., J. Yang, T. Zhou, and B. Wang. 2008. “Interdecadal Changes in the Major Modes of Asian–Australian Monsoon Variability: Strengthening Relationship with ENSO since the Late 1970s.” Journal of Climate 21 (8): 1771–1789. doi:10.1175/2007JCLI1981.1.
- Wang, C. 2019. “Three-ocean Interactions and Climate Variability: A Review and Perspective.” Climate Dynamics 53 (7–8): 5119–5136. doi:10.1007/s00382-019-04930-x.
- Wang, C., F. Kucharski, R. Barimalala, and A. Bracco. 2009. “Teleconnections of the Tropical Atlantic to the Tropical Indian and Pacific Oceans: A Review of Recent Findings.” Meteorologische Zeitschrift 18 (4): 445–454. doi:10.1127/0941-2948/2009/0394.
- Wang, L., and J. Y. Yu. 2018. “A Recent Shift in the Monsoon Centers Associated with the Tropospheric Biennial Oscillation.” Journal of Climate 31: 325–340. doi:10.1175/JCLI-D-17-0349.1.
- Wang, L., J. Y. Yu, and H. Paek. 2017. “Enhanced Biennial Variability in the Pacific Due to Atlantic Capacitor Effect.” Nature Communications 8 (1): 1–7. doi:10.1038/ncomms14887.
- Wu, M., and L. Wang. 2019. “Enhanced Correlation between ENSO and Western North Pacific Monsoon during Boreal Summer around the 1990s.” Atmospheric and Oceanic Science Letters 12 (5): 376–384. doi:10.1080/16742834.2019.1641397.
- Wu, R., and B. P. Kirtman. 2003. “On the Impacts of the Indian Summer Monsoon on ENSO in a Coupled GCM.” Quarterly Journal of the Royal Meteorological Society 129 (595): 3439–3468. doi:10.1256/qj.02.214.
- Wu, R., and B. P. Kirtman. 2004. “The Tropospheric Biennial Oscillation of the monsoon–ENSO System in an Interactive Ensemble Coupled GCM.” Journal of Climate 17 (8): 1623–1640. doi:10.1175/1520-0442(2004)017<1623:TTBOOT>2.0.CO;2.
- Xiao, Z., and A. Duan. 2016. “Impacts of Tibetan Plateau Snow Cover on the Interannual Variability of the East Asian Summer Monsoon.” Journal of Climate 29 (23): 8495–8514. doi:10.1175/jcli-d-16-0029.1.
- Yasunari, T. 1990. “Impact of Indian Monsoon on the Coupled Atmosphere/ocean System in the Tropical Pacific.” Meteorology and Atmospheric Physics 44 (1–4): 29–41. doi:10.1007/BF01026809.
- Yu, J. Y., P. K. Kao, H. Paek, H. H. Hsu, C. W. Hung, M. M. Lu, and S. I. An. 2015. “Linking Emergence of the central-Pacific El Niño to the Atlantic Multi-decadal Oscillation.” Journal of Climate 28: 651–662. doi:10.1175/JCLI-D-14-00347.1.
- Yuan, Y., S. Yang, and Z. Zhang. 2012. “Different Evolutions of the Philippine Sea Anticyclone between the Eastern and Central Pacific El Niño: Possible Effects of Indian Ocean SST.” Journal of Climate 25 (22): 7867–7883. doi:10.1175/JCLI-D-12-00004.1.
- Yun, K. S., and A. Timmermann. 2018. “Decadal monsoon-ENSO Relationships Reexamined.” Geophysical Research Letters 45 (4): 2014–2021. doi:10.1002/2017GL076912.
- Zhao, H., and G. W. K. Moore. 2004. “On the Relationship between Tibetan Snow Cover, the Tibetan Plateau Monsoon and the Indian Summer Monsoon.” Geophysical Research Letters 31 (14): L14204. doi:10.1029/2004gl020040.