
ABSTRACT
Perceived travel time plays an important role in the subjective wellbeing of the commuters. Recent studies have focused on the relationship between spatial characteristics and wellbeing, and the relationship between transportation and mobility with subjective wellbeing of the people. However, few studies tackled the influence of the urban form and the elements of built environment on wellbeing during commuting in the city. This manuscript discusses the concept of urban form, and perceptual qualities of urban design. Afterwards, it proceeds with delineating the research variables (i.e., Spatial and Perceptual). The case study selected is South 90 Street, New Cairo, Egypt, which serves as an urban corridor that accommodates various transit modes, diverse land uses, and variety of urban facades. The analysis is carried out utilizing the built environment dataset and collected responses about users’ experience via a questionnaire. This manuscript attempts to answer two main questions: (1) What is the influence of urban form on commuters’ travel time perception? (2) How do the elements of the built environment impact the subjective wellbeing of commuters? Descriptive analysis is conducted to understand the relationship and influence of the built environment on the perceived travel time during mobility and individuals’ wellbeing. The manuscript further discusses the results, depicting which built environment elements are associated with either positive or negative effect on commuters’ subjective wellbeing. The manuscript concludes with highlighting the potentials for maintaining the overall wellbeing of individuals and their perception during urban mobility. Thus, facilitating the design of functional, efficient, and reliable cities.
Introduction
Subjective wellbeing of the commuters and their perception of travel time during commuting and mobility in urban corridors are shaped by the urban setting, form, and configuration [Citation1]. Urban form, a concept that exists for as long as there have been human settlements. Urban form changes in response to social, environmental, economic, and technological advancements, all of which are mediated by urban policy. Thus, the physical component of the city beholds the concept Morphology within [Citation2,Citation3]. It is a significant component of urban design in its applied forms, but it is also a concern for development, urban planning, and urbanization. According to [Citation2], urban morphological dimension discusses two different questions. The first question is of a descriptive nature, which explores the ‘How’ and ‘Why’ behind the establishments of urban forms. In addition to exploring, delineating, and understanding the influence of urban form on individuals’ lives and wellbeing. While on the other hand the other question, that is tackled by Urban Morphology, is of normative nature. Which aims to understand how we should build cities. This manuscript adopts the normative approach. In which this manuscript attempts to tackle the question of how to build cities in order to improve the residents’ daily experience in their cities, and their overall wellbeing.
Travel time is a key factor that affects people’s decisions and activities. The perception of travel time is affected by several factors, most notably the morphology of the city. People’s perception of travel time can be influenced by the city’s morphology, urban form and built environment characteristics. In this manuscript, South 90th Street in New Cairo is the case study selected to study the effect of urban form on travel time perception. This street runs through an area of the city that has a mix of residential and commercial buildings. Travel time perception is an important factor in understanding urban form, as it shapes the experience of the residents of a city. In his work, Kevin Lynch emphasized the importance of studying travel time for understanding the urban form [Citation4]. Similarly, Jane Jacobs argued that street networks should be designed keeping in mind the experience of the pedestrian [Citation5]. These arguments bring to light how crucial it is to study travel time perception for understanding urban form and morphology.
The purpose of the study of how urban built environment and urban form influence perceived travel time is of great significance in today’s modern world. It is essential to understand how different characteristics of the urban built environment, such as density, mix of land uses, or street connectivity, affect people’s perception of the amount of time they need to reach a destination. Additionally, by taking into consideration how people perceive their travel times, cities can be designed in a way that encourages more sustainable modes of transportation like walking and cycling. Thus, enhancing the residents’ overall wellbeing and quality of life. This manuscript attempts to tackle the following questions: what is the influence of urban form (land use mix) on commuters’ travel time perception? how the perceived Subjective feeling of the built environment elements relates to the perception of Time? what is the influence of transport modality on Perception of Built Environment Elements?
Literature review
The importance of understanding travel time perception in urban studies has been highlighted by theorists such as Donald Appleyard and Erwin, Benedikt. Appleyard argued that the residents experience of their environment is a key factor in understanding cities [Citation6]. He proposed that the spatial organization of a city, its morphology, could be used to determine the psychological impact on its citizens (Ibid). Similarly, Benedikt argued that the way a city is organized affects the time people need to travel from one place to another [Citation7]. The understanding of travel time perception can help us explain how residents perceive different parts of their cities.
Le Febvre suggested that it is necessary to grasp the effect of ‘time-space’ on people’s daily life to understand their overall experience and interaction with the built environment [Citation8,Citation9]. This further underlines the significance of travel time perception for gaining insights into urban form. Thus, it is essential to understand how travel time perception affects the way people interact with their respective environments, both culturally and spatially. It is only then that cities can be designed in a way that facilitates better movement and enhances the overall living experience.
On the other hand, Le Febvre’s Rhythm analysis focus on the physical features and repetitive patterns of urban landscapes [Citation9]. He argued that cities are a manifestation of our desire to create order out of chaos, essentially a way of trying to make sense of the world. He saw rhythms as an integral part of this process, as recurring patterns and structures can be found throughout urban areas. Le Febvre’s Rhythmanalysis is particularly applicable to today’s cities, where repetition has become even more dominant due to the overwhelming presence of technology and globalization. It is becoming increasingly difficult to find locations with unique characteristics and individual identities. Hence, leading to a decreased sense of involvement, excitement, and liveable city experience. Which in turn influence the perceived travel time, due to the monotonic repetition of physical features. Thus, understanding how the built environment influence travel time perception could help identify areas where the citizens are more likely to feel excited, attentive, and involved. In addition to identifying areas where citizens are more likely to feel bored, disconnected, or isolated from the surrounding urban built environment. Understanding the psychological impact of built environment characteristics on travel time perception can be used to inform urban planners when designing new spaces and improving existing ones.
Le Febvre’s Rhythm analysis provides an insightful perspective on the influence of time on our perception and behavior. According to his research, time is shaped by the patterns of repetition of events or objects in our lives, which is particularly evident in urban form. This has a profound impact on how city residents experience time – it can be seen as either a cycle of routines, or as something more chaotic and unpredictable. His take on this subject is especially relevant in the modern urban context, where existing infrastructures and systems must adapt to new technologies and trends. It is important to consider the implications that these changes have on the rhythm and tempo of everyday life in cities. How do they affect the citizens’ sense of time? Answering this question requires an understanding of Le Febvre’s Rhythmanalysis, which provides a comprehensive view on the relationship between time, urban form, and residents experience.
Recent research on urban form has revealed that the urban form of urban corridors can have a significant impact on the user experience during mobility [Citation10]. To better understand this effect, a literature review was conducted to investigate the influence of urban form on the perceived travel time during mobility in these corridors. The literature review aimed to analyze the effects of various urban form characteristics, such as street network, land use patterns, and built environment elements, on travel time perception [Citation1,Citation11,Citation12]. It was found that the user’s perceived travel time is influenced by both physical and psychological factors such as route familiarity, number of obstacles, level of comfort and safety experienced while traveling through an area, speed limits and local character of the environment [Citation1,Citation13]. The findings of this literature review suggest that urban form has both positive and negative impacts on the perceived travel time during mobility in urban corridors. Therefore, it is important for urban planners and policy makers to consider these effects while designing and planning urban spaces in order to create more desirable and efficient user experiences.
The influence of urban form on travel time perception has been studied. It is generally accepted that physical features of the city, such as street layout, traffic signals, land uses, and street networks can all affect how people perceive travel times. Studies have found that more structured urban forms lead to shorter perceived travel times than those of less structured forms. This suggests that by carefully designing urban forms, cities can reduce perceived travel times and improve the overall quality of life for its citizens. Overall, there is a wealth of research that has investigated the effect of urban form on travel time perception. For example, a study by [Citation14] found that travel time perception is influenced by the quality of the urban environment, such as the presence of green space, walkability, and public transport.
Cervero and Kockelman [Citation15] proposed the 3D’s of urban form to analyze cities and promote sustainable urban development (See . These three dimensions are density, diversity, and design. Through their lens, density measures the concentration of people and activities in an area; diversity is the number of options available to citizens including housing types and public amenities such as parks; and design pertains to how infrastructure and buildings fit together in an esthetically appealing way. The integration of these three components is essential for creating vibrant, liveable cities that can deliver high-quality services [Citation16]. Urban form is a critical component in understanding how cities grow and develop. A city’s urban form determines how efficiently it functions in terms of economic productivity, social services, energy consumption, and environmental quality. Densely populated cities with rich diversity and good design have the potential to have a more positive impact on its inhabitants. Thus, the 3D’s proposed by Cervero and Kockelman [Citation15] provide a useful framework for analyzing how cities are formed and identifying how they can be improved. For instance, if a city has high density but lacks diversity and good design, the quality of life would be compromised.
Figure 1. Built environment characteristics according to Cervero & Kockleman (amended by Authors).
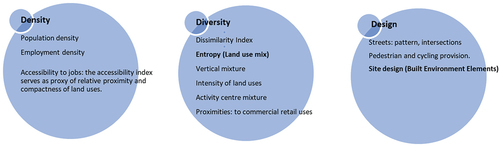
Of all the three dimensions proposed by Cervero and kockelman [Citation15], diversity could be linked to Le Febvre Rhythm analysis, since diversity is observed in terms of land use intensity, which is linked to the relationship between residential, commercial, industrial, and recreational activities. This diversity of land use intensity can help define the characteristics of a city’s physical structure, such as its streets and other public spaces. The presence of different types of land uses at different intensities implies that residents and visitors have more opportunities to find the activity they are looking for, thus creating a more vibrant urban environment. Furthermore, this variety and intensity of land uses is reflected on the physical features of the city, and specifically on the block frontages of each street or urban corridor.
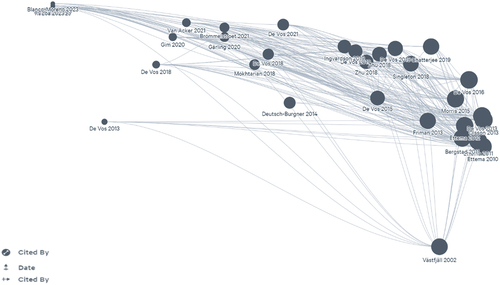
In recent years, there has been a growing interest in the study of Subjective Well-Being (SWB) in travel behavior and travel perception in urban mobility (See ). This is due to a growing awareness of the importance of city dwellers’ quality of life and the need to understand how many factors affect this quality [Citation17,Citation18]. SWB have enabled researchers to quantify trip happiness, which is a key component of urban mobility. SWB has also been utilized to gain a better understanding of how people adjust their travel behavior based on available resources and their requirements [Citation19–21]. Furthermore, it sheds light on how people perceive their surroundings while traveling and how this influences their subjective well-being.
Figure 2. Growing body of literature review on studies conducted on subjective wellbeing and transport and mobility (source: author using Litmap.com on May 2023).
Aim, methodology, sampling, and methods
The aim of this paper is to analyze the impact of urban form on travel time perception on 90th Street in New Cairo. To achieve this goal, a qualitative and quantitative approach was employed, which includes spatial auditing and analysis, and Questionnaire. The spatial auditing encompasses understanding urban parameters. The spatial analysis is conducted with QGIS. The questionnaire responses comprise questions to understand perception were analyzed using a qualitative data analysis method. The questionnaire responses and spatial analysis indices are further statistically analyzed in a descriptive manner. The analysis further proceeds with analyzing the perception of the selected built environment elements in relation to perceived travel time. In which the perception of time is distinguished into two groups: overperceived travel time, and underperceived travel time.
The methodology of this manuscript is composed of 5 main phases (See ). First, a literature review is conducted to discuss the urban form and its influence on travel time perception according to previous research. In addition to highlighting the previous research on the relationship and influence of street design, built environment elements on travel time perception. Moreover, the literature review discusses subjective wellbeing with respect to urban studies. Secondly, this manuscript proceeds with the case study Design in which the case study area is defined and explained. Then, the data collection method is elaborated in which it is carries out by conducting field survey and auditing, in addition to deploying a questionnaire. Furthermore, the built environment elements considered for this study are further elaborated. Thirdly, the data and variables are further discussed by elaborating the type of data and the preliminary analysis carried out on the study data (i.e., Entropy index for land use mix, and survey responses).
Figure 3. Methodology diagram (source: Authors).
Fourthly, the analysis is carried on responses of the questionnaire in a descriptive manner. Fifthly, the discussion proceeds with highlighting the main findings of this manuscript. In addition to drawing links to similar studies. By employing this methodology including on-site observations, spatial data analysis, and land use mapping, this research aims to explore the underlying factors shaping the perception of travel time during commuting along Southern 90 Street. In addition to depicting the influence of built environment elements on travelers’ subjective wellbeing. The outcomes of this investigation are expected to contribute valuable insights to urban planning and design practices, fostering further complex research, informed decision-making for sustainable development, and optimized land use strategies within the context of New Cairo’s evolving urban fabric.
It is important to note that this study was undertaken between year 2020 and 2023 in which the southern 90 street was witnessing the establishment of the monorail along its axis. The survey was conducted in May 2023 at which the monorail’s main structure was already established.
Description of the study area (90 street, New Cairo)
The establishment of New Cairo city followed a presidential decree 191 for year 2000. The city is one of the third-generation new cities that have been established in Egypt. The southern 90 street was the first main corridor established in New Cairo. The width of the southern 90 street is 90 meters wide. In Early 2000’s, it encompassed mainly residential uses on its southern interface. While its northern interface encompassed administrative and commercial uses, which was still under development at that time (See ). The southern 90 Street in New Cairo, Egypt is a prime case study of an urban corridor, which has seen rapid growth in recent years. This street is one of the main corridors for transportation and mobility in New Cairo City, connecting the city with Cairo downtown and New Administrative City. The street itself accommodates a variety of land uses. It is also a destination point for residents and visitors alike since it accommodates several commercial and administrative hubs.
Figure 4. Southern 90 street before the establishment of monorail route (source: webpage https://www.uvisne.com/view-blog/ninety-street-fifth-avenue/).
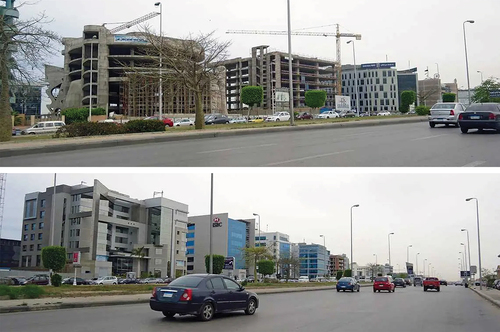
Furthermore, it accommodates a monorail route, which is still under construction, and expected to be operated mid-2023. The street accommodates various modes of transportation including cars, buses, motorbikes, taxis & microbuses. Moreover, several monorail hubs are currently being established along the corridor to promote sustainable mobility through providing a multimodal option (i.e., monorail). In conclusion, southern 90 Street in New Cairo is an example of how urban planning can be used to create a vibrant and liveable cityscape, since the street itself is multifaceted with two interfaces: administrative interface to the north of the street, and residential interface to the south of it.
The rationale for Selecting ‘South 90 Street, New Cairo’ as the study area could be provided as it meets the following points. Some of the points that supports the selection rationale is listed in this section briefly and are further discussed in the following sections. For instance, its relevance to urban form, urban mobility, and travel time studies; it has variation of urban form and land uses; accessibility and connectivity; its representative of urban development trends; its practical implications. The Southern 90 Street is one of New Cairo’s main arterial roads, and it has witnessed considerable urban changes over the recent years. Since it has unusual urban structure and transportation characteristics (i.e., Monorail), it resembles a suitable case study. It is well-known for its well-planned design, which includes wide lanes and the integration of various land uses. These characteristics imposes the question of how far they have direct influence on travel behavior and have the capacity to influence trip time perception and subjective well-being.
Additionally, southern 90 street accommodates a diversity of urban forms along its axis, a diversity of land uses that ranges from residential, commercial, and administrative land uses (See ). This variation provides an opportunity to compare, contrast, or even associate the experiences of individuals residing or working in different parts of the street. Additionally, the selected case study serves as a main transportation corridor in New Cairo, which connects New Cairo’s neighborhoods to each other. Also, it connects the different neighborhoods of new Cairo to Cairo’s eastern neighborhoods and districts through the ring road, Cairo’s Eastern part with New Cairo and the New administrative City in the Eastern part of Cairo through the monorail (See ). Thus, it’s distinguished status of accessibility and connectivity make it a travel route of high importance for residents, commuters, and visitors. Moreover, it encompasses a variety of modes of transportation ranging from vehicles, public transit, and Monorail (expected to operate in the near future). In summary, the selection of South 90 Street, New Cairo, as the case study area is justified by its rapid urban growth, diversity of land uses, status as a major transportation corridor, well-planned urban design, and the potential local relevance and impact of the study. By investigating travel time perception and subjective wellbeing in this context, the research can contribute valuable insights to urban planning, transportation management, and the overall livability of New Cairo.
Figure 5. New Cairo land use map (source: amended in 2023 from [Citation22]).
![Figure 5. New Cairo land use map (source: amended in 2023 from [Citation22]).](/cms/asset/be6381e0-5d36-46eb-a05e-4c1344ea24ad/thbr_a_2290903_f0005_oc.jpg)
Figure 6. Greater Cairo map and the connectivity between New cairo, Cairo’s Eastern part, and western part (source: amended from [Citation22]).
![Figure 6. Greater Cairo map and the connectivity between New cairo, Cairo’s Eastern part, and western part (source: amended from [Citation22]).](/cms/asset/86ecb175-0669-4890-8861-ec4d8618cbe9/thbr_a_2290903_f0006_oc.jpg)
Data collection methods
This study consists of two main collection methods in order to be able to collect data related to spatial aspect, in addition to data related to travel behavior and perceptions. First: a Questionnaire was formulated to collect data on socio-demographics of the sample size, travel modes, perception of time, and effect of surrounding built environment on perceived feeling. Second: field survey and auditing to collect data related to land use. The two categories of data collection methods are further analyzed spatially and qualitatively. The Spatial analysis was carried out using QGIS, and descriptive analysis was carried out using Data tab and SPSS. The Data analysis is further discussed and elaborated in the next sections. A full overview of the questionnaire formulation and field survey is discussed in the following sub sections.
Questionnaire
In this study, a questionnaire was formulated to investigate the interplay between sociodemographic factors, mobility patterns, modality of transportation means, and the perception of time in relation to the surrounding built environment’s impact on perceived feelings. The questionnaire encompassed several sections, each focusing on specific independent and dependent variables (See ). The sociodemographic information, considered as the independent variable, covered a range of essential factors. Age was categorized into distinct ‘Age Groups’ to allow for an effective analysis of age-related trends. Gender, a binary variable, was included to capture potential gender-based differences. Education and employment were treated as categorical variables to ascertain the influence of education and occupational status on the study’s outcomes. Household size, a continuous variable, was incorporated to understand potential correlations between living arrangements and the dependent variable. Additionally, the presence or absence of a driving license, a binary variable, was taken into account as it may impact mobility patterns.
Figure 7. Study questionnaire sections and variables (source: authors).
The mobility patterns and transportation section, also serving as an independent variable, was designed to explore participants’ commuting behaviors. The direction of daily travel was categorized to examine potential directional trends. Furthermore, participants were asked to identify the street sectors covered during their commute to understand how these choices may relate to the dependent variable. And to further facilitate the actual travel time of each subject response. Regarding the modality of transportation means, two distinct categories were considered as independent variables: ‘One Modal’ (Transportation Means Type) and ‘Multi-Modal’ (Transportation Means Type). This allowed for an assessment of whether participants’ reliance on a single mode of transportation or multiple modes might influence their perceptions of time and the built environment. The dependent variable, ‘Perception of Time’, was measured on a continuous scale according to the sectors covered during participants’ daily activities. This approach aimed to capture nuanced variations in perceived time based on specific locations or travel routes. Additionally, the study explored the effect of the surrounding built environment on participants’ perceived feelings. Various elements of the built environment were evaluated using a 7-point Likert scale ranging from (−3) to (+3). The seven built environment elements selected for this study is enumerated as follows: Billboards; Speed Camera; Mall Facades; Landscape & Trees; Outdoor Cafes; Bridges; Monorail; Bridges. The criteria for the selection of these built environment elements will be further elaborated in the next sections. This allowed participants to express their subjective opinions, enabling a more comprehensive understanding of the impact of these environmental features on emotional experiences.
By formulating this questionnaire with a diverse array of variables, the study aimed to provide valuable insights into the complex relationships between sociodemographic factors, mobility patterns, modality of transportation means, the perception of time, and the effect of the surrounding built environment on perceived feelings. The data gathered through this instrument will be subjected to descriptive statistical analysis to draw conclusions and contribute to the existing body of knowledge in the field of transportation, urban design, and subjective wellbeing.
Sample size
In determining the appropriate sample size for the present study, a descriptive statistical approach was employed to ensure the reliability, exploratory, and generalizability of the findings. The target population of New Cairo City, consisting of 4 million habitants [Citation22]. However, the current population is 2.5 million habitants [Citation23] posed a significant challenge, as it required a sample size that would effectively capture the essence of this vast population. To ascertain an optimal sample size, key factors such as the confidence level, population proportion, and margin of error were considered. A confidence level of 95% was selected, signifying that the calculated interval estimates were expected to encompass the true population parameter in 95 out of 100 random samples. This confidence level strikes a balance between precision and practicality, providing a high level of certainty while avoiding excessive sample sizes that might utilize unnecessary time and resources. Given that the population proportion was assumed to be 50% (the most conservative estimate, which results in the largest required sample size), a margin of error of 7.32% was considered acceptable. The margin of error denotes the maximum amount by which the sample estimate may deviate from the true population parameter. This value was chosen to strike a balance between achieving a reasonably precise estimate and maintaining a manageable sample size.
Utilizing these parameters, a sample size of 175 was derived through sample size statistical calculations. Despite the vast size of the population, this sample size was found to provide a suitable compromise between a fair level of statistical power and practical feasibility. Such a sample size allows for an exploratory estimation of population characteristics while keeping data collection and analysis within manageable bounds. It is important to emphasize that the chosen sample size of 179 ensures that the study’s outcomes could be further deployed to contribute to other studies which could be sufficiently representative of the larger population, enabling valid interpretations to be further drawn. Moreover, this sample size offers a decent level of statistical power which contributes to explore the likelihood of detecting meaningful effects if they exist within the population.
Selection of built environment elements for the case study
This study explores how specific elements in the urban built environment impact people’s experiences and subjective wellbeing. Existing literature demonstrates a keen interest in examining the relationship between these elements, urban experiences, and subjective wellbeing. The selected elements were chosen based on a thorough literature review and have been widely utilized in previous studies. In which [Citation24] elaborates that the number of points of interest (i.e. resembled in the street setting) influence the commuters perception. While [Citation25] discusses that tree density, traffic signals and open space has an effect on the subjective perception of the commuters.
While these elements hold significance, the chosen elements were prioritized based on their prevalence, relevance to urban experiences, and the existing body of research linking them to subjective wellbeing. Furthermore, narrowing down the scope of analysis allows for a more focused and in-depth examination of the selected elements [Citation24–27].
Through this selection process, seven key elements were identified for examination: Perception of Billboards, Perception of Speed/Traffic Camira, Perception of Trees & Landscape, Perception of Malls’ Facades, Perception of Outdoor Cafes, Perception of Monorail, and Perception of Bridges (Pedestrian & Vehicles). This paragraph presents a brief justification for the selection of these elements, highlighting their relevance and significance in understanding the intricate relationship between the built environment and individuals’ wellbeing. Firstly, billboards are abundant in urban landscapes, serving as prominent visual stimuli. They have the potential to shape people’s perceptions, attention, and emotions. Secondly, Speed and traffic cameras represent key elements in urban infrastructure, primarily aimed at enhancing road safety and reducing traffic violations. However, these devices may also impact individuals’ perceptions and emotions by promoting a sense of surveillance or serving as a reminder of potential risks.
Thirdly, Green spaces, including trees and landscapes, are vital components of urban environments that contribute to individuals’ wellbeing. The presence has been linked to reduced stress levels, enhanced psychological restoration, and improved overall satisfaction. Fourthly, Malls are integral parts of urban environments, often serving as social, commercial, and recreational hubs. The facades of malls contribute to the visual aesthetics of the built environment and can significantly influence individuals’ perceptions and emotional responses. Fifthly, Outdoor cafes represent vibrant social spaces within urban settings, providing opportunities for social interaction and relaxation. By studying individuals’ perceptions of outdoor cafes, we can gain insights into the role of social infrastructure in fostering a sense of community, leisure, and overall subjective wellbeing. The sixth built environment element is the monorail which represent a distinctive feature of urban transportation systems, offering efficient and alternative means of travel. The perception of monorails includes aspects such as visual appeal, convenience, and impact on the urban landscape. Investigating individuals’ perception of monorails sheds light on the interconnection between transportation infrastructure, visual aesthetics, and overall subjective wellbeing.
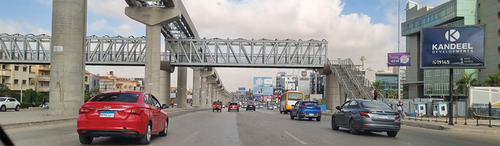
Finally, pedestrian and Vehicle bridges (See ) serve as vital connectors within urban environments, facilitating mobility and creating architectural landmarks. The perception of bridges encompasses aspects such as design, safety, and visual esthetics. Examining individuals’ perceptions of bridges provides insights into the psychological impact of architectural structures, the role of connectivity in urban experiences, and the overall influence of bridges on subjective wellbeing.
Figure 8. View of an example pedestrian bridge in southern 90 street (source: authors on 07/05/2023 at 9 AM).
Data, variables, and analysis
Spatial analysis
Spatial analysis for land use mix could be calculate using different calculation methods. The land use mix calculation could be calculated according to the following methods: Entropy Index, Dissimilarity index, Balance index, Herrfindahl-hirshman index, Atkinson Index, Exposure Index, and Gini Index. The difference between those measures is whether they are calculated based on the total area of land use, or whether they are based on the subdivisions and districts [Citation28]. This manuscript adopts the entropy index as a measure for land use mix since it takes into consideration the relative percentage of more than two land use types [Citation28,Citation29]. This means that when one land use dominates the area of study, the land use will be low with respect to entropy index.
The entropy index is the most generally used and recognized indicator for describing land-use mix. Entropy measures the uniformity of land use in a particular region or neighborhood [Citation30,Citation31]. The entropy index serves as a widely utilized and recognized indicator for quantifying the level of land-use mix within a specific region or neighborhood. This index provides valuable insights into the spatial distribution and heterogeneity of land use types, offering a measure of the diversity or uniformity of land uses present in the study area. High entropy values indicate a more diverse and mixed land-use pattern, characterized by a balanced distribution of various land-use categories. Conversely, lower entropy values suggest a more homogeneous land-use composition, wherein a dominant land use type may prevail. The entropy index is calculated based on the probabilities of encountering different land-use types within the study area. It considers the relative proportions of each land use category, giving more weight to areas where multiple land uses coexist in comparable proportions. As such, the index reflects the uncertainty or unpredictability associated with land-use encounters, with higher entropy values implying greater complexity in land-use distribution.
In the context of this research on Southern 90 Street, New Cairo, the entropy index was estimated to assess the land-use mix in both the northern and southern parts of the study area. As depicted in , the entropy value for the northern segment, corresponding to the catchment area north to South 90 Street, is calculated as 0.762. This indicates a relatively high degree of land-use diversity and a more balanced distribution of different land-use types in the northern region. In contrast, the southern part
Figure 9. Study boundary land use and land use mix (entropy index). Calculated using QGIS (source: authors).
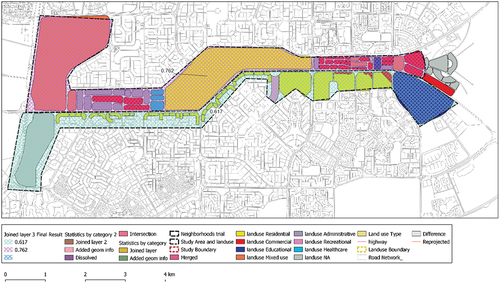
of the study area demonstrates an entropy value of 0.617 (See ), implying a moderate level of land-use mix but with some dominant land use types prevailing.
Questionnaire results
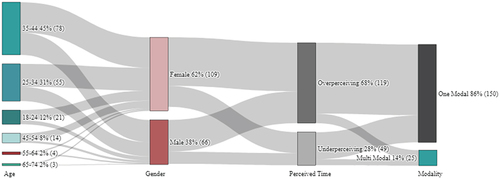
A descriptive statistical analysis of socio-demographic responses of the questionnaire is carried out to understand the nature of the collected sample. The age-group of the population sample ranges from 18 to 74 years old. The largest age group of the sample, which ranges from 35 to 44 years old, resembles roughly 45% the total sample. The second largest age group (i.e., 25–34 years old) resembles 31% of the total sample size. While the gender group is distributed between 62% Female respondents and 38% Male respondents (See .
Figure 10. Sankey diagram of descriptive statistics of the questionnaire results (source: Authors).
Descriptive statistical analysis of mobility profile of the study sample size
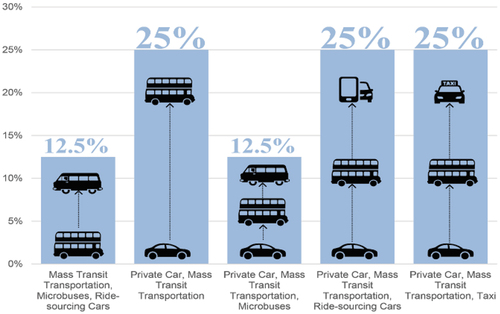
The survey results report that majority (65%) of the respondents commute through the Southern 90 Street for the daily back-and-forth trips. Most of the response’s reports that 86% of the respondents use only one mode of transportation (See ). On the other hand, the multimodality of the commute trips shows interesting results. In which the combination of using ‘private car and mass transit’ resembles 25% of the total multimodal responses. Similar to ‘private car, mass transit, and ride sourcing’, and ‘private car, mass transit, and taxi’ (See ).
Figure 11. Questionnaire results on trip modality.
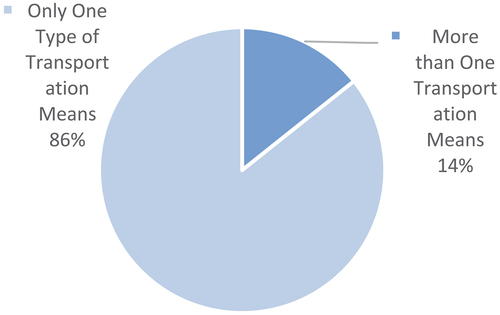
Figure 12. Questionnaire results of multimodal trip shares.
Descriptive statistical analysis of the perceived subjective feeling of the built environment elements
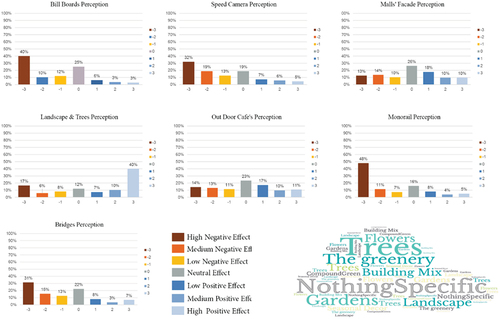
The perception recorded from respondents toward the selected 7 built environment elements depicts that the highest recorded negative effect is recorded for Monorail, Billboards, Speed Cameras, and Briges (See ). In which the percentage of the negative effect responses are 48%, 40%, 32%, and 31%, respectively. While the least of negative effect are Malls’ facades, outdoor cafes, and landscape trees perception. However, landscape and trees perception have the highest record of negative effect when compared to malls ‘facades and outdoor cafes. However, it has the highest record of positive effect (i.e., 40%). The survey of this study included a question in which the respondents were asked about other built environment elements which provide the user with pleasant feeling. The question of an open question. The following illustration shows that the common answers were Greeneries and Landscape, Building mix.
Figure 13. Results of questionnaire responses of how the selected built environment elements impact the subjective wellbeing of the respondents (source: authors).
Results and findings
Investigating the influence of urban form (land use mix) on commuters’ travel time perception
The overall results of the questionnaire show that the overperceiving subjects are more than the underperceiving subjects (72% and 28% respectively) (see )
Table 1. Descriptive analysis of perception of time and land use mix. (source: authors).
One of the interesting results shows that 91% of the underperceiving subjects are associated with the direction of lower land use mix (See ). Compared to 85% of the overperceiving subjects associated with low land use mix. On the other hand, 91% of the underperceiving subjects are associated with lower land user mix. Compared to only 9% associated with the direction of higher land use mix (See ). This to conclude that the underperceiving subjects of the study sample has more association with the direction of lower land use mix.
Investigating the relationship between the perceived subjective feeling of the built environment elements and the perception of time
In the context of the conducted study on the influence of built environment elements on the perception of time, an independent t-test analysis was employed to assess potential differences in the perception of time between individuals who reported overperceiving and underperceiving of various built environment elements. The following table presents the descriptive statistics for the groups in terms of mean, standard deviation, and standard error mean for different aspects of the built environment.
The study focused on seven different elements of the built environment: billboards, speed/traffic cameras, trees and landscape, malls’ facades, outdoor cafes, monorail, and bridges (pedestrian and vehicles). The participants were categorized into two groups: those who reported overperceiving time, and those who reported underperceiving time.
The study’s objective is to explore the potential impact of various built environment elements on individuals’ perception of time. To achieve this, the research employs independent t-test analysis to compare participants who indicated either overperceiving or underperceiving time, and the influence of the selected built environment elements on them. The table presents descriptive statistics that shed light on the nature of these differences.
Results of perception of Billboards show that participants associated with overperceiving Time (N = 119) reported overperceiving time when observing billboards had an average mean perception score of −1.36. The standard deviation is 1.676, and the standard error of the mean is 0.154. While participants associated with underperceiving Time (N = 56) reported underperceiving time when observing billboards had an average mean perception score of −1.20. The standard deviation is 1.762, and the standard error of the mean is 0. 236.In conclusion, this could be interpreted as the participants who overperceived time when observing billboards tend to have a more negative perception of time (a sense that time is passing more slowly) compared to those who underperceived time when observing billboards. Thus, billboards are highly associated with overperceived time. The relatively lower standard error suggests a relatively precise estimation of the mean values. Similarly, participants who overperceived time when observing speed/traffic cameras tended to have a more negative perception of time compared to those who underperceived time when observing these cameras (see ). While, in the case of perception of trees and landscape, participants who overperceived time when observing trees and landscape elements tend to have a more positive perception of time (a sense that time is passing more quickly) compared to those who underperceived time when observing these elements. Thus, trees and landscape are highly associated with underperceived travel time, which implies positive effect on subjective wellbeing. The interpretations for the remaining elements (Malls’ Facades, Outdoor Cafes, Monorail, and Bridges) follow a similar pattern, indicating that participants who overperceived time tended to have a more negative perception of time compared to those who underperceived time for these specific built environment elements.
Table 2. Descriptive statistical analysis using SPSS (perception of time and perception of built environment elements).
Conclusion
This study aimed to comprehensively explore and analyze the multifaceted influence of the urban form and the surrounding built environment on the commuter’s perception. By investigating into this complex relationship, researchers sought to shed light on the dynamics and factors that contribute to shaping the way commuters perceive their daily journeys. Through this exploratory study, the aim is to dismantle the complex web of influences that urban design, architecture, and infrastructure exert on the commuter’s perception, ultimately helping to guide future urban planning initiatives and strategies. By examining the relationship between the built environment and the commuter’s perception, this study aimed to contribute valuable insights into the complex and ever-evolving field of urban planning and design. It is intended to pave the road for future complex research that would tackle more variables and built environment elements.
The results obtained from the survey sample, which utilized a Likert-Scale to gather responses on how the selected built environment elements influence commuters’ perception, clearly indicate that commuters hold a predominantly negative perception toward Bridges, Monorail, and Billboards. This part of the findings concedes with the findings of a study by [Citation1], in which this study concludes that the physical settings of corridors and streets impacts the commuters’ perception of time. It is evident that further analysis and investigation are necessary to better understand the reasons behind these negative perceptions and explore potential strategies for improvement.
Further findings from the survey sample demonstrate the influential role that landscape, and outdoor recreational functions have on commuters’ perception and overall wellbeing. The findings reveal that commuters generally hold a positive perception of these aspects, highlighting the significant impact they have on their daily lives. This is in support for the claim that the presence of outdoor spaces and natural surroundings greatly contribute to enhancing commuters’ overall sense of wellbeing and satisfaction by [Citation26] in their study on the impact of built environment on running experience. The survey results underline the importance of incorporating green spaces and recreational areas into urban planning, as they not only provide esthetic value but also contribute to improving individuals’ mental and physical health. These findings establish a strong foundation for future research and policymaking in urban design and planning, emphasizing the need to prioritize the integration of landscape and outdoor recreational functions for the betterment of commuters’ overall wellbeing.
Moreover, Commuters perceived both direction of Southern 90 Street differently. This in support for the hypothesis of this manuscript that the characteristics of the urban form and built environment affects commuters differently. It further indicates that the urban form and built environment characteristics have a differential impact on commuters. The findings support the hypothesis that factors such as land use mix and urban form influence commuters’ experiences in distinct ways. In addition it aligns with findings from previous study by [Citation32], in which they study the influence of built environment elements in 20 cities in China. Understanding these influences is crucial to enhance commuters’ perception and overall well-being. By analyzing the relationship between elements of the built environment, land use mix, and commuters’ perceptions, valuable insights could be gained on how to improve urban planning and design for the betterment of commuters’ daily experiences and well-being. This study depicts that in order to reduce the perceived travel time and enhance the subjective wellbeing of the commuters, urban corridors should be designed to accommodate greener spaces. In addition to reducing the installation of billboards, since they were one of the top elements that was associated with negative perception. Additionally, the monorail track design should be revisited toward enhancing its perception by the commuters.
By considering the unique characteristics and requirements of each city, these approaches and strategies can be tailored to create sustainable and liveable urban environments that enhance the overall quality of life for residents. In summary, this study seeks to provide valuable insights into the design of corridors and streets, emphasizing the importance of considering subjective wellbeing and overall perception to achieve a better quality of life for commuters and residents alike. However, the study of such variables could be further enhanced by understanding the magnitude of the influence of built environment elements on perception of time and subjective wellbeing. By elaborating the influence of such aspects, urban planners and policymakers can strive to create environments that promote positive commuting experiences and enhance the overall quality of life for the residents. Since, understanding the complex relationship between urban form, land use mix, and commuters’ perceptions will enable us to develop strategies that prioritize the well-being and satisfaction of commuters in the future urban planning endeavors.
This research tackles the importance of considering the various factors that shape commuters’ perceptions and ultimately contribute to their overall well-being in urban environments. It recommends that further studies could be carried out to the monorail into consideration, as long as urban mobility, travel behavior, and perceptions is concerned. The operation of the monorail will contribute to the creation of other auxiliary functions along the monorail’s axis. Thus, flow of the passengers, the functions in the surrounding context, and built environment elements will change. This in turn might significantly reveal different results.
Disclosure statement
No potential conflict of interest was reported by the author(s).
References
- Isaacs R. The subjective duration of time in the experience of urban places. J Urban Des. 2001;6(2):109–127. doi: 10.1080/13574800120057809
- Chiaradia AJF. Urban Morphology/Urban Form. In: Orum A, editor. The wiley blackwell encyclopedia of urban and regional studies. Hoboken, New Jersey, United States: John Wiley & Sons, Ltd; 2019. p. 1–6. doi: 10.1002/9781118568446
- Fleischmann M, Romice O, Porta S. Measuring urban form: overcoming terminological inconsistencies for a quantitative and comprehensive morphologic analysis of cities. Environ Plan B Urban Anal City Sci. 2021;48(8):2133–2150. doi: 10.1177/2399808320910444
- Lynch K. What time is this place? Cambridge, Massachusetts, United States: MIT Press; 1976.
- Jacobs J. The death and life of American cities. New York, United States: Vintage Books; 1961.
- Appleyard D, Lynch K, Myer J. The View from the Road. Cambridge, Massachusetts, United States: MIT Press; 1965.
- Benedikt ML. To take hold of space: isovists and isovist fields. Environ Plann B. 1979;6(1):47–65. doi: 10.1068/b060047
- Fuchs C. Henri Lefebvre’s theory of the production of space and the critical theory of communication. Commun Theory. 2019;29(2):129–150. doi: 10.1093/ct/qty025
- Lefebvre H. Rhythmanalysis. Space, time, and everyday life. London, New York: Continuum; 2004.
- Hajrasoulih A, Rio D, Vicente F, et al. Urban form and mental wellbeing: scoping a theoretical framework for action. J Urban Design And Mental Health. 2018;5:10 . https://www.urbandesignmentalhealth.com/journal-5---urban-form-and-mental-wellbeing.html
- Dixit V, Jian S, Hassan A, et al. Eliciting perceptions of travel time risk and exploring its impact on value of time. Transp Policy. 2019;82:36–45. doi: 10.1016/j.tranpol.2019.08.001
- Parthasarathi P, Levinson D, Hochmair H, et al. Network structure and travel time perception. Network Struct And Travel Time Per. 2013;8(10):e77718. doi: 10.1371/journal.pone.0077718
- Delclòs-Alió X, Marquet O, Miralles-Guasch C. Keeping track of time: a Smartphone-based analysis of travel time perception in a suburban environment. Travel Behav Soc. 2017;9:1–9. doi: 10.1016/j.tbs.2017.07.001
- Chen H, Xu C, Raghavan V, et al. Exploring human spatio-temporal travel behavior based on cellular network data. A case study of Hangzhou, China. Int J Geoinformatics 2019 Sept;15(3):1–12.
- Cervero R, Kockelman K. Travel demand and the 3Ds: density, diversity, and design. Transp Res D Transp Environ. 1997;2(3):199–219. doi: 10.1016/S1361-9209(97)00009-6
- Ewing R, Cervero R. Travel and the built environment. J Am Plann Assoc. 2010;76(3):265–294. doi: 10.1080/01944361003766766
- Chatterjee K, Chng S, Clark B, et al. Commuting and wellbeing: a critical overview of the literature with implications for policy and future research. Transp Rev. 2020;40(1):5–34. doi: 10.1080/01441647.2019.1649317
- Singleton PA. Walking (and cycling) to well-being: modal and other determinants of subjective well-being during the commute. Travel Behav Soc. 2019;16:249–261. doi: 10.1016/j.tbs.2018.02.005
- Ettema D, Friman M, Gärling T, et al. How in-vehicle activities affect work commuters’ satisfaction with public transport. J Transp Geogr. 2012;24:215–222. doi: 10.1016/j.jtrangeo.2012.02.007
- Ettema D, Gärling T, Eriksson L, et al. Satisfaction with travel and subjective well-being: development and test of a measurement tool. Trans Res Part F: Traffic Psychol And Behav. 2011;14(3):167–175. doi: 10.1016/j.trf.2010.11.002
- Ettema D, Gärling T, Olsson LE, et al. The road to happiness: measuring Dutch car drivers’ satisfaction with travel. Transp Policy. 2013;27:171–178. doi: 10.1016/j.tranpol.2012.12.006
- NUCA. 2023a. Insights on New Cairo. New urban communities authority. http://www.newcities.gov.eg/knowcities/NewCairo/(1).aspx,checkedon2021-2023.
- NUCA. 2023b. New Cairo development unit. Insights on New Cairo. New Urban Communities Authority. http://www.newcities.gov.eg/knowcities/NewCairo/default.aspx,checkedon2021-2023.
- Qin T, Dong W, Huang H. Perceptions of space and time of public transport travel associated with human brain activities: a case study of bus travel in Beijing. Comput Environ Urban Syst. 2023;99(2):101919. doi: 10.1016/j.compenvurbsys.2022.101919
- Jiang Y, Han Y, Liu M, et al. Street vitality and built environment features: a data-informed approach from fourteen Chinese cities. Sustain Cities Soc. 2022b;79(6):103724. doi: 10.1016/j.scs.2022.103724
- Dong L, Jiang H, Wenjing L, et al. Assessing impacts of objective features and subjective perceptions of street environment on running amount: a case study of Boston. Landscape Urban Plann. 2023;235(3):104756. doi: 10.1016/j.landurbplan.2023.104756
- Herrmann-Lunecke MG, Mora R, Vejares P. Perception of the built environment and walking in pericentral neighbourhoods in Santiago, Chile. Travel Behav Soc. 2021;23(3):192–206. doi: 10.1016/j.tbs.2021.01.002
- Song Y, Merlin L, Rodriguez D. Comparing measures of urban land use mix. Comput Environ Urban Syst. 2013;42:1–13. doi: 10.1016/j.compenvurbsys.2013.08.001
- Turner A, Doxa M, O’Sullivan D, et al. From isovists to visibility graphs: a methodology for the analysis of architectural space. Environ Plann B Plann Des. 2001;28(1):103–121. doi: 10.1068/b2684
- Bordoloi R, Mote A, Sarkar PP. Quantification of Land Use Diversity in The Context of Mixed Land Use. Proc - Socl and Behl Sci. 2013;104:563–572. doi: 10.1016/j.sbspro.2013.11.150
- Masoumi HE, Terzi F, Serag YM. Neighborhood-scale urban form typologies of large metropolitan areas: Observations on Istanbul, Cairo, and Tehran. Cities. 2019;85:170–186. doi: 10.1016/j.cities.2018.09.005
- Jiang Y, Han Y, Liu M, et al. Street vitality and built environment features: a data-informed approach from fourteen Chinese cities. Sustainable Cities Soc. 2022a;79:103724. doi: 10.1016/j.scs.2022.103724