
ABSTRACT
The pressure distribution over buried structures like pipes and tunnels are considered a main factor in the economic design of such structures. This study shows the effect of using crumb rubber mixed with sand and geogrid layers to enhance the soil pressure distribution over that buried structure. That method is titled a high-filled cut-and-cover (HFCCT) construction method. Crumb rubber particles pieces mixed with sand as a lightweight fill material (LFM) in HFCCT are used to reduce the vertical earth pressure (VEP) on that buried tunnel. Geogrid reinforcement layer above the HFCCT system to strengthen the soil layers above the tunnels were implemental. A physical model is built to simulate such conditions by applying external loads to the treated soil layers above the tunnel. The strains are measured on the external body of the tunnel, while the soil pressure is assessed through pressure gauges around the tunnel. The results obtained from the crumb rubber models are compared with those obtained from the geogrid model. It was deduced that using crumb rubber and geogrid, reduces the earth pressure above the cut-and-cover tunnel (CCT). As compared to the use of geogrid, the utilization of rubber as a substitute for soil results in a 27% drop in pressure. The obtained results show that the use of geogrids in sandy soils leads to uniform stress, while using rubber sand could reduce the maximum stress of the soil above the tunnel.
Introduction
High-filled cut-and-cover tunnels (HFCCTs) offer a promising solution to the pressing demand for usable land. However, the technique of reclamation tunneling involves injecting a substantial amount of backfill material into the cut-and-cover tunnel (CCT), resulting in elevated overburden pressure. Understanding methods to reduce this load is crucial to minimize risks and cut down design costs [Citation1]. Consequently, it becomes imperative to finely tune the construction of CCT lining to enhance safety and reduce thickness, especially under the pressure from backfilled ground [Citation2,Citation3]. Crack formation within the CCT is closely associated with displacements and internal forces. Any unwarranted displacement in the lining can trigger structural instability, posing a risk of damage to the entire structure [Citation4]. One potential solution involves substituting a portion of the soil with rubber as a Load-Bearing Flexible Material (LFM) [Citation5]. Transition mixtures, comprising both sand and rubber, exhibit a behavior with increasing confinement stress, showing traits akin to rubber at low confinement and sand at high confinement [Citation6,Citation7]. Rubber sand mixtures with a 50:50 ratio impacts shear strength and settlement reduction [Citation8,Citation9]. Moreover, incorporating LFMs can decrease Vertical Earth Pressure (VEP) at the CCT’s center top [Citation10], with reductions increasing as the thickness of the LFM increases [Citation11]. Furthermore, employing geosynthetic soil reinforcement has shown results in settlement, especially in geotextile and geogrid. But geogrid increases the strength and stability of the soil by creating a bond with the fill material and shows promising results on earth pressure and enhance load-bearing capacity [Citation12,Citation13]. Also, Geogrids decrease radial pressure, settlement and stress on pipes significantly [Citation14,Citation15]. According to previous research geogrid hasan effect on soil earth pressure and bearing capacity around infra-structures.
This paper describes an investigation into the load transfer mechanisms that are affected by the placement of rubber sand and geogrid over a HFCCT. It also concentrates on discussing the effects of rubber sand and geogrid on strains of CCT, soil behavior, and VEP distribution. Experimental model tests have been conducted to investigate these factors under various foundation pressures. In addition, further comparisons were also made for innovative solutions to mitigate tunneling challenges.
Experimental setup
Model scale
It aims to replicate authentic testing conditions by aligning the scale of the model with that of a potential prototype. Similar materials were carefully selected for the model, resulting in a density similarity ratio (Cr) of 1. The prototype scale ratio (CL) for the experimental model was calculated to be 1/35, in accordance with the suitable test equipment and research objectives. To verify the accuracy of the scale, a comparison was undertaken with a similar model with ABAQAS created by Sheng Li [Citation16]. This comparison was conducted using numerical analysis with PLAXIS 3D. Sheng Li uses a model with scale of 1/25, as depicted in for stress results and for displacement results. In this context, Cσ represents the similarity scale of stress, which equals 35; Cu denotes the similarity scale of displacement, also equal to 35; Cε signifies the similarity scale of strain, which equals 1; Cε indicates the similarity scale of elastic modulus; and Cμ reflects the similarity scale of Poisson’s ratio, also equal to 1.
Figure 1. Comparison between stress results by ABAQS and PLAXIS 3D.
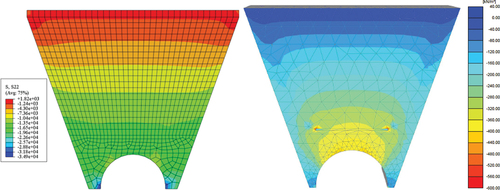
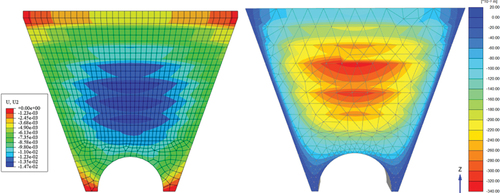
Figure 2. Comparison between displacements results by ABAQS and PLAXIS.
Loading system
A fixed column, consisting of two 200 × 200 × 10 mm (C) channels, supported the loading frame’s 320 × 320 × 12 mm steel beam. The test tank’s outer frame held the column, with its primary function is to stabilize the loading frame. Stiffeners and welds were used to secure the column to the frame. An axial load was applied using a 24 mm steel rod, with hinges connecting the axial rod to the horizontal beam to ensure vertical loading (see ). In contrast to hydraulic jacks, the current loading method maintains applied loading tension without dispersion over time due to oil decrease in the hydraulic piston and soil bed settling. Weights transfer loading via the loading frame, with 10 kg in the system equivalent to 40 kg. A 0.8 × 0.75 m plate converts load into stress, with 40 kg equaling 0.65 kPa.
Figure 3. Schematic view of the physical model configuration for loading system.
Experimental model scheme
The experimental testing tank dimensions is chosen by 174 cm, 85 cm, 100 cm (length, width, height) to simulate a three-dimensional loading condition as shown in . To ensure sturdiness, Perspex plates with a thickness of 20.00 mm were employed for the longer sides. According to previous research both slopes were set at an incline angle equal to 70° and were constructed using concrete to simulate rigidity and stability of soil in the cutting process. The slopes surfaces were deliberately textured to replicate the frictional effects between the slopes and the backfill soil. To accurate the scale analysis and replicate the lateral load behavior of the soil, the width of was adjusted to 120 cm, and the remaining space in the tank was then filled with compacted sand.
Figure 4. Schematic S-S side view of the physical model.
Test setup
In each of the model tests, the backfilling process parameters were replicated as follows:
Position the CCT between the slope and the sidewalls after installing the strain gauge.
Complete the filling and compacting process for the first layer until the CCT is fully covered at a height of 25 cm.
Add a pressure cell every 20 centimeters, following the placement indicated as shown in .
Fill and compress each layer to a thickness of 10 centimeters during the process.
Repeat the filling and compacting process until the desired height is achieved.
The loading begins at 10 kPa and gradually increases to 0.65 kPa. Pressure and strain gauge readings are taken at each pressure cell following each increase in stress, shows the test setup and measurement tools.
Figure 5. Test setup and measurement tools.
Description of the used material
The physical and mechanical properties of the backfill soil were acquired by conducting the relevant tests. In the laboratory, we performed direct shear tests to acquire the cohesion, and the internal friction angle. We also obtained grain size distribution resulting as badly graded medium sand. Other properties, such as minimum and maximum void ratio and density were also obtained from standard proctor testing following ASTM D698.
Rubber particles derived from shredded tires exhibited an average particle size (d50) of 1.8 mm, and a density of 0.47 g/cm3. The rubber was blended with 40% d50 = 0.6 mm sand. presents a comparison of the results from direct shear and relative density tests conducted on backfill sand and rubber-sand mixtures.
Table 1. Comparison between properties of backfill and rubber-sand mixture.
Egyptian Biaxial Netlon Geogrid (CE131) uses to strengthen the sand in experimental models provides a shape and the exceptional longitudinal and transverse tensile strength exhibited for geogrid.
Figure 6. Geogrid used in this study: (A) Netlon geogrid, (B) Tensile force stress diagram [Citation17].
![Figure 6. Geogrid used in this study: (A) Netlon geogrid, (B) Tensile force stress diagram [Citation17].](/cms/asset/208d8c39-fc5e-4878-a6a3-58178154e89a/thbr_a_2363731_f0006_b.gif)
In practical model applications for HFCCT, the liner is designed using C30 concrete, and it was found that a semi-circular tunnel is more favorable than rectangular cross-sections for soil arching [Citation16]. Bin Zhuoa and Feiyang Wanga [Citation4] simulate C30 concrete in a 1:25 scale model with a mixture ratio of water, gypsum, and gypsum diatomite in a mass ratio of 1:1.30:0.1. In Egypt, to achieve a similar mixture, diatomite was substituted with silica fume. The mixture was adjusted to a ratio of 1.23:1.3:0.02 (mass ratio) of water, gypsum, and silica fume to simulate uniaxial compression with a model scale. illustrates the uniaxial compression test for the mixture sample, while provides detailed mechanical parameters for both the CCT prototype and the model. The reinforcement of the CCT model was simulated by a 0.75-mm-diameter steel mesh (). Three strain gauges were installed on top of the CCT, and three were placed below the top of the CCT cross-section, as shown in .
Table 2. The mechanical characteristics of both the CCT prototype and the model.
Figure 7. (A) Uniaxial compression test, (B) steel mesh, (C) strain gauge on CCT.
Parametric studies
The tests were designed to assess the effects of load reduction using rubber sand and geogrid. Seven scenarios were investigated under various conditions, with details provided in . Three scenarios are chosen for each load reduction method to test the effective thickness for rubber-sand (S2, S3, and S4) and the effective length for biaxial geogrid (S5, S6, and S7). These scenarios aimed to analyze the distribution of earth pressure around the CCT. Additionally, one scenario was conducted with a standard model to serve as a baseline for comparing the results of load reduction.
Table 3. Testing schemes.
Results and discussion
In this phase of the research, data collected from the earth pressure cell, encompassing recorded lateral earth pressure, Vertical Earth Pressure (VEP) at the top of the CCT, and strain on the CCT’s cross-section, are meticulously processed and analyzed. Subsequently, the accumulated data undergoes processing following the established similarity relationship.
Effect of load reduction methods on cut-and-cover tunnel
To investigate the effects of load reduction methods on the stability of the tunnel under various pressures on the foundation. The study presents the stress strain curve above CCT in all cases in with a change in the pressure of the foundation. Comparing the results led to geogrid and rubber-sand samples making the tunnel withstand higher pressure for the foundations. The best sample for reducing pressure above the tunnel is sample S4, reaching 29 KPa at failure.
Figure 8. Stress strain curve for CCT under applied pressure on foundation.
shows that in sample S1, the tunnel sector testified to collapse at 18.5 KPa. To discuss the factor effecting the stability of the tunnel, the 18 Kpa choice as a benchmark pressure for comparison across all samples.
shows a reduction in pressure above the CCT cross-section in the middle across all cases. The results demonstrate that samples S4 and S7 significantly reduce pressure on the transverse axis of the CCT’s cross-section, with central pressure reduced by 47% and 37%, respectively. Additionally, lateral earth pressure on the sides of the CCT decreases by 27% and 17%, respectively. Notably, rubber-sand samples help maintain consistent pressure levels on both sides of the tunnel. The analysis showed that one of the most important factors affecting the stability of the tunnel is reducing the disparity between the pressure above the tunnel and then reducing the pressure above.
Figure 9. Earth pressure on CCT under pressure footing 18Kpa along the horizontal axis.
Effect of rubber-sand and geo-grid in earth pressure on layer of soil
Furthermore, pressure cells were used on the vertical direction to study rubber-sand and geo-grid’s effect on the backfill layers and to analyses how they affect soil bearing capacity. To carry out this study, the pressure on the soil around the area used in the rubber-sand and geo-grid was studied.
Effect of rubber-sand
Comparisons were made with each case of rubber-sand samples S2, S3, and S4, specifying the top (T) and bottom (B) stress for each. Through deep analysis, the results were scrutinized within the context of the corresponding curves. and show the influence of rubber sand on the bottom and top levels of the layer. and illustrate that using rubber reduces the pressure above CCT by 15%, 27%, and 37%, respectively.
Figure 10. Case S2 (T = 0.6 H).
Figure 11. Case S3 (T=0.9 H).
Figure 12. Case S4 (T=1.1 H).
When discussing the effect of layers on top-level stress in samples S2 and S3, stress decreased by 15% and 12%, respectively. However, Sample S4 has a different behavior; the curve shows a reduction in stress, and with increasing pressure on the foundation, the stress increases on the top layer of rubber sand. Analysis shows an increase in stress with an increase in thickness and a reduction in the height of the backfill. Compared with the results mentioned before in discussing VEB on CCT in the traverse direction, the rubber-sand layer increases the bearing capacity on the soil in addition to reducing the load above the CCT.
illustrates the reduction of earth pressure with respect to soil weight in each applied pressure on the foundation and presents a guideline for future design to choose the best thickness of rubber-sand layer to reduce the earth pressure above CCT.
Figure 13. Effect of using rubber-sand in earth reduction.
Effect of geogrid
In order to investigate the effect of using geogrid on soil, and illustrate the effect of geogrid. From the figures, in all samples, stress above CCT decreased with the increase in distance between CCT and geogrid, which means there is an inverse relationship between the place of geogrid and CCT. Otherwise, it is a direct relationship between the place of the geogrid and the foundation. When discussing the top-level stress of geogrid, it is found that in samples S5, and S6 stress increase. However, in S7 the stress decreases and that shows the behavior of geogrid and the relation between distance between geogrid and foundation, and geogrid and CCT. The effectiveness of the geo-grid is more pronounced when it is closer to the foundation level.
Figure 14. Case S5 (L=0.95 H).
Figure 15. Case S6 (L=1.1 H).
Figure 16. Case S7 (L=1.25 H).
Finally, demonstrates how the geo-grid linearly changes the pressure with respect to vertical distance, from higher earth pressure to lower results. Additionally, it highlights the role of geogrid in reducing lateral pressure by redistributing pressure laterally rather than perpendicularly on the CCT. This is evident in the stable pressure values around each geo-grid sample at 6 cm from the top and bottom of the geo-grid. The figure shows the pressure acting on the use of geogrids. The behavior of soil around geogrid gives a linear curve with an angle of about 70°, which means it gives the same angle for soil slope. That gives a good guideline for using geogrid in the future on soil slopes besides the foundation.
Figure 17. Comparison between geo-grid samples.
Comparison between earth pressure reduction in different methods
Finally, demonstrates the load reduction methods in this study and their performance under different applied pressures on the foundation. The figure illustrates the redaction of earth pressure under foundation pressure in all cases in the studies. The best solution is to use a layer of rubber-sand above CCT to cover half the depth of the backfill. Also, geogrids give good results near the foundation to distribute the pressure.
Figure 18. Comparison between earth pressure reduction in different methods.
Conslusion
This study delves into the interactions among foundations, soil, and CCT in soil-structure interactions. With pressure cells and strain gauges, rubber sand and geogrids were tested to mitigate CCT pressure. Their effects on soil settling and bearing capacity were pivotal aspects of the investigation. The key findings gleaned from the study encapsulate the previously highlighted relationships:
Vertical stress results on the CCT indicate that replacing soil with rubber sand by 40% leads to a reduction in pressure above the tunnel by 15%, 27%, and 37%, respectively. However, there is no notable impact on lateral earth pressure.
Geogrids reduce vertical earth pressure at distances L = 0.95 H, 1.1 H, and 1.25 H by 16%, 27%, and 35%, respectively. Although findings on lateral earth pressure are lower compared to rubber-sand samples, they exhibit a decrease in conjunction with foundation pressure. The geogrid mitigates ground pressure around the CCT, affecting both vertical and lateral aspects.
The introduction of a rubber-sand layer influences soil pressure. The rubber layer enhances soil pressure-bearing capacity with an equivalent volumetric replacement. Rubber improves soil carrying capacity and shear strength, yet the behavior of rubber-sand soil mirrors that of sand.
Geogrids bolster soil carrying capacity, particularly in the vicinity of foundations, thereby reducing earth pressure over the CCT.
thbr_a_2363731_sm1606.pdf
Download PDF (42.5 KB)Disclosure statement
No potential conflict of interest was reported by the author(s).
References
- Li S, Ho I, Ma L, et al. Load reduction on high-filled cut-and-cover tunnel using discrete element method. Comput Geotech. 2019a;114:103149. doi: 10.1016/j.compgeo.2019.103149
- Xu TY, Wang MN, Yu L, et al. Research on the earth pressure and internal force of a high-fill open-cut tunnel using a bilayer lining design: a field test using an FBG automatic data acquisition system. Sensors. 2019;19(7):1487. doi: 10.3390/s19071487
- Ma L, Wang S, Ho I-H, et al. Optimized design of lining structure for high-filled cut-and-cover tunnels in the plateau region of Northwest China. J Geoeng. 2020;17(3):143–151. doi: 10.6310/jog.202209_17(3).3
- Zhuoa B, Wanga F, Fanga Y, et al. Analysis of cracking development and mechanical characteristics of high-filled cut-and-cover tunnel. Tunnel Eng. 2020;24(8):2519–2532. doi: 10.1007/s12205-020-0247-3
- Lee J-S, Dodds J, Carlos Santamarina J. Behavior of rigid-soft particle mixtures. Mater In Civil Eng. 2007;19(2):179–184. doi: 10.1061/(ASCE)0899-1561(2007)19:2(179)
- Kim H-K, Santamarina JC. Sand–rubber mixtures (large rubber chips). Can Geotech. 2008;45(10):1457–1466. doi: 10.1139/T08-070
- Lee C, Truong QH, Lee W, et al. Characteristics of rubber-sand particle mixtures according to size ratio. Mater In Civil Eng. 2010;22(4):323–331. doi: 10.1061/(ASCE)MT.1943-5533.0000027
- Lee C, Shin H and Lee J-S. Behavior of sand–rubber particle mixtures: experimental observations and numerical simulations. Num Anal Meth Geomech. 2014;38(16):1651–1663. doi: 10.1002/nag.2264
- Lopera Perez JC, Kwok CY, Senetakis K. Effect of rubber size on the behaviour of sand-rubber mixtures: a numerical investigation. Comput Geotech. 2016;80:199–214. doi: 10.1016/j.compgeo.2016.07.005
- Zhuo B, Zhu M, Fang Y, et al. Numerical and experimental analyses for rubber-sand particle mixtures applied in high-filled cut-and-cover tunnels. Constr Build Mater. 2021;306:124874. doi: 10.1016/j.conbuildmat.2021.124874
- Hon Kong Sung B, Yee Wong S, Aaniya Cyril P, et al. Effects of crumb rubber on the shear strength of sand: an experimental study. Adv Technol. 2021;2(2):167–182. doi: 10.31357/ait.v2i2.5446
- Ahmed MR, Tran VDH, Meguid MA. On the role of geogrid reinforcement in reducing earth pressure on buried pipes: experimental and numerical investigations. Soils Found. 2015;55(3):588–599. doi: 10.1016/j.sandf.2015.04.010
- Hasan M, Samadhiya NK. 3D numerical analysis of granular piles with internal horizontal geogrid strips in layers. In: Indian Geotechnical Conference 2016; IGC IIT Madras, Chennai, India; 2016.
- Mohamed A, Mosleh N, Salama AG. Assessment of geogrids in gravel roads under cyclic loading. Alexandria Eng. 2017;56(3):319–326. doi: 10.1016/j.aej.2016.09.023
- Bildik S, Laman M. Effect of geogrid reinforcement on soil - structure – pipe interaction in terms of bearing capacity, settlement, and stress distribution. Geotext Geomembr. 2020;48(6):844–853. doi: 10.1016/j.geotexmem.2020.07.004
- Li S, Jianie Y, Hob I-H, et al. Experimental and numerical analyses for earth pressure distribution on high-filled cut-and-cover tunnels. KSCE J Civ Eng. 2020;24(6):1903–1913. doi: 10.1007/s12205-020-1693-7
- Ahmad H. Sustainability effect of geogrid reinforced tire-shred sand mixtures on the load pressure-settlement response of shallow footing. Heliyon. 2022;8(11):e11743. doi: 10.1016/j.heliyon.2022.e11743