Abstract
This article presents a model reduction of laminar incompressible fluid flows in two-dimensional geometries cases. The modal identification method [Petit, Hachette, and Veyret, A modal identification method to reduce a high order model: application to heat conduction modelling, Int. J. Model. Simulation, 17, 242–250; Girault and Petit, Identification methods in non linear heat conduction, Part I: model reduction; Int. J. Heat Mass Transfer, 2005, 48, 105–118; Balima, Favennec, Girault, and Petit, The modal identification method in non linear heat transfer problems, Proceedings 13 International Heat Transfer Conference, Sydney, Australia, 2006] is used to derive a structure for the reduced models (RMs). These RMs are identified through a minimization algorithm where the cost function gradient is computed with the adjoint method [Balima, Favennec, Girault, and Petit, The modal identification method in non linear heat transfer problems, Proceedings 13 International Heat Transfer Conference, Sydney, Australia, 2006; Favennec, Girault, and Petit, The adjoint method coupled with the modal identification method for non linear model reduction, Inverse Probl. Sci. Eng., 2006, 14, 153–170; Balima, Réduction de modéle non linéaire par identification modale: application en thermique et comparaison avec la méthode POD-Galerkin, PhD thesis, Université de Poitiers, France, 2006]. Two laminar steady fluid flows in a pipe and in a square cavity (lid-driven cavity) are used to illustrate the study. The results show that the identified RMs are able to reproduce with accuracy the behaviour of the considered model.
1. Introduction
The numerical solution of fluid mechanics problems usually needs a fine spatial discretization of a given domain. This yields to a system of large number N of degrees of freedom called the detailed model (DM). According to the large number N, the simulation of such DM is highly time consumming, especially when dealing with inverse, optimization and control problems where the DM has to compute many times.
In order to avoid such time consumption, the idea is to make a model reduction which aims at extracting, from the knowledge of the DM, a reduced model (RM) that adequately describes the input–output behaviour of the process under study. The reduction methods reduce the size N of the system and consequently the CPU time while still keeping an acceptable accuracy.
Model reduction techniques have received a growing attention in the last decades, both in the automatics community and in various application areas such as in chemical engineering, electronics and mechanics systems. A variety of different model reduction techniques exists for linear and non-linear systems and the aim of almost any reduction technique is to provide a reduced order system (called RM) that best describes the system under consideration with a low number of degrees of freedom. Both the modal identification method (MIM) Citation2,Citation9–11 and the POD-Galerkin method (POD-G) Citation9–11 among others have proved to be efficient when considering linear and non-linear systems.
The POD-G is a Galerkin resolution method that uses the proper orthogonal modes obtained through a proper orthogonal decomposition (POD) as a basis for the projection of the partial differential equations of the system.
The MIM defines a structure for the RM according to the modal base formulation of the system of ordinary differential equations, which represents the discretized version of the partial differential equations of the physical system. Once this structure is chosen, the parameters (i.e. the components of the matrices of the reduced system) of the RM are identified through the solution of a minimization problem.
The MIM and the POD-G have recently been used and compared on heat conduction systems where the conductivity coefficent is temperature dependant Citation5,Citation12. In this study, a formal comparison between both methods revealed that, though the basics and the general philosophy inherent to both methods are completely different, it is formally possible to write down a common structure for the equations of the reduced models. The results of numerical comparisons of both methods showed that the reduced models obtained through the MIM were slightly more accurate than those obtained through the POD-G.
While the POD-G has been known for years to be very efficient on fluid mechanics problems Citation9,Citation11,Citation13–16, the MIM has only been tested on those problems very recently Citation5,Citation17.
The aim of this article is to present the first results concerning the model reduction on 2D laminar flows through the identification method. It is shown here how to choose the structure of the RMs from the Navier–Stokes equations, and how to identify the corresponding parameters. Two test cases in 2D geometry are then given to illustrate the study.
2. Structure of the RM
2.1. System description
The system under consideration is a two-dimensional incompressible Newtonian fluid flow, where the volume strengths are null. It is then described by the mass conservation and the Navier–Stokes equations Citation18, which writes
(1)
and
(2)
(3)
where u and v are the components of the velocity vector, p is the pressure, ρ is the density and ν the cinematic viscosity. By using the stream function ψ and the vorticity ω defined by
(4)
Equations (1) and (2) are written
(5)
(6)
2.2. Detailed model equations
From a spatial discretization of the system (4) associated to its initial and boundary conditions, one may obtain a system of equations that can be written in a matrix form:
(7)
(8)
where Ψ ∈ RN and Ω ∈ RN are the discrete versions of variables ψ and ω, N is the number of unknowns, matrix A represents the discrete form of the Laplacian operator. The vector E(Ω) ∈ RN(N+1)/2 represents the non-linear terms induced in Equation (4b) and D ∈ RN×N(N+1)/2 is the corresponding matrix. According to the non-linearities induced in (4b), the vector E(Ω) can be written as
(9)
The initial condition is taken into account by setting Ω(0) = Ω0. U ∈ Rm is the input vector where m is the number of inputs. In U, all the boundary conditions of the problem are taken into account and B ∈ RN×m is the input matrix that allows the application of these conditions in order to the derivative of the state vector.
Remark
In the system of Equations (5), Equation (5b) is independent to Equation (5a), which gives the stream function field. Then the formulation (5) can be reduced to Equation (5b) when the stream function field is not needed. In the following development, our aim is to find a formulation that gives the velocity field. Then only Equation (5b) will be used.
Let us introduce now an output vector Y ∈ Rq in order to observe a part of (or all) the components of the velocity field where q is the number of observed components. This vector can be linked linearly to the state vector :
(10)
where the matrix C ∈ Rq×N is the output matrix.
In order to find a structure for a RM in the MIM method, a modal formulation of Equation (5) is written by using the change of variables
(11)
where M is the eigenvector basis of matrix A such as
(12)
F is the corresponding diagonal matrix of the eigenvalues of the matrix A.
Equations (5a) and (7) yields to the modal formulation:
(13)
(14)
The form of the vector of non-linear terms Z(X) is the same as that in Equation (6). The matrices Σ, G and H have, respectively, the same meanings as matrices D, B and C.
The formulation (10) is the modal base formulation of the DM. It leads to solve a system of N equations, N being related to the size of the mesh which is used.
2.3. RM equations
In the MIM Citation2,Citation12, the modal base formulation of the DM (10) is used to derive a structure for the RM. Hence, the RM has the following structure
(15)
(16)
where x is the new state vector whose dimension n is much lower than the original model (n ≪ N). The matrices f, σ, g and h have the same signification as matrices F, Σ, G, and H, but are built on the dimension n, instead of N.
In the framework of this article, as we will consider steady fluid flows, these equations are simplified by removing the transient term, i.e. . Hence, the RM equations are given by
(17)
(18)
where σ′ = (f)−1σ and g′ = (f)−1g. The matrices σ′, g′ and h are now the parameters that describe the RM of order n, and are to be identified.
Let us underline that the vector y is linear with respect to the matrix h (Equation (12b)) as soon as vector x is given, i.e. when matrices g′ and σ′ are known. Therefore, the matrix h can be obtained using linear least squares at each iteration when the matrices g′ and σ′ are updated. Hence, the components of h are not included within the vector of unknown parameters θ, where only the matrices g′ and σ′ are taken into account in the non-linear process. This allows us to reduce the computation time. Taking into account this remark, the vector of parameters to be identified is written from now on
(19)
for all i = 1, …, n, j = 1, …, n. (n + 1)/2, l = 1, …, p.
3. The RM identification
3.1. The minimization problem
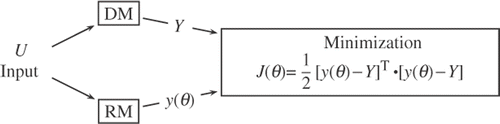
The identification aims at minimizing the mean-squared discrepancy between the output vector Y (data of simulation) of the DM and the output vector y of the RM that depends on its parameters when, both the DM and the RM are submitted to the same input U. summarizes the principle of the identification process.
Figure 1. The identification principle.
Knowing h, the objective function to be minimized is then:
(20)
submitted to an equality constraint on the state vector x in Equation (12a) which writes
(21)
The optimization problem is then used to find the optimal vector
such that
(22)
This minimization is performed through a quasi-Newton-type approach (Broyden–Fletcher–Goldfarb–Shanno method) Citation19 where the gradient of the cost function is needed. In the following, we use the adjoint method to derive the gradient of the cost function J(θ).
3.2. Gradient through the adjoint method
The Lagrangian of the minimization problem (16) is defined by
(23)
where [a, b] is the scalar product:
and λ is a vector which represents the adjoint variable.
The differentiation of L(θ, λ, x) with respect to θ in the direction δθ writes
(24)
In the adjoint method, the aim is to choose the vector λ such that
(25)
Taking into account that the differentiation of Equation (15) with respect to θ writes
(26)
we rewrite Equation (18) as
(27)
The use of Equations (19) and (21) allows one to write
(28)
Then, λ is chosen to verify Equation (22) without having to compute the sensitivities of x with respect to the parameter θ in the direction δθ. The adjoint problem (equation for λ) is obtained by transposing the scalar product in Equation (22). This yields to
(29)
where the superscript * is relative to the transposition of the operator. As (23) is valid for any direction δθ, we then obtain
(30)
By using Equation (15), the related adjoint problem writes
(31)
At each iteration, λ is computed and the gradient ∇J is determined through Equation (18) with a scalar product using .
3.3. Minimization algorithm
For a given order n of the RM, the searched parameter vector is given by an iterative procedure
(32)
where d k is the direction of descent and αk is the descent step size. The optimal step size, which requires both the objective function value and its gradient, is given through a cubic polynomial interpolation.
After computing , the aim is to build the optimal matrix
. This matrix contains q × n unknowns. In order to identify these parameters in an over determined way, at least this amount of data is needed. This data are given through the output vector Y ∈ Rq of the DM. Therefore, if n is the order of the RM, at least n′ different simulations with DM are needed where n′ > n. These simulations are obtained with different values of the input vector U. The linear formulation of Equation (12) is then written for each of these n′ simulations
(33)
Equation (27) can be written with macro matrices as
(34)
where
and
. By writing the minimization of the quadratic norm of y − Y it can be shown that Citation20:
(35)
The global minimization algorithm is the following:
| 1. | Compute the DM with different values of the input vector U to obtain different output vectors Y. | ||||
| 2. | Initialize the order of RM (i.e. n = 1). | ||||
| 3. | Initialize the matrix h. | ||||
| 4. | Find the minimum of J(θ) through Equation (26). | ||||
| 5. | Compute matrix h through Equation (29) and go back to (3) until convergence. | ||||
| 6. | Increase the RM order, i.e. n = n + 1 and go back to (2) until a global criterion is satisfied, or when J(θ) no longer decreases in a significant manner. | ||||
4. Test case 1: flow in a lid-driven cavity
4.1. Description and simulations
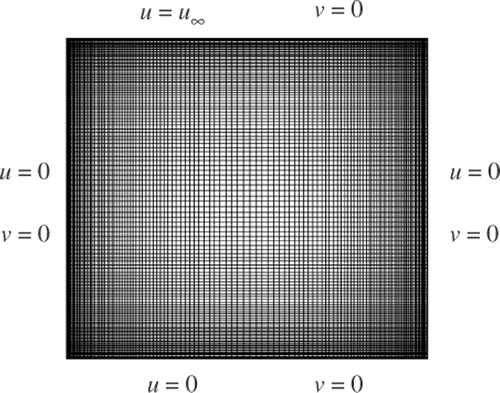
The lid-driven cavity problem is a well-known test for the validation of numerical codes. The problem geometry is a two-dimensional one where the boundary conditions are also simple (). The test case is a fluid (ν = 0.002 ms−1) contained in a square domain (of side d = 1 m) with Dirichlet boundary conditions on all sides: three stationary sides and one moving side (the upper boundary moves to the right at velocity u∞). This velocity is therefore the unique input of the system, i.e. the vector U of Equation (12) has only one component (m = 1).
Figure 2. The computation grid with N = 15876 nodes and the boundary conditions.
The mechanical behaviour is described with the Reynolds number Re. A CFD software (Fluent®) is used to build and simulate the DM where the fluid flow domain is discretized into N = 15 876 nodes. Then, the obtained velocities fields (u and v fields) are used to build the output vector Y of the DM. As all the velocity field is considered, the dimension of the output vector is q = 2N.
Several input values for U are then used for the DM simulations with Fluent®. In order to stay in a laminar flow Citation21, low-input velocities are used: 0.4, 0.6, 0.9, 1.2, 1.4, 1.6, 2.3 ms−1. The corresponding Reynolds number values are 400, 600, 900, 1200, 1400, 1600, 2300 and 2500, respectiveley. shows the magnitude of the identification data on the velocity field where the mean value represents the statistical mean of the data.
Table 1. Maximal and mean velocity value of the identification data in the test case 1.
4.2. RM identification
The identification algorithm is then applied through the data given by the M = 8 simulations of the DM. presents the results: the evolution of the objective function J versus the dimension of the reduced model, as well as the mean quadratic error (ΔMean) and the absolute maximum error (ΔMax), where
(36)
Table 2. Influence of RM order.
Of course, these quantities are relative to the whole velocity field of the eight different numerical experiments corresponding to the eight Reynolds numbers. Then, it takes into accounts M × q = 254,016 velocities.
It can be seen in , how the cost function J and the corresponding errors of identification decrease when the order n of the RM increases. It is seen that for order n = 8, the errors ΔMean and ΔMax are very low compared to the magnitude of the velocity components ().
Let us remark that for a RM of order n, it has been identified n values for the vector g′ and n(n + 1) × n values for the matrix σ′ in Equation (11). For the matrix h, 2N × n values have been identified to obtain the whole velocity field (in Equation (11)).
4.3. RM validation
The validation of the RM aims at finding out if the RM is able to reproduce with accuracy the output Y of the DM when another input is applied to both. Here, an input velocity of 1 ms−1 corresponding to a Reynolds number of 1000 is used to validate the RM of order n = 8.
gives the mean quadratic errors and the maximum absolute errors on u and v versus the RM order. It is seen that the errrors of the RM are very low when compared to the magnitude of the velocity. and compare the u and v velocity fields of both models. Figures and show a good agreement of the velocity fields given by the DM and the RM of order n = 8. and present the stream function and the vorticity fields of the DM and the RM. A very good agreement between these results can be seen. Due to the spatial discretization of the velocity field that is obtained through RM, the results are better on the stream function than for the vorticity. This is due to the fact that the stream function is obtained from an integration of the velocity field, whereas the vorticity is obtained through a derivation of the velocity field (Equation (3)). Hence, the stream function field is more continuous than the vorticity one.
Figure 3. u velocity field of the DM (left) and the RM n = 8 (right) for Re = 1000. Available in colour online.
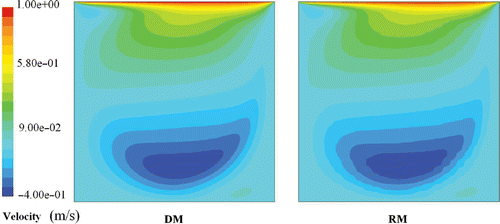
Figure 4. v velocity field of the DM (left) and the RM n = 8 (right) for Re = 1000. Available in colour online.
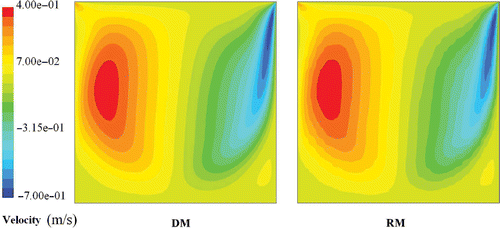
Figure 5. Stream function ψ fields of the DM (left) and the RM n = 8 (right) for Re = 1000. Available in colour online.
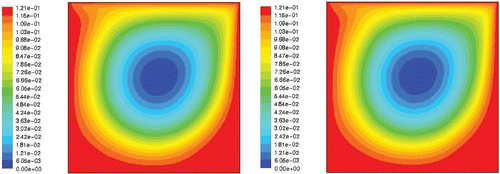
Figure 6. Vorticity ω fields of the DM (left) and the RM n = 8 (right) for Re = 1000. Available in colour online.
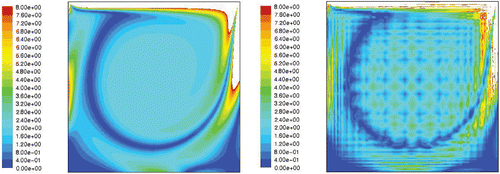
Table 3. Maximal and mean value of the DM velocity field at Re = 1000 and the corresponding errors of the RM n = 8.
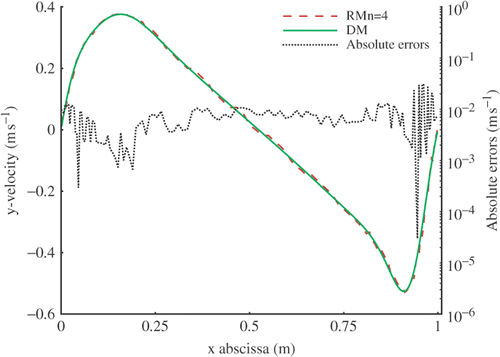
The comparison is also made on two velocity profiles of the flow. compares the components u at x = 0.5d, and compares the components v at y = 0.5d where the absolute differences have been plotted in a logarithm scale for a better reading. It is seen that the results fit well.
Figure 7. Comparison of DM and RM: velocity profiles of u component at x = 0.5d. Available in colour online.
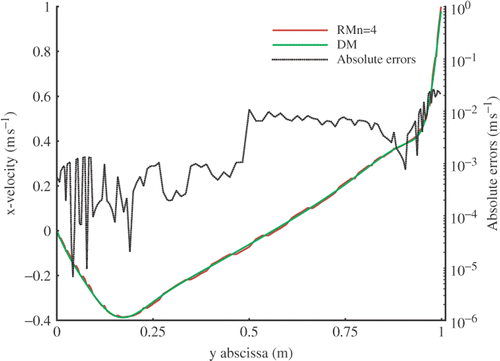
Figure 8. Comparison of DM and RM velocity profiles of v component at y = 0.5d. Available in colour online.
The RM of order n = 8 is then validated as it can reproduce the DM behaviour with accuracy.
Remark
We point out that the CPU time for simulation of the DM with the Fluent® package is about 27.14 s while the same simulation with a RM of order n = 8 is very fast (0.33 s), i.e. the CPU time for reading of the RM parameters is greater than the execution CPU time. Moreover, the steady state velocity fields are obtained through the solution of a steady problem with the RMs while most CFD packages use, in general, a ‘pseudo-transient’ problem to obtain the steady flow field Citation21.
5. Test case 2: pipe flow
5.1. Description and simulations
We consider below a two-dimensional laminar steady fluid flow in a pipe (Re ≤ 2 300). The length and the diameter of the pipe are respectively l = 12 m at d = 0.2 m. The fluid cinematic viscosity is ν = 0.002 m2s−1. Hence, the formulation (12) is used for the RM.
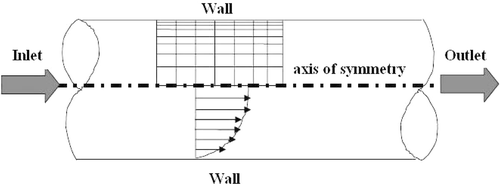
Here again, the DM is obtained with the Fluent® package. Due to the symmetry of the pipe, only an half-pipe is modelled with an exponential mesh (). The number of degrees of freedom of the obtained DM is N = 3511. The boundary conditions are, respectively, an inlet velocity at the entrance of the pipe u∞, an outlet pressure equal to the atmospheric pressure, solid wall and an axis of symmetry (axis of the pipe).
Figure 9. Geometry and mesh of the pipe.
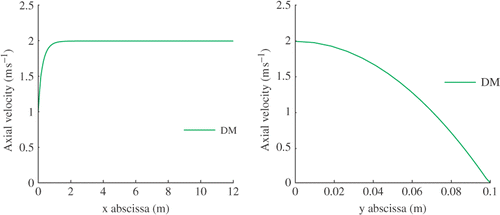
gives the centerline axial velocity of the DM at Re = 100 (u∞ = 1 ms−1). This profile shows that the boundary layer is fully developed around xd = 2 ms−1. This length is in agreement with the length of 2m obtained by using empirical formula Citation22. We observe at the output of the pipe a parabolic profile () which is a characteriztic of a fully developed velocity profile in a pipe.
Figure 10. Centerline axial velocity (left) and axial outlet velocity profile (right) of the DM for Re = 100.
In order to obtain some data about the DM behaviour for the reduction process, the Fluent® package is used again. The DM simulations are performed by using six input velocities which are 0.1, 0.2, 0.5, 0.7, 1 and 1.3 ms−1. These velocities are chosen in order to stay in laminar regime (the maximum Reynolds number of the input velocities is Remax = 1300 < 2300). The obtained stationary fields of the DM are used in the reduction process. shows the magnitude of the identification data where the mean value represents the statistical mean of the data.
Table 4. Maximal and mean velocity value of the identification data in test case 2.
Due to the symmetry of the problem, we will call in this test case, axial velocity to refer to the u component and radial velocity to refer to the v component of the velocity.
5.2. RM identification
presents the results of the identification process. We observe a drastic decrease of the cost function J and the identification errors (ΔMean and ΔMax). A stabilization around the order n = 6 of the RM is also found for J and the corresponding errors. It is found that the identification errors of the RM of order n = 6 are very low when compared to the magnitude of the velocity data (). Hence, we choose to validate the RM of order n = 6.
Table 5. Influence of RM order.
5.3. RM validation
Here, we compare both the RM of order n = 6 and the DM where another inlet velocity is applied. The chosen inlet velocity are 0.4 and 0.8 ms−1 whose corresponding Reynolds numbers are 400 and 800, respectively.
The results of the comparison are reported in and . These tables show that the errors are low when compared to the magnitude of the maximal and mean value of the velocity fields given by the DM.
Table 6. Maximal and mean value of the DM velocity field at Re = 400 and the corresponding errors of the RM n = 6.
Table 7. Maximal and mean value of the DM velocity field at Re = 800 and the corresponding errors of the RM n = 6.
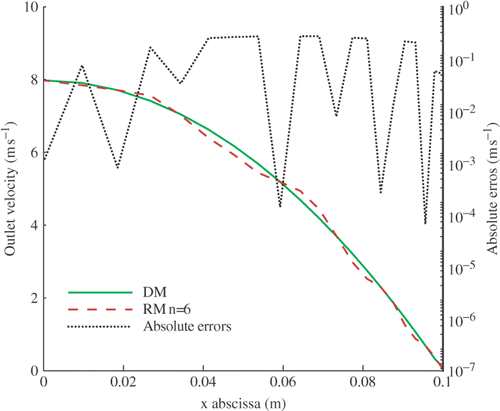
We also compare with and the axial velocity profiles at the centerline (axis of symmetry) and at the outlet of the pipe where the absolute differences are plotted in a logarithm scale. Figures and show an agreement between both the DM and the RM of order n = 6. Hence, the RM of order n = 6 is validated.
Figure 11. Centerline axial velocity profiles of the DM and the RM of order n = 6 for Re = 400.
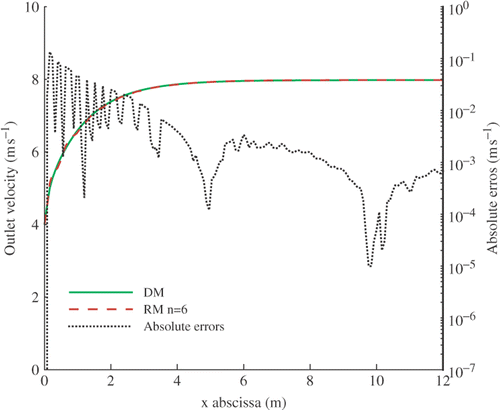
Figure 12. Outlet axial velocity profiles of the DM and the RM of order n = 6 for Re = 400.
6. Conclusion and prospects
In this study, a model reduction was carried out on laminar steady incompressible fluid flows by using an identification technique based on the MIM. Two numerical test cases of laminar steady fluid flows were used to illustrate the method: the lid-driven cavity and the pipe flow. The results of both test cases show that the identified RMs can compute with accuracy the velocity fields of the corresponding fluid flow.
The advantages of such an approach must be underlined:
| • | the velocity fields are computed very quickly with the RM with a quite good accuracy for Reynolds numbers adapted to the construction of RM. | ||||
| • | the non-linearity part is relative to a very small ordered set of equations (RM order) | ||||
| • | the RM is computed by solving a non-linear stationary system while most CFD packages use a non-stationary scheme | ||||
We point out that this reduction process is at present efficient on low Reynolds numbers with simple two-dimensional laminar flows where the velocity fields can be retrieved very accurately. It must now be used on a three-dimensional situation and for more complex fluid flows. The natural extension concerns some turbulent flows where the time-averaged values of the velocity field should be dealt with.
As we are particularly interested in heat transfer by convection, the final purpose is to use such RMs for a temperature control. Therefore, the next step will concern the numerical implementation of control algorithms, leaning on the previously obtained RM, to realize a real thermal controlled system. The control goal can be, for instance to follow prescribed temperatures on several given locations or to minimize (also maximize) heat transfer along some walls. In the framework of boundary control, the control parameters are the boundary conditions of the system, i.e. the velocity for the fluid mechanics point of view and a heat flux or a prescribed temperature for the thermal point of view.
References
- Petit, D, Hachette, R, and Veyret, D, 1997. A modal identification method to reduce a high order model: application to heat conduction modelling, Int. J. Model. Simulation 17 (1997), pp. 242–250.
- Girault, M, and Petit, D, 2005. Identification methods in nonlinear heat conduction, Part I: model reduction, Int. J. Heat Mass Transfer 48 (2005), pp. 105–118.
- Balima, O, Favennec, Y, Girault, M, and Petit, D, 2006. "The modal identification method in non linear heat transfer problems". In: Proceedings 13 International Heat Transfer Conference. Sidney, Australia. 2006.
- Favennec, Y, Girault, M, and Petit, D, 2006. The adjoint method coupled with the modal identification method for nonlinear model reduction, Inverse Prob. Sci. Eng. 14 (2006), pp. 153–170.
- Balima, O, 2006. "Réduction de modéle non linéaire par identification modale: application en thermique et comparaison avec la méthode POD-Galerkin". In: , PhD thesis. France: Université de Poitiers; 2006.
- Petit, D, 1991. "Réduction de modéles de connaissance et identification de modéles d'ordre réduit". In: Application aux processus de diffusion thermique, PhD thesis. France: Université de Provence; 1991.
- Hachette, R, 1995. "Réduction de modéle thermique par identification: utilisation pour des conditionslimites variables". In: Couplage á un modéle détaillé, PhD thesis. France: Institut universitaire des systémes thermiques industriels; 1995.
- Videcoq, E, 1999. "Problémes inverses en diffusion thermique instationnaire: Résolution parreprésentation d'état et apport de la réduction de modéle". In: , PhD thesis. France: Université de Poitiers; 1999.
- Sirovich, L, 1991. Empirical Eigenfunctions and Low Dimensional Systems. Springer-Verlag, New York: New Perspectives in Turbulence; 1991.
- Holmes, P, Lumley, JL, and Berkooz, G, 1996. "Turbulence, Coherent structure". In: Dynamical System and Symetry. New York: Cambridge University Press; 1996.
- Sirovich, L, 1987. Turbulence and the dynamics of coherent structures Part I: coherent structures, Quart. App. Math. 45 (1987), pp. 561–571.
- Balima, O, Favennec, Y, Girault, M, and Petit, D, 2006. Comparison between the modal identification method and the POD-Galerkin method for model reduction in non-linear diffusive systems, Int. J. Num. Methods Eng. 67 (2006), pp. 895–915.
- Sirovich, L, 1987. Turbulence and the dynamics of coherent structures Part II: symetries and Transformations, Quart. Appl. Math. 45 (3) (1987), pp. 573–582.
- Sirovich, L, 1987. Turbulence and the dynamics of coherent structures Part III: dynamics and scaling, Quart. Appl. Math. 45 (1987), pp. 583–590.
- Bergmann, M, 2004. "Optimisation aérodynamique par réduction de modéle POD et contrôle optimal.". In: Application au sillage laminaire d'un cylindre circulaire, PhD thesis. France: Institut National Polytechnique de Lorraine; 2004.
- Cordier, L, 1996. "Etude de systémes dynamiques basés sur la Décomposition Orthogonale auxvaleurs Propres (POD)". In: Application á la couche de mélange turbulente etá l'écoulement entre deux disques contra-rotatifs, PhD thesis. France: Université de Poitiers; 1996.
- Girault, M, Derouineau, S, Salat, J, and Petit, D, 2004. Réduction de modéle en convection naturelle par une méthode d'identification, C. R. Méc. Acad. Sci. 332 (10) (2004), pp. 811–818.
- Roache, P, 1988. Fundamentals of Computational Fluid Dynamics. Albuquerque, New Mexico: Hermosa; 1988.
- Minoux, M, 1986. "Mathematical Programming". In: Theory and Applications. New York: Wiley; 1986.
- Girault, M, 2003. "Résolution de problémes inverses en thermique par modéle réduit: applications en conduction non linéaire et en convection forcée". In: , PhD thesis. France: Université de Poitiers; 2003.
- Erturk, E, Corke, T, and Gokçol, C, 2005. Numerical solutions of 2-d steady incompressible driven cavity flow at highreynolds numbers, Int. J. Num. Methods Fluids 48 (2005), pp. 747–774.
- Incropera, F, and DeWiit, D, 1996. Fondamentals of Heat and Mass Transfer. Vol. 4. New York: Wiley; 1996.