Abstract
In order to reconstruct a system of currents flowing in parallel conductors by processing magnetic field data in the time domain, the positions of the magnetic sensors have to be carefully chosen. In this article, the locations of the sensors are determined so that the imaginary part of the kernel matrix can be neglected. The reconstruction errors given by the approximated model are investigated both in a periodic regime and in a transient state, which are typical, respectively, of over-load and short-circuit conditions in power systems.
1. Introduction
As the demand for power monitoring and protection increases, current measurement techniques must be faster, more accurate and of wider range both in frequency and in amplitude. To this aim, magnetic sensor arrays have been proposed Citation1–4. In references Citation1–3, a least squares inversion of magnetic field data in the frequency domain is applied for the measurement of periodic currents. According to this method, the currents under measurement can be reconstructed only after at least one period, applying Fourier analysis. In order to reconstruct the currents faster, the instantaneous values of the currents must be obtained by sampling the instantaneous values of the magnetic fields. In this article, a current measurement model in the time domain is presented and the corresponding error estimated.
2. Approximate model in the time domain
In AC regime, due to the effects of eddy currents, a phase difference exists between the magnetic field at a given point in the free space near a current carrying conductor and the electric current. This phase shift is frequency and spatially dependent. The measurement model proposed in reference Citation2 at a given frequency reads:
(1)
where
is the vector of the phasors of the voltage output signals of the N sensors and
is the vector of the phasors of the P currents. The N × P coefficient matrix C is made of complex numbers and, due to the eddy current phenomena in the conductors, Cim, in general, cannot be neglected. If a sensor array configuration exists for which the entries of Cim are negligible with respect to the corresponding entries of Cre, then model (1) can be simplified as
, so that the relationship between the measured voltages and reconstructed currents at every instant of time can be written as:
(2)
Following the same approach as in references Citation1–3, the currents can be then reconstructed at any instant of time by the least squares algorithm using the normal equation:
(3)
3. Choice of the sensor positions
In order to describe the method, a three-phase bus bar system made of copper, with conductivity and permeability
, is considered. For the sake of simplicity, the orientations of the sensors are taken to be parallel to the x-axis. Since we are interested in the measurements of 50 Hz components of the current and of the odd harmonics at 150 and 250 Hz, with the help of a finite element method (FEM) analysis and a commercial software Citation5, a region W is determined, where the following condition is fulfilled at frequencies of 50, 150 and 250 Hz ():
(4)
Figure 1. Condition (4) is satisfied at the regions: (a) at 50 Hz, (b) at 150 Hz, (c) at 250 Hz.
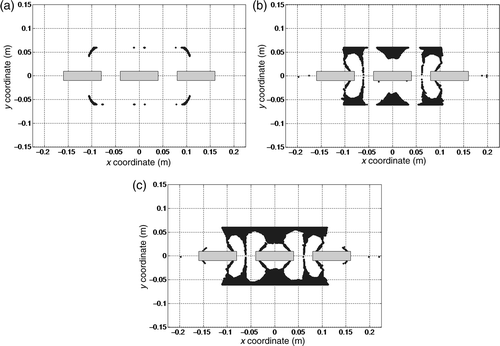
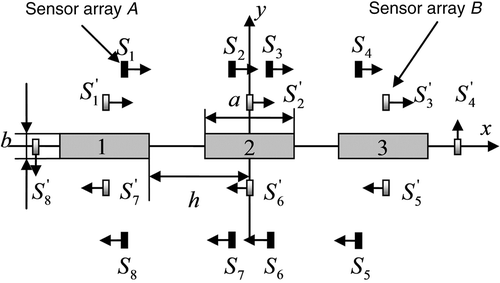
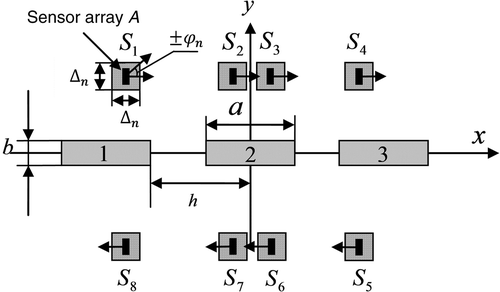
The FEM mesh is composed by 60,670 triangles and the required memory is 540 MB. As it can be noted, the region represented in is included in regions of , so that the represented region of is chosen to be region W. Eight magnetic sensors are then placed in W, forming the array A, as reported in . For comparison, another sensor array configuration (array B) is taken into account. For sensor array A, the matrix in (3), when calculated at 50 Hz, has a condition number equal to 6.48 and is inverted by means of Gaussian elimination.
Figure 2. The three phase rectangular conductor system with the proposed configuration for the sensor array. Arrows indicate the sensitivity directions of the sensors. Geometrical dimensions are a = 80 mm, b = 20 mm and h = 80 mm. Sensor coordinates (in mm) of array A are: S1 = (−94, 60), S2 = (−11, 60), S3 = (11, 60), S4 = (94, 60), S5 = (94, −60), S6 = (11, −60), S7 = (−11, −60) and S8 = (−94, −60). Sensor coordinates (in mm) of array B are: = (−120, 15),
= (0, 15),
(120, 15),
(190, 0),
(120, −15),
(0, −15),
= (−120, −15) and
(−190, 0).
In order to validate the method, since the third and the fifth harmonic components are typical of over-load conditions, the following three-phase balanced current system is considered:
(5)
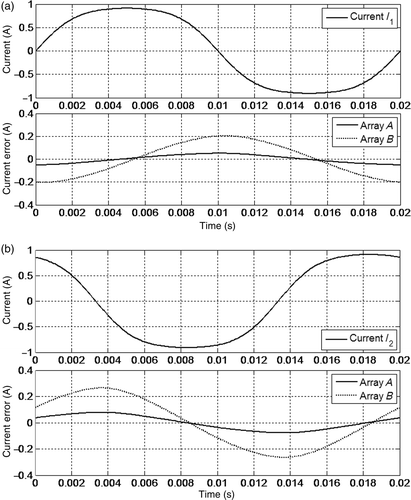
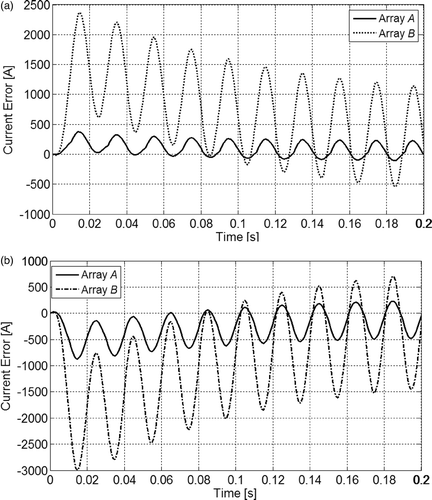
The waveforms of currents I1 and I2 and the corresponding reconstruction errors of arrays A and B are represented in . Considering the symmetry of the geometry under study, the reconstruction error for current I3 of both arrays A and B is the same as that of current I1 and not plotted.
Figure 3. Current waveforms and corresponding reconstruction errors of sensor arrays A and B: (a) for current I1 and (b) for current I2.
4. Error estimation
At a given frequency, the relationship between the phasors of the reconstructed currents and those of the actual ones is given by:
(6)
so that the reconstruction error can be written as:
(7)
where
and 1 is the identity matrix.
It can be easily shown that the real components of E are zero. In the case of sensor array A, the matrix E at 50 Hz (indicated with ) is given by:
(8)
Since the matrix is diagonally dominant, the reconstruction error of one current, e.g.
, can be estimated in the following way. Noting that:
(9)
since
and
, (9) can be approximated as:
(10)
so that
(11)
Similar expressions hold for .
Since the 50 Hz harmonic has to be reconstructed when high order harmonics are present (as in the case of currents in (5)), in general Cre at 50 Hz is different from Cre calculated at higher frequencies. In the case of array A, at a given frequency (e.g. 150 Hz) these differences can be described by defining a matrix with entries given by:
(12)
At 150 Hz, we obtain:
(13)
and at 250 Hz, we have:
(14)
The corresponding estimated error matrices and
are given by:
(15)
(16)
5. Transient case
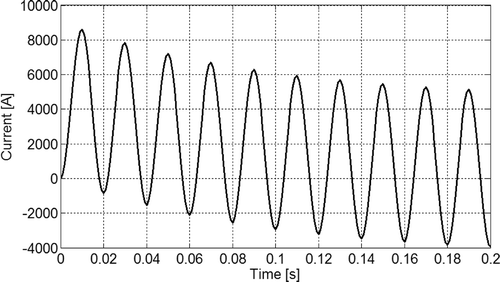
In order to investigate the performance of the proposed approximate method for the measurement of transient currents, the following system of transient currents () is imposed in the three conductors Citation6:
(17)
(18)
where In is the rated effective current value, ω the angular frequency, θ the angle of the voltage wave at which the fault occurs, R and X the real and imaginary parts of the network impedance at the fault location. In the following simulations, In = 3200 A, θ = 0,
= 30 and f = 50 Hz.
Figure 4. Current waveform of I(t) in (18).
The chosen positions of the sensors of array A guarantee much lower errors than those of array B, as can be seen from .
Figure 5. Reconstruction errors using sensor arrays A and B: (a) for current I1 and (b) for current I2.
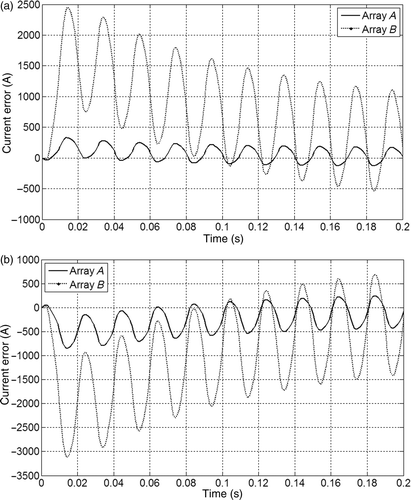
Considering the presence of current harmonics, a new system of transient currents is imposed in the three rectangular conductors in the same way as in (17):
(19)
with the same parameters as in (18). The new current waveform is represented in and reconstruction errors in .
Figure 6. Current waveform of in (19).
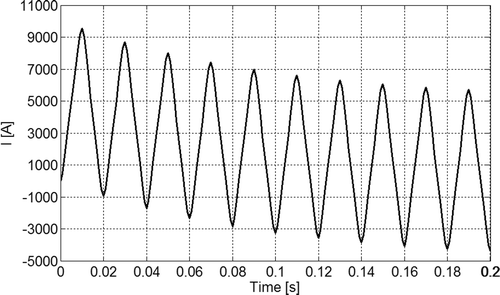
Figure 7. Reconstruction errors using sensor arrays A and B: (a) for current , (b) for current
.
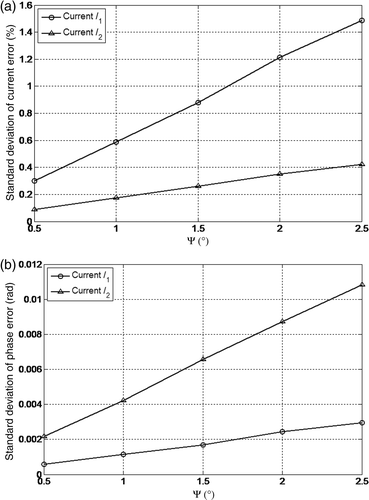
6. Robustness analysis
When positioning magnetic sensors, geometrical tolerances have to be taken into account. To estimate the robustness of the sensor array to these tolerances, the position of each sensor is considered as statistically uniformly distributed inside a square with the side length equal to , and the orientation is uniformly distributed in the interval [
,
]
(), so that repeated simulations following a Monte Carlo approach can be carried out.
Figure 8. Three rectangular conductors system, where a = 80 mm, b = 20 mm, c = 4 mm and h = 80 mm. All the possible positions of the sensors are restricted inside a square with side length equal to . The orientation deviation for each sensor is not more than
.
Corresponding to the actual and theoretical sensor locations, the sensor outputs can be written as:
(20)
(21)
where
and
are the phasors of actual and theoretical sensors outputs and Cact and Cth are the corresponding coefficient matrices.
When the theoretical coefficient matrix Cth and the actual sensor signals are used to reconstruct the currents, the latter are given by:
(22)
If given by (20) is substituted into (22), the relationship between the true and reconstructed currents can be derived:
(23)
According to the approximate method, Cth is substituted by Cre, so that (23) is written as:
(24)
The current error for the pth current is defined as
(25)
where
and
.
The phase error for the pth current is defined as
(26)
where
and
.
In order to carry out Monte Carlo simulations, a balanced three-phase system of currents at frequency f = 50 Hz is considered: . In the simulations,
varies from 0.5 to 2.5 mm and
varies from 0.5° to 2.5°. The standard deviations of the current amplitude and phase errors are obtained by means of 1000 Monte Carlo simulations ( and ).
Figure 9. Standard deviation of (a) current and (b) phase errors when sensor positions vary from 0.5 to 2.5 mm.
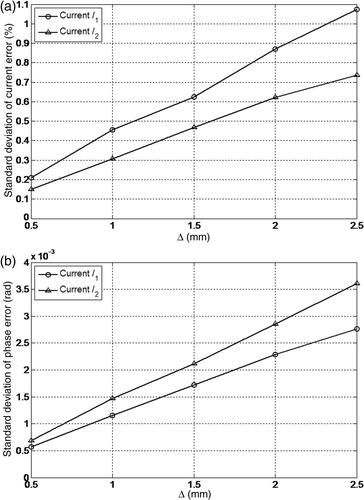
Figure 10. Standard deviation of (a) current and (b) phase errors when sensor orientations vary from 0.5° to 2.5°.
7. Conclusions
The proposed method of current measurement in the time domain based on the inversion of magnetic sensor data is proven to give reasonable accuracy for protection applications and to be robust enough to perturbations in sensor locations. The accuracy of the technique has been investigated both for the case of periodic and transient currents.
References
- D’Antona, G, Di Rienzo, L, Ottoboni, R, and Manara, A, 2001. Processing magnetic sensor array data for AC current measurement in multiconductor systems, IEEE Trans. Instrum. Meas. 50 (2001), pp. 1289–1295.
- Di Rienzo, L, and Zhang, Z, 2010. Spatial harmonic expansion for use with magnetic sensor arrays, IEEE Trans. Magn. 46 (2010), pp. 53–58.
- Zhang, Z, and Di Rienzo, L, 2009. Optimization of magnetic sensor arrays for current measurement based on swarm intelligence and D-optimality, COMPEL-Int. J. Comput. Math. Elec. 28 (2009), pp. 1179–1190.
- Msaed, A, Chadebec, O, and Delamare, J, 2009. A simple and accurate magnetic gradient sensor configuration dedicated to electrical currents measurements, Sensor Lett. 7 (2009), pp. 1–6.
- Maxwell 2D v. 11, Ansoft Corporation, 1984–2006. [Online] Available at: http://www.ansoft.com.
- Garzon, RD, 1997. High Voltage Circuit Breakers: Design and Applications. New York: Marcel Dekker; 1997.