
 ?Mathematical formulae have been encoded as MathML and are displayed in this HTML version using MathJax in order to improve their display. Uncheck the box to turn MathJax off. This feature requires Javascript. Click on a formula to zoom.
ABSTRACT
Agglomeration externalities are generally credited as the prime cause of cluster formation. This theory is far from uncontroversial. We create an alternative perspective on clustering by integrating herd behaviour into the conceptualization of this process. An innovative agent-based model is used in which cluster formation is constructed from individual relocation decisions. It thus connects individual relocation decisions to macro-level emergent patterns and shows that imitation has the potential to severely exacerbate the effects of agglomeration economies on clustering on an urban scale. The outcomes of this model challenge the dominant neoclassical view on clustering. An alternative hypothesis is postulated in which the interaction between herd behaviour and agglomeration externalities is proposed as an explanation for cluster formation.
INTRODUCTION
The analysis of both relocation decisions and the spatial distribution of companies have been pivotal topics in economic geography. Existing research often presupposes that relocation decisions are made fully rationally, but deciding managers often exhibit non-economic and non-rational behaviour (Boschma & Frenken, Citation2006; Townroe, Citation1991). Decision-makers are boundedly rational: they lack information about the multitude of options, as well as the capacity to accurately process this information.
Instead of rational analysis, decisions are often based on decision-making shortcuts such as risk aversion, inertia and imitation, which we will discuss in detail below. Conformation to the norm is the default, as John Maynard Keynes famously wrote: ‘it is better to fail conventionally than to succeed unconventionally’ (Keynes, Citation1936, §12.5). Because economic geography often assumes an analytical rigour which decision-makers in practice do not have, more complex decision strategies remain relatively under-researched, though some more behaviourally inclined researchers have presented alternative theories which do consider the psychological factors behind relocation decisions (Berg, Citation2014; Suire & Vicente, Citation2008).
Traditional lines of research have uncovered many key factors for the location decisions of companies, either by asking companies directly or by analysis of the observed pattern that results from these decisions. Agglomeration and particularly knowledge spillovers seldom feature in the decision behind individual moves (e.g., Armstrong & Taylor, Citation2000; Pellenbarg et al., Citation2005). Despite the apparent unimportance of agglomeration in an individual relocation, it can create a cumulative effect in attracting others, so that over time an area experiences clustering. However, the connection between individual relocation decisions and aggregate spatial patterns is obfuscated by the complicated interrelationship between initial preferences, observed behaviour, existing spatial patterns and the effect of time.
This paper contributes to the unravelling of this process by looking at clustering from a decision-making perspective. The dominant geographical paradigm uses the assumption of fully rational decision-making to infer that agglomeration must have specific benefits because agglomeration occurs. We set up an agent-based model (ABM) to challenge this perspective by including elements of bounded rationality. Our goal is to assess whether boundedly rational strategies of decision-making, specifically herd behaviour, could play a role in the formation of sectoral, spatial clusters. Understanding why clusters form is a topic with wide societal relevance because regional governments are often eager to create a sectoral cluster within their region. However, policymakers have been markedly unsuccessful in creating thriving clusters (Graf & Broekel, Citation2020). Understanding why clusters form and role of decision-making strategies in this can help regional governments in their decision of whether to pursue the creation of a regional cluster.
In this study, we broaden the perspective on company relocations by introducing the concept of herd behaviour from behavioural theory as an alternative explanation for cluster formation. We ask the question whether herd behaviour can produce similar results as agglomeration economies. To that end, we incorporate decision-making strategies under bounded rationality and uncertainty into the body of research regarding firm relocation and clustering.
We employ an ABM to simulate the location choice process. This is a useful method to describe and explore interactions between individual behaviour and aggregate macro-level patterns, especially in complex social systems (Ajraldi et al., Citation2011; Bonabeau, Citation2002; Zhao et al., Citation2011). In ABM, the researcher programmes individual behaviour and explores the impact it has on macro-level patterns. Major benefits of ABM are: first, that it allows for an easy exploration of the dynamics of a system without the necessity of an elaborate empirical study. It creates a laboratory-like setting in which experiments can be replicated. Second, it allows for a comprehensible representation of complex systems in which decision-making processes and emergent phenomena become evident. Of course, any model is an oversimplification of reality, and our results will indicate what is possible rather than what is true in the real world.
Our ABM shows that the omission of decision-making strategies such as herd behaviour from the analysis of sectoral, spatial clusters can lead to a severe overestimation of the importance of agglomeration effects. Even though herd behaviour itself does not cause large clusters (it is counter-balanced by rising prices), herd behaviour as a relocation strategy creates a strong positive feedback loop with agglomeration economies, even if these agglomeration economies are rather small. If companies attach some but limited value to agglomeration economies and incorporate herd behaviour into their strategy of decision-making, it is very likely that a strong cluster will emerge in our model.
CONCEPTUAL FRAMEWORK
Traditionally, clustering is explained as a rational economic choice: either the location itself provides benefits or the existing concentration of firms on a particular site makes it attractive (Malmberg & Maskell, Citation2002). Empirically, the underlying location choice is observed either through colocation patterns (van Diodato et al., Citation2018; Ellison et al., Citation2007; van Dijk & Pellenbarg, Citation2000) or by stated preference research (Elgar et al., Citation2009; Willigers & van Wee, Citation2011).
The exact nature of these agglomeration has been widely discussed since Marshall (Citation1890), with a strong focus on the contrast between the effects of sectoral concentration and intersectoral diversity. Marshall’s name is usually attached to within-sector clustering, and Jane Jacobs’ usually to the diversity argument (Beaudry & Schiffauerova, Citation2009), and efforts have been made to bring the opposing sides together (Caragliu et al., Citation2016; Frenken et al., Citation2007).
Agglomeration, on the other hand, also leads to negative externalities. Congestion in transportation, but also competition on labour and land markets, mean hotspots of activity can also become too ‘hot’ for less profitable firms. For example, more mature firms tend to need more space to increase production, but they no longer depend on knowledge spillovers and fast innovation (Duranton & Puga, Citation2001).
Decision-making processes
Neoclassical economists and economic geographers have modelled the decision process as a weighted outcome of different factors inside and outside of the firm, starting with the paradigms of Weber (Citation1909) and Hotelling (Citation1929). Firm-specific characteristics, such as age, size and current or expected growth, impact relocation decisions (de Bok & van Oort, Citation2011; Nguyen et al., Citation2013), but the local availability of resources (labour, capital, material inputs) and the accessibility to resources from elsewhere are generally the main focus of research. Demand for areas rich in resources increases both the land and labour costs in these locations, creating an equilibrium situation (Nguyen et al., Citation2013; van Dijk & Pellenbarg, Citation2000). There are frictions, though, since relocations entail additional costs, such as the potential loss of staff. These have to be compensated by the difference in profitability between the new and old location (Brouwer et al., Citation2004; van Dijk & Pellenbarg, Citation2000).
The neoclassical economic approach to corporate decision-making has the problem that it does not reveal the internal decision-making mechanisms of firms: decisions are assumed to be questions of rational optimization (Boschma & Frenken, Citation2006). Within the standard assumption of economic theory, a perfectly rational, well-informed economic agent would evaluate all possible paths of action on the effect that they have on a clear set of defined company goals (typically profits) and then choose the one with the highest rewards (Baddeley, Citation2010; Cohen et al., Citation1976; Cyert & Hedrick, Citation1972; Simon, Citation1955). Other branches of the economic discipline challenge this way of thinking; in particular, behavioural theory has less rigid assumptions and does not presuppose rationality, complete information, and profit maximization strategies (Armstrong & Huck, Citation2010).
In this paper, we distinguish several characteristics of firm decision-making processes that deviate from standard rational economic theory, and which are foundational for the decision model we present. These characteristics can be considered facets of the boundedly rational nature of economic decision-makers (cf. Simon, Citation2013).
Myopia: decision-makers overly focus on the short term, potentially to the detriment of long-term interests (Edmans, Citation2009; Iqbal et al., Citation2021; Larwood & Whittaker, Citation1977; Stein, Citation1988).
Satisficing: decision-makers are satisficers and not optimizers. They do not look for the best possible decision, but instead accept any option that satisfies all economic and non-economic demands (Armstrong & Huck, Citation2010; Berg, Citation2014).
Lack of rigour: decision-makers do not conduct a rigorous probabilistic analysis. Instead, they review a small number of potential actions and decide based on their experience and intuition (Lejarraga & Martinez-Ros, Citation2008; Slovic et al., Citation2004).
Risk aversion: decision-makers are wary of taking risks. They may be judged for an unfortunate outcome, even if that particular outcome was initially unlikely to occur. Deciders might, therefore, opt for a ‘safe’ decision over a more profitable decision with a higher risk (Milidonis & Stathopoulos, Citation2014).
Inertia: decision-makers consider the current practice the default option. They do not consider new possible courses of action if the current way of doing things still works satisfactorily, and have an internal predisposition towards ‘doing things the way they are always done’ (Alós-Ferrer et al., Citation2016; Kaplan & Henderson, Citation2005; van Witteloostuijn, Citation1998).
These five facets of boundedly rational decision-making affect relocation choices in ways which are not always acknowledged in neoclassical theories. These effects can be grouped into two types: whether to move and where to move. The crucial effect of decision-making psychology on relocation decisions is the desire to stay put (van Dijk & Pellenbarg, Citation2000), as a product of myopia, inertia and risk aversion. If a company does decide to move, its location choice will not be the product of rigorous optimization but rather a satisfactory new location chosen on experience and intuition (Berg, Citation2014). As a result of myopia and risk aversion, the new location will probably be relatively close the former location (de Bok & van Oort, Citation2011; Elgar et al., Citation2009).
We will explicitly include myopia, the lack of rigour and inertia in our model. Satisficing is most easily taken together with a lack of rigour by limiting the options in our model. The key element in our model is herd behaviour which can be conceptualized as a product of a combination of these decision-making characteristics, most prominently risk aversion.
Herd behaviour
Corporate decisions are not made in isolation: the behaviour of other firms might affect decision-making. Herd behaviour is defined by Baddeley (Citation2010) as ‘the phenomenon of individuals deciding to follow others and imitating group behaviours rather than deciding independently and atomistically on the basis of their own, private information’ (p. 281). Decision-makers might infer from the actions of others which decisions are smart (Baddeley, Citation2010; Banerjee, Citation1992; Bikhchandani et al., Citation1998; Minniti, Citation2005). Herd behaviour is therefore not only possible but also expected in corporate contexts, especially in decisions which involve many complex and heterogeneous options.
Early theorists, such as Banerjee (Citation1992) and Bikhchandani et al. (Citation1998), show how limited information supply and sequential decision-making can logically lead to herd behaviour. They show that herd behaviour emerges, and is even rational, when the probability of making a right decision – thus avoiding risks – is higher if one does what everyone else does, compared with following one’s own information. Many other researchers have shown empirically that herd behaviour plays a role in a wide range of economic decisions (Cipriani & Guarino, Citation2009; Koetsier & Bikker, Citation2017; Luo & Lin, Citation2013; Seiler et al., Citation2014), including location choice (Berg, Citation2014; Suire & Vicente, Citation2008; Vicente & Suire, Citation2007).
However, the utility of herd behaviour decreases according to the share of agents engaged in it (Banerjee, Citation1992; Bikhchandani et al., Citation1998; Lux, Citation1995). This can sometimes, but not necessarily, lead to a more volatile long-term outcome, and the formation of economic bubbles (Lux, Citation1995; Suire & Vicente, Citation2008; Zhao et al., Citation2011). A factor that further complicates matters is the imperfection of herd behaviour itself: imitative behaviour is similar, but rarely identical (Posen et al., Citation2013). Indeed, humans often take the wrong lessons from observing others. Weizsäcker (Citation2010) finds that ‘in situations where the evidence conveyed by others’ choice is less clear, the information is not only less valuable, but the participants are disproportionately worse in making the correct inferences’ (p. 2357). As a result, even if imitation is theoretically justified, agents always appreciate their own information. Herding behaviour is thus often not blindly following others, but a comparison of one’s own information with others’ actions (Cipriani & Guarino, Citation2009). An agent’s decision is structurally formed by the decisions that others have made before them, especially in a complex decision-making landscape; if not for the positive impact signalled by others’ decision, then for the way these shape an agent's perspective on the possible options.
The literature on the impact of herd behaviour on location choice is currently rather limited,Footnote1 though some studies reflect on its relevance. These can be classified into two lines of reasoning. The first, proposed by Berg (Citation2014), says that firms exhibit herd behaviour in the sense that they are more likely to know about and look for possible sites near other companies in their sector. Other locations without a presence of related companies are much less likely to be even considered, regardless of their qualities. In fact, Berg finds that 84% of companies engage in this type of herd behaviour in their relocation search. The second line of reasoning is put forward by Suire and Vicente in several articles (Suire & Vicente, Citation2008; Vicente et al., Citation2007; Vicente & Suire, Citation2007). It revolves around the idea of the ‘locational norm’. This means that a location can become the default location in a certain sector. In such a situation deviation from the norm is considered a strategic risk. Companies then infer that the norm location is optimal because so many other companies are already there. Besides, customers and business partners may then use the firm’s location as a proxy for its quality. Part of this effect runs through prices of land and real estate: if a company is in an expensive location, it must be successful and good (Ding et al., Citation2010).
Herd behaviour has the potential to play a large role in relocation decisions because location choice is a sequential, cumulative decision-making process, where the possible outcomes are heterogenous, the decision is complex, and the decision-makers have limited information (Berg, Citation2014; Brunes, Citation2005; Elgar et al., Citation2009).
Complex adaptive systems
The agglomeration literature traditionally focuses on the interaction between behaviour at the micro-level (‘microfoundations’) and outcomes at the macro-level (Rosenthal & Strange, Citation2004). There is also a strong system approach in the innovation literature (regional innovation systems; cf. Braczyk et al., Citation2004; Isaksen et al., Citation2018). Given this multilevel problem of interactions, we are looking ‘almost by definition’ (Martellato, Citation1998, p. 439) at a complex system.
Complexity in economics focuses in particular on one of the weakest spots in classical economics: that of equilibrium modelling, focusing instead on so-called ‘adaptive’ systems (Miller & Page, Citation2007), in line with evolutionary economic thinking (Elsner, Citation2017). Instead, agent-based perspectives are the norm, as is bounded rationality (Arthur, Citation2021). Arthur (Citation2021) even writes that ‘one could regard complexity economics as a conceptual foundation behind agent-based economic modelling’ (p. 139).
Still, the rapidly growing toolbox of complexity studies has seen only few applications in the field of agglomeration studies (e.g., Wernberg, Citation2017). The complexity of knowledge and product networks is one angle (Balland et al., Citation2019; Gao et al., Citation2021); the other, in our opinion, is formed by studies based on ABM (Boeing, Citation2018; Marini et al., Citation2019; Spencer, Citation2012).
Demarcation and limitations
The concepts described in the sections above all come together in one system: that of relocation decisions. The action we review in the current study is whether companies move and why. The model we present only reflects this process and is not suitable for interpretations outside of this scope.
The agents (companies) in this system decide using a process which may result in an action (relocation). The manner in which companies decide is often not a question of probabilistic optimization of returns, but rather a narrow search towards a satisfactory result. This means that companies may use a simple economic approach to evaluate the satisfaction with certain location, but also use elementary psychological short-cuts to make the decision-process easier, aggravated by their inability to accurate assess the full economic effects of their decision.
The decision is impacted by the environment. This can be thought of as containing three key elements: real estate prices, the spatial distribution of companies and the inherent quality of places regardless of price and distribution of companies. The latter category comprises most of the classical location choice factors – but they are grouped because they do not change due to the process under review. With respect to the other categories there is an interaction with the system of this study. Prices rise with the popularity of places: a place with high demand would have higher prices. The interaction between distribution of companies and agglomeration can be understood from two angles: from the perspective of agglomeration externalities the presence of existing companies enhances the attractiveness for new companies. Alternatively, herd behaviour may cause companies to be disproportionately interested in places where other companies have located. As such relocation decision both affect and are affected by the distribution of companies. The processes of herd behaviour and agglomeration are methodically strictly separated in this study.
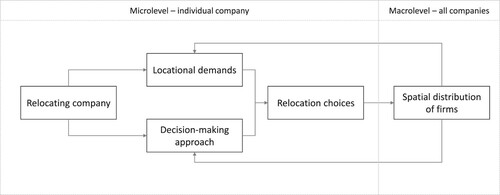
Although the output of this model is at the individual level a relocation decision, on the aggregate level the system outputs a distribution of companies. shows the relationship between the micro- and the macro-level. In the next chapter the modelling of this system will be described using an ABM.
Figure 1. Overall conceptual model.
AN AGENT-BASED MODEL
We set up an ABM to simulate the behaviour of individual firms, approaching it as a complex system. ABMs focus on exploring the dynamics between micro and macro-level behaviour, or individual and system-level behaviour (Wilensky & Rand, Citation2015).
As with any model, the ABM used here is a simplified and stylized version of reality. Thus, it requires several fundamental assumptions. shows our basic set-up, in three phases: selection, evaluation and decision.
Figure 2. Three-phase decision model.

These three phases are defined using both the behavioural and neoclassical insights about the way location choice works. In the selection phase companies search for potential new locations, which are called targets in this study. They form a consideration set of a number of locations to investigate. This is the phase in which herd behaviour can occur. In the evaluation phase, the targets are evaluated on the locational characteristics. This is a behaviourally constrained neoclassical optimization. The third phase is the decision. In this phase, the company decides whether it stays put or moves to the best location from the evaluation phase. This three-phase model is a stylized adaption of the phasing models of Townroe (Citation1973) and Louw (Citation1996), using behavioural concepts from Berg’s (Citation2014) description of the location choice process. Even though selection, evaluation and decision happen in reality, they are neither distinct not consecutive. Decision-making is a flexible and iterative process, which does not happen in a fixed and structured manner. This is exactly the property of the system that makes it hard to predict and standardize. The three-phase model is a simple and comprehensible way to approximate the decision-making process using basic behavioural rules, which can be algorithmically defined. The three-phase model provides simplicity and clarity while also maintaining a stylized form of real-life location choice. Four assumptions deserve a brief discussion.
Our three-phase model has the Markov property, meaning the probability of each possible event depends solely on the current state of the system (Privault, Citation2013; cf. Olsson & Gale, Citation1968, for an application in regional science). This means that only the current distribution of firms affects the relocation decision in this model. Path dependency implies that past and future situations are of little impact on a company’s decision and the options of each agent are therefore directly shaped by the current state of the system. In general, assuming ‘memorylessness’ may not be truthful, but it is a reasonable and useful assumption.Footnote2
The model presented here is structured in consecutive procedures. In reality, decision-making happens in a process that is much more erratic, iterative, and parallel. Companies do not follow a strictly ordered decision-making approach and they decide in parallel with other companies. Yet, like other models, ABMs function properly when they consist of few and simple rules. It is, therefore, crucial to reduce the chaos in real-life situations to a few comprehensible structured concepts, which still describe the essence of the real-world system. However, at many points during the model elements of chaos are introduced to mimic the effects of the chaotic process in the real world.
The model is unidimensional and static. Because simplicity is of the essence in ABM, everything that is not immediately pertinent to the core process of the model is reduced to a rudimentary object. This means that we model both the agents and the environment in such a manner that they reflect real-life situations to the minimal degree that is necessary. For example, we keep static the number of companies: no companies exit and enter. This simplification leaves out an important cause of industrial development (Klepper, Citation2010). However, such developments are outside of our focus on the dynamics of herd behaviour.
Stochasticity or randomness is very common in ABM, making them less deterministic and open to multiple outcomes. Stochasticity is also associated with bounded rationality, since non-rational decision-making does not follow a strictly logical course. Stochasticity is introduced in the model to signal events happening by random chance, internal variation, chaotic decision-making, and erring. Note that it partly compensates for the variation which has been removed from the model under the other assumptions.
Narrative description
To compare herding in the selection phase to agglomeration in the evaluation phase, we run four versions of the model: a base scenario without either herding or agglomeration, a model with agglomeration externalities, a model with herd behaviour, and a model with both. The models run in Netlogo 6.1.1. For the full model code, see Appendix B in the supplemental data online.
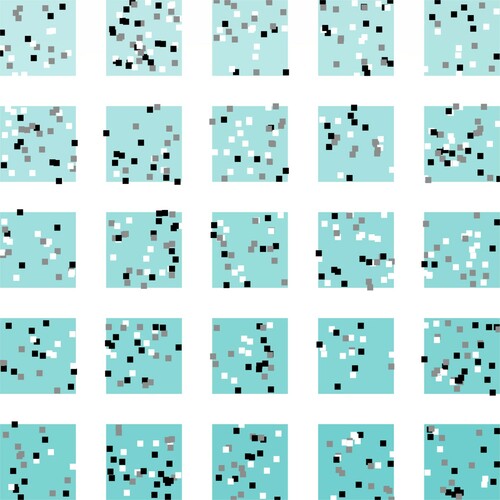
Our model represents one urban area consisting of 25 office parks, totalling 625 patches (the Netlogo units of space). It is schematically visualized as 5 × 5 grid (). We assume that the position of a patch in the city and the distance to other work locations is irrelevant. Each patch has three properties regarding its quality as a business location: attractiveness, price and agglomeration.
Figure 3. Initial situation of the companies and environment.
The attractiveness property denotes all exogenous factors shaping location choice that do not depend directly on the distribution of firms. In our model, these exogenous variables are considered fixed in time, and we group them into one container to obtain an aggregate measure of ex-ante locational quality. This is the attractiveness of a location if no other firms would exist. The attractiveness varies from office park to office park.
The other two properties are endogenous to the model. Agglomeration is a characteristic of each patch for each sector. It measures the number of companies of a given sector in its vicinity. This means that agglomeration externalities in this model are localization and not diversity economies – they depend on same-sector companies only, with no cross-sector Jacobs externalities. For simplicity, we chose to include just one type of agglomeration externality, but it can be interpreted as any kind of colocation with firms of a ‘preferred’ type, whether these are from the same sector, from a radically different sector or from a ‘related’ sector (Content & Frenken, Citation2016).
Prices are set using a supply-and-demand approach, in which more popular places are more expensive. This measure does not attempt to reflect actual market dynamics, but is a simple way to address the fact that high levels of occupation signify high demand and thus higher land values. We deliberately choose not to impose a maximum occupation for each single patch because building higher, denser and smaller can increase the number of available workplaces nearly indefinitely (Koster et al., Citation2014).
In order to compare the patches among each other, scores are developed for each of the three characteristics. Patches are scored relative to one another. In this manner, each patch has a location in a cell and three attributes: an unchanging value for attractiveness, a price that changes over time, and an agglomeration metric that changes over time and according to the sector of the choosing company.
Actors
Within this environment, companies choose their location on one of the patches. The model includes two companies for each patch, 1250 in total. These companies are defined as simple behavioural agents with one specific function: relocation. Firms have no size or growth. There are three undifferentiated, identical sectors.
The choice to have identical sectors is deliberate; it is a way to model conservatively. If any sectoral segregation appears in the distribution of firms, this happens despite the sectors having identical demands; in a situation with sectoral differences, these patterns would be even stronger. Also, for reasons of conservativeness, companies start in the least ordered way possible: they get assigned random locations as a starting point. In the real world, this is of course not the case.
All agents have the same simple behavioural strategies for location choice, but they have several firm-specific variables which introduce variation into the stock of companies: companies value different locational characteristics differently, without variation over time. These deviations are dubbed sensitivities.
Companies also have a random propensity to move: the size of the qualitative difference between a potential new location and the current location necessary to justify moving: an expression of the costs associated with moving and inertia in decision-making. Just like in real life (de Bok & van Oort, Citation2011; Nguyen et al., Citation2013) this threshold can vary quite strongly among companies.
Choice model
The choice model consists of three distinct phases: selection, evaluation and decision.
The assumption behind the selection phase is that companies do not consider all available locations. Instead, they form a consideration set, which is a subset of all available locations. This idea is not only commonsensical but also substantiated by academic research (Berg, Citation2014; van Dijk & Pellenbarg, Citation2000). In this model companies thus only review a small number of locations. Berg (Citation2014) finds that in this case study entrepreneurs have a modal consideration set of three. This figure is adopted in this study.
What determines which locations make it into the consideration set, is a complicated issue and dependent on a multitude of commercial, geographical and personal factors. Companies seldom perform an elaborate search routine (Berg, Citation2014; Elgar & Miller, Citation2009; van Dijk & Pellenbarg, Citation2000). Instead, at least on the local level, ‘a surprising number of business locations are apparently discovered by chance, while entrepreneurs are involved with unrelated business activities or during leisure time’ (Berg, Citation2014, p. 1700). Consequently, the formation of the consideration set is assumed to be a random selection. This is to say, the process of target selection is so erratic and unpredictable that it may as well be random. The smaller the geographical scale level, the truer this assumption becomes. Alternatively, herd behaviour might impact target selection. Herd behaviour can be a factor in the selection phase because companies are likely to look for and/or to encounter an available location in a place they know is used in their sector (Berg, Citation2014; Vicente & Suire, Citation2007). Herd behaviour increases the probability that locations are considered according to the number of related companies in the area, regardless of the qualities of that place. Herd behaviour is thus strictly separated from any agglomeration externalities.
The selection of targets can happen in two ways. Either a company picks a random patch (random selection) or it picks a random other company from the same sector and then picks a random location within two patches of that company (herd behaviour). In the first situation, all patches have an equal probability of being considered. In the second situation, the probability depends on the number of companies from a given sector in the vicinity.
In the model four scenarios of selection are used: all three targets being selected at random, all targets being selected using herd behaviour, or one or two targets being selected using herd behaviour and the rest at random. In this model, we investigate all these scenarios. We call them h0 (no herding behaviour), h1, etc. Thus, in scenario h1, one of the three targets is selected using herd behaviour, while the other two are selected at random.
The evaluation phase consists of a rational and analytical optimization based on a select few criteria. The core of the evaluation phase thus stems from neoclassical theory, but in a constrained manner: the number of both options and criteria is small. This crucial phase of the model is thus a behaviourally constrained neoclassical approach, and not a behavioural model (Berg & Gigerenzer, Citation2010).
The choosing companies evaluate the three patches in consideration on their three qualities: attractiveness, price and agglomeration, which are given weights which are identical for all companies in the study. Price is not the focal point of this study, and is kept at half the importance of attractiveness, but the effect of varying this weight is discussed in Appendix D in the supplemental data online. The weight for agglomeration externalities expresses the importance of agglomeration externalities for companies. It is one of the central objects of study. It is randomly drawn between 0 and 1. This design shows how incremental changes in the importance of agglomeration externalities affect clustering dynamics. For reference, the model is also run several times with the weight being exactly 0, meaning agglomeration economies are absent from those runs.
The weights are the same for all companies in a given simulation, but the companies themselves are diverse. Therefore, companies have idiosyncratic sensitivities to the three qualities of patches. These are firm-specific factors which increase or reduce the importance of specific qualities. This also introduces stochasticity into the model which mimics the erratic nature of actual relocation decisions. Moreover, a margin of error is introduced. In practice companies are unable to make accurate assessments of locational qualities. Consequently, companies randomly under- or overestimate the qualities of their targets.
Out of this process each choosing company gets one patch with the highest score. In the decision phase, a company decides between moving to this target or staying put. Companies have a strong inclination to stay in their current location. The decision is therefore dependent on the perceived utility of the current and alternative locations and the idiosyncratic propensity to move. If the difference between the potential new location and the current location is greater than that propensity to move, the company moves.
In each simulation this choice process consists of 30 rounds. In each round, all companies run through the choice process once. Thus, every company reconsiders its location 30 times. With each passing round, the overall patterns change less and less. After 30 rounds the pattern does not change substantially any further.
Technical description
For a full description of our model using the ODD protocol for agent-based modelling (Grimm et al., Citation2006, Citation2020), see Appendix A in the supplemental data online.
Outcome
We run the model multiple times (N = 4350). The variables in the model are herding and agglomeration. Agglomeration is a continuous variable (between 0 and 1). Herding is a variable with four possible values (scenarios h0–h3). The model runs for each of these scenarios. To create point of reference, the model first runs 75 times for each scenario with agglomeration weights at 0, thus creating a simulation without agglomeration externalities.
Our outcome measures are two. First, we calculate the percentage of companies whose closest neighbour is in the same sector. When there is no spatial clustering with three sectors, this measure has an expected value of a third. When companies are completely segregated according to their sector this is 1. We call this measure segregation. This metric is used to rule out the possibility that any results may be the consequence of particularities of the used measurements (see Appendix D in the supplemental data online).
In our analysis, we will mostly use our second metric, which indicates concentration. This second metric is based on Ellison and Glaeser’s (Citation1997) dartboard approach. This shows how strongly a distribution deviates from a distribution of randomly thrown darts on a map where the size of each cell is proportionate to the share of total companies in that cell. This score, , is calculated as follows:
where
is the share of companies in a sector that are in a particular cell, and
is the share of all companies in that cell, calculated for all cells
. H is a Herfindahl index of the size distribution, but since all companies are equal in size, this index has a base value of
, where
is the number of companies in the simulation.
is calculated for each sector separately.
RESULTS
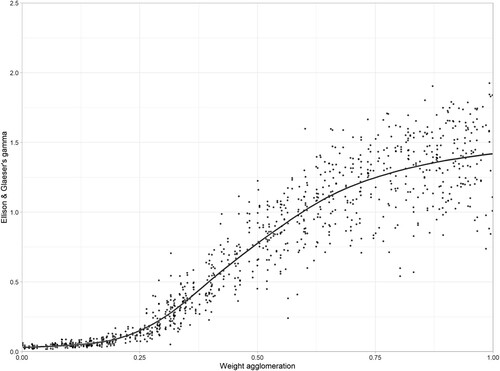
As expected, the base scenario, a model without any agglomeration or herding behaviour, produces near-random concentration and segregation indices.Footnote3 When the importance of agglomeration externalities rises, the degree of concentration, measured by Ellison & Glaeser’s γ, increases too. When the weight for agglomeration externalities in our model exceeds 0.25, the degree of clustering starts to increase rapidly, but then stabilizes at about a value of around 1.4 on average, though a large range of outcomes can occur (); such stabilization to stable fixed points is not unusual (Arthur et al., Citation1987). This could be interpreted to mean that the importance of agglomeration must be at least about 0.25 in the model to create the critical mass necessary for cluster formation. After this point incremental increases in the weight of agglomeration, can cause quite major increases in the measured degree of clustering.
Figure 4. Concentration (Ellison and Glaeser’s ) resulting from increasing the amount of agglomeration in the model.
First, we look into the question whether herd behaviour can produce similar results as agglomeration economies. We do find that clustering also occurs when herding is introduced (but agglomeration economies are absent). We compare the scenarios with feature herd behaviour to agglomeration scenarios with similar outcomes. It is possible to identify a range of agglomeration strengths which corresponds to one of the herding scenarios for each of the three herding scenarios (). For instance, the h2 scenario and the 17–23% bracket for agglomeration externalities () produce consistently similar metrics for the degree of clustering, both in averages as well as in range. shows for each cell in our model (with cell 1 having the highest autonomous quality and cell 25 the worst) the number of companies on that cell in the simulations using boxplots. This graph distinguishes the scenario h2, the 17–23% bracket for agglomeration externalities as well the base scenario with neither herd behaviour nor agglomeration externalities.
Figure 5. Cell occupation by rank for the three scenarios.
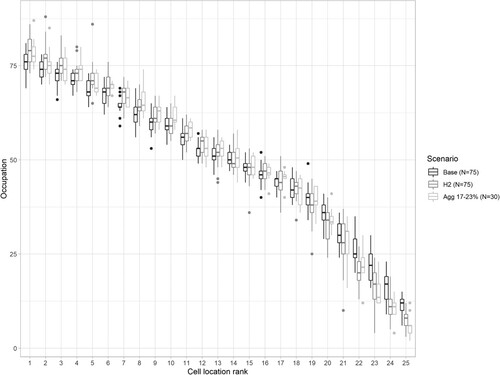
Table 1. Seven scenarios.
shows that the distribution of companies across the cells is more or less the same in both herding and agglomeration scenarios. Compared with the base scenario, companies are more likely to locate on one of the cells with the highest inherent qualities.Footnote4
From , we note the inclusion of either herd behaviour or agglomeration externalities does not considerably change the distribution of the firms across the cells. Basically, the only noticeable differences are:
herding and agglomeration scenarios tend to produce a slightly more skewed distribution, in which more companies are located in the most attractive cells compared with the base scenario; and
the herding scenario produces slightly more outliers. This means that the model can occasionally result in outcomes which are rather divergent from the median.
In a second step of analysis, we combine both herding and agglomeration. shows our results, depicting Ellison and Glaeser’s γ on the y-axis, agglomeration on the x-axis, and herding in four scenarios; the h0 scenario, in fact, reproduces . In addition, the intersections with the y-axis for graphs h1–h3 occur at the values for the mean given in .
Figure 6. Agglomeration and herding combined (outliers removed).
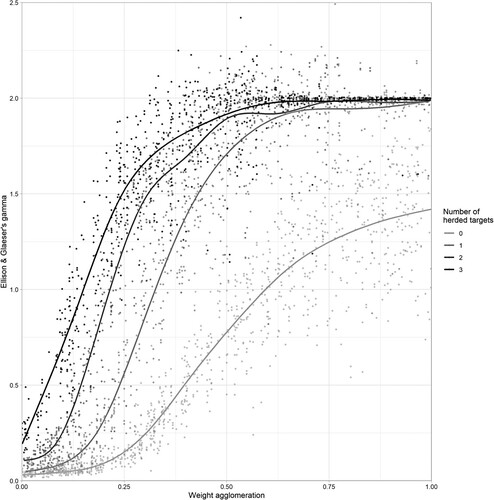
The first observation that can be made is that the addition of herd behaviour in the model with agglomeration externalities fundamentally alters the way the system functions. This is noticeable in three facets of the model. First, the graphs of the herding models have a steeper gradient, meaning that incremental increases in the weight for agglomeration cause rather strong increases in the degree of clustering. This also means that, if herding behaviour is included, much stronger cluster emerge with lower levels of agglomeration externalities. Second, the graphs of the herding scenarios plateau at higher degrees of clustering. This means that maximum achievable clustering in the system is much higher when both herding and agglomeration are present. Third, the amount of agglomeration externalities necessary for cluster formation is lower when herding is present in the system. This means the critical mass necessary to spur the emergence of clusters happens much more easily. In our model herd behaviour and agglomeration externalities create a virtuous cycle in which only small amounts of both can create a relatively large degree clustering, which can only be equalled by very large amounts of either force on its own.
The forces of both herd behaviour and agglomeration grow stronger the larger a cluster becomes. The pulling force of a cluster therefore increases with its size, creating a virtuous cycle. When there is no pre-existing clustering in a system the forces of herd behaviour and/or agglomeration externalities have no effect. In our model both randomness as well as the initial quality of location can cause a small concentration of companies, functioning as anchor points for further clustering. In the model presented here the critical mass necessary for such clustering is much smaller if herd behaviour is present in the system. In our model, when clusters grow, prices increase. Rising prices can thus offset benefits of agglomeration. The outcomes presented in our model are the equilibrium reached in each run of the model. When agglomeration externalities are stronger the equilibrium occurs at higher degrees of clustering. However, when herd behaviour is introduced, the system changes fundamentally and equilibria occur at much higher degrees of clustering, even with very minor agglomeration externalities. The three herding scenarios stabilize around a value of .Footnote5 This shows that herd behaviour and agglomeration can create a virtuous cycle in which small amounts of both forces can create a considerably larger effect than either force can on its own.Footnote6
We performed several checks of the robustness of our findings. Appendix D in the supplemental data online shows that results are stable when we adjust the number of runs, the initial parameters for price, number of companies, patch capacity and number of steps, as well as the differences in attractiveness between cells. Although these alternative set-ups create different results, in essence they support the same main findings. Of course, depending on the parametrization, the tipping point in the association between herding and agglomeration as well as the range and mean of the modal location rank vary.
CONCLUSIONS
We have investigated the development of clusters in different scenarios using an ABM, combining insights from different branches of economic geography to develop a more complete view on the way clusters form. We have shown that the traditional rationale behind clustering, where expected or known agglomeration economies are the driving force behind clustering, can be criticized because it assumes a psychology which decision-makers do not exhibit. This article puts forth an alternative hypothesis as an explanation for the development of clusters. It suggests that bounded rationality, and in particular the risk-averting psychological forces of imitation can play a decisive role in the formation of clusters in an urban context. Our article is of course not an empirical proof of this effect, but instead shows theoretically that such a process is capable of creating clustering patterns.
Our model confirms theoretically that herding behaviour can to some extent create the same patterns agglomeration benefits can. However, even more striking is the effect that both forces can create together. Even a small rate of agglomeration externalities and a little bit of herd behaviour can together create a degree of clustering.
Our model does not aim to prove the existence of herd behaviour in relocation decisions or to show that herding causes cluster formations in the real world. Instead, it utilizes previous research on the psychology of decision-making and applies this to the context of economic geography. Such a perspective is often lacking in this type of research. The model presented shows that there are good reasons to assume that such psychological factors may contribute to the formation of spatial clusters. This hypothesis needs to be further substantiated by empirical research.
Our findings could have important repercussions for empirical research. Ignoring the psychology of decision-making may cause considerable overestimation of the importance of agglomeration externalities in the dominant scientific discourse. In particular, herd behaviour can strongly boost the power of agglomeration externalities. Our findings suggest that herd behaviour can create a system in which the critical mass necessary for the formation of clusters almost naturally forms. If companies exhibit herd behaviour, clusters can form with relatively little agglomeration externalities. This challenges the dominant way of thinking in economic geography, which although well-established has been questioned over the last decades for its lack of theoretical rigour (Maskell & Malmberg, Citation2007) and its lack of attention to the formative stage (Gordon & McCann, Citation2005; Klepper, Citation2010). The role of imitation in decision-making has also been stressed (Berg, Citation2014; Vicente & Suire, Citation2007). We provide support for the role of herd behaviour in the formation of sectoral clusters.
One could expect that the erratic nature of herding would increase the unpredictability of the model and cause cluster formation on illogical locations. Fortunately for empirical work on clustering, this seems not to be the case. The locations of clusters are not less predictable when imitation is present in a simulation, given a basic exogenous attractiveness of places. In all simulations, the probability of a cluster forming on a location increases with the attractiveness of that location.
If herd behaviour affects the spatial distribution of companies in the way we suggest, it will significantly affect spatial-economic policies. Policy implications are then twofold. First, the fact that herd behaviour could exaggerate the positive effect of agglomeration externalities suggests existing literature may be overestimating their effect. Policy makers should therefore be cautious in trying to boost agglomeration externalities and should be careful with funds allocated to support clusters. Second, our research does not imply that herding might lead to more erratic spatial distributions of firms. That implies the good news is that the choice of regions to support in cluster policy is not affected by our results.
As for future research, we can think of three main directions to expand our work. Further empirical testing is surely necessary to show whether the presence of herd behaviour in real-life location decisions occurs, and its effect on the distribution of companies. Second, further research is needed into alternative ways in which companies might make decision shortcuts, including for example the role of inertia in the cluster life cycle (Hervas-Oliver & Albors-Garrigos, Citation2014; Maskell & Malmberg, Citation2007). Finally, the model itself can be further elaborated to include firm size as well as entry and exit dynamics (Klepper, Citation2007).
Supplemental Material
Download MS Word (305.3 KB)ACKNOWLEDGEMENTS
The authors thank Chee-Key Teoh and Gideon Bolt for their comments, as well as the digital audience at NARSC 2020.
DISCLOSURE STATEMENT
No potential conflict of interest was reported by the authors.
AUTHOR CONTRIBUTIONS
This paper is based on Gerben Van Roekel’s modelling work. He also wrote most of the text, under Martijn Smit’s guidance. Smit provided the initial idea and reorganized the materials for the current paper. Both authors revised the final version.
Notes
1 Sociologists work with models of neighbourhood choice that include an imitative element (Durlauf, Citation2004). It is possible to adjust Durlauf’s generic model for individuals to firms (Smit, Citation2010, p. 22), incorporating a component for the subjective beliefs of the firm about the behaviour of other firms.
2 It would be possible to programme agents with a memory, so that, for instance, the probability of moving would be shaped by the time since their last move. Adding elements such as these would make the model more complicated and is not considered relevant for the current analysis. Adding a component of memory is left as a suggestion for further research.
3 Precise results are available on demand or can be re-estimated using the code in Appendix B in the supplemental data online.
4 This graph does not allow inferences about the degree of clustering in these particular scenarios – the degree of clustering is determined by the locations of the companies in one sector relative to the locations of the total population of companies, and this graph is not split by sector.
5 The value of = 2.0 is reached when each cell is monosectoral. Higher levels of
can only be reached if this condition is (almost) true for one sector, but not for other sectors; but in our model, the three sectors are perfect substitutes.
6 Appendix C in the supplemental data online contains an alternative visualization of the outcomes, using the cell ranks.
REFERENCES
- Ajraldi, V., Pittavino, M., & Venturino, E. (2011). Modeling herd behavior in population systems. Nonlinear Analysis: Real World Applications, 12(4), 2319–2338. https://doi.org/10.1016/j.nonrwa.2011.02.002
- Alós-Ferrer, C., Hügelschäfer, S., & Li, J. (2016). Inertia and decision making. Frontiers in Psychology, 7. Article no. 169. https://doi.org/10.3389/fpsyg.2016.00169
- Armstrong, H., & Taylor, J. (2000). Regional Economics and policy: Vol. 3rd edition. Blackwell.
- Armstrong, M., & Huck, S. (2010). Behavioral economics as applied to firms: A primer. MPRA Paper, 20356. https://mpra.ub.uni-muenchen.de/20356/.
- Arthur, W. B. (2021). Foundations of complexity economics. Nature Reviews Physics, 3(2), 136–145. https://doi.org/10.1038/s42254-020-00273-3
- Arthur, W. B., Ermoliev, Y. M., & Kaniovski, Y. M. (1987). Path-dependent processes and the emergence of macro-structure. European Journal of Operational Research, 30(3), 294–303. https://doi.org/10.1016/0377-2217(87)90074-9
- Baddeley, M. (2010). Herding, social influence and economic decision-making: Socio-psychological and neuroscientific analyses. Philosophical Transactions of the Royal Society B, 365(1538), 281–290. https://doi.org/10.1098/rstb.2009.0169
- Balland, P.-A., Boschma, R., Crespo, J., & Rigby, D. L. (2019). Smart specialization policy in the European union: Relatedness, knowledge complexity and regional diversification. Regional Studies, 53(9), 1252–1268. https://doi.org/10.1080/00343404.2018.1437900
- Banerjee, A. V. (1992). A simple model of herd behavior. The Quarterly Journal of Economics, 107(3), 797–817. https://doi.org/10.2307/2118364
- Beaudry, C., & Schiffauerova, A. (2009). Who’s right, Marshall or Jacobs? The Localization versus urbanization debate. Research Policy, 38(2), 318–337. https://doi.org/10.1016/j.respol.2008.11.010
- Berg, N. (2014). Success from satisficing and imitation: Entrepreneurs’ location choice and implications of heuristics for local economic development. Journal of Business Research, 67(8), 1700–1709. https://doi.org/10.1016/j.jbusres.2014.02.016
- Berg, N., & Gigerenzer, G. (2010). As-if behavioral economics: Neoclassical economics in disguise? History of Economic Ideas, 1, https://doi.org/10.1400/140334
- Bikhchandani, S., Hirshleifer, D., & Welch, I. (1998). Learning from the behavior of others: Conformity, fads, and informational cascades. Journal of Economic Perspectives, 12(3), 151–170. https://doi.org/10.1257/jep.12.3.151
- Boeing, G. (2018). The effects of inequality, density, and heterogeneous residential preferences on Urban displacement and metropolitan structure: An agent-based model. Urban Science, 2(3), 76. https://doi.org/10.3390/urbansci2030076
- Bonabeau, E. (2002). Agent-based modeling: Methods and techniques for simulating human systems. Proceedings of the National Academy of Sciences, 99(Supplement 3), 7280–7287. https://doi.org/10.1073/pnas.082080899
- Boschma, R. A., & Frenken, K. (2006). Why is Economic Geography not an Evolutionary science? Towards an Evolutionary Economic Geography. Journal of Economic Geography, 6(3), 273–302. https://doi.org/10.1093/jeg/lbi022
- Braczyk, H.-J., Cooke, P., & Heidenreich, M. (2004). Regional innovation systems: The role of governances in a globalized world. Routledge.
- Brouwer, A. E., Mariotti, I., & Ommeren, J. N. v. (2004). The firm relocation decision: An empirical investigation. The Annals of Regional Science, 38(2), 335–347. https://doi.org/10.1007/s00168-004-0198-5
- Brunes, F. (2005). Overbuilding in office markets: Are behavioural aspects important? Building and real estate economics, Department of Infrastructure, Royal Institute of Technology.
- Caragliu, A., De Dominicis, L., & de Groot, H. L. F. (2016). Both Marshall and Jacobs were right!. Economic Geography, 92(1), 87–111. https://doi.org/10.1080/00130095.2015.1094371
- Cipriani, M., & Guarino, A. (2009). Herd Behavior in Financial Markets: An experiment with Financial Market professionals. Journal of the European Economic Association, 7(1), 206–233. https://doi.org/10.1162/JEEA.2009.7.1.206
- Cohen, A. R., Gadon, H., & Miaoulis, G. (1976). Decision making in firms: The impact of noneconomic factors. Journal of Economic Issues, 10(2), 242–258. https://doi.org/10.1080/00213624.1976.11503343
- Content, J., & Frenken, K. (2016). Related variety and economic development: A literature review. European Planning Studies, 24(12), 2097–2112. https://doi.org/10.1080/09654313.2016.1246517
- Cyert, R. M., & Hedrick, C. L. (1972). Theory of the firm: Past, present, and future; An interpretation. Journal of Economic Literature, 10(2), 398–412.
- de Bok, M., & van Oort, F. (2011). Agglomeration economies, accessibility, and the spatial choice behavior of relocating firms. Journal of Transport and Land Use, 4(1), 5–24. JSTOR. https://doi.org/10.5198/jtlu.v4i1.144
- Ding, M., Ross, W. T., & Rao, V. R. (2010). Price as an indicator of quality: Implications for utility and demand functions. Journal of Retailing, 86(1), 69–84. https://doi.org/10.1016/j.jretai.2010.01.002
- Diodato, D., Neffke, F., & O’Clery, N. (2018). Why do industries coagglomerate? How Marshallian externalities differ by industry and have evolved over time. Journal of Urban Economics, 106, 1–26. https://doi.org/10.1016/j.jue.2018.05.002
- Duranton, G., & Puga, D. (2001). Nursery cities: Urban diversity, process innovation, and the life cycle of products. American Economic Review, 91(5), 1454–1477. https://doi.org/10.1257/aer.91.5.1454
- Durlauf, S. N. (2004). Neighborhood effects. In J. V. Henderson, & J.-F. Thisse (Eds.), Handbook of Urban and Regional Economics: Cities and geography (pp. 2173–2242). Elsevier.
- Edmans, A. (2009). Blockholder trading, market efficiency, and Managerial myopia. The Journal of Finance, 64(6), 2481–2513. https://doi.org/10.1111/j.1540-6261.2009.01508.x
- Elgar, I., Farooq, B., & Miller, E. J. (2009). Modeling location decisions of office firms: Introducing anchor points and constructing choice sets in the model system. Transportation Research Record: Journal of the Transportation Research Board, 2133(1), 56–63. https://doi.org/10.3141/2133-06
- Ellison, G. D., & Glaeser, E. L. (1997). Geographic concentration in US manufacturing industries: A dartboard approach. Journal of Political Economy, 105(5), 889–927. https://doi.org/10.1086/262098
- Ellison, G. D., Glaeser, E. L., & Kerr, W. R. (2007). What causes industry agglomeration? Evidence from coagglomeration patterns. SSRN ELibrary, http://ssrn.com/paper=980966.
- Elsner, W. (2017). Complexity Economics as heterodoxy: Theory and policy. Journal of Economic Issues, 51(4), 939–978. https://doi.org/10.1080/00213624.2017.1391570
- Frenken, K., van Oort, F. G., & Verburg, T. (2007). Related Variety, unrelated Variety and Regional Economic growth. Regional Studies, 41(5), 685–697. https://doi.org/10.1080/00343400601120296
- Gao, J., Jun, B., Pentland, A., ‘Sandy,’ Zhou, T., & Hidalgo, C. A. (2021). Spillovers across industries and regions in China’s regional economic diversification. Regional Studies, https://www.tandfonline.com/doi/abs/10.1080/00343404.2021.1883191.
- Gordon, I. R., & McCann, P. (2005). Innovation. Agglomeration, and Regional Development. Journal of Economic Geography, 5(5), 523–543. https://doi.org/10.1093/jeg/lbh072
- Graf, H., & Broekel, T. (2020). A shot in the dark? Policy influence on cluster networks. Research Policy, 49(3), 103920. https://doi.org/10.1016/j.respol.2019.103920
- Grimm, V., Berger, U., Bastiansen, F., Eliassen, S., Ginot, V., Giske, J., Goss-Custard, J., Grand, T., Heinz, S. K., Huse, G., Huth, A., Jepsen, J. U., Jørgensen, C., Mooij, W. M., Müller, B., Pe’er, G., Piou, C., Railsback, S. F., Robbins, A. M., … DeAngelis, D. L. (2006). A standard protocol for describing individual-based and agent-based models. Ecological Modelling, 198(1), 115–126. https://doi.org/10.1016/j.ecolmodel.2006.04.023
- Grimm, V., Railsback, S. F., Vincenot, C. E., Berger, U., Gallagher, C., Deangelis, D. L., Edmonds, B., Ge, J., Giske, J., Groeneveld, J., Johnston, A. S. A., Milles, A., Nabe-Nielsen, J., Polhill, J. G., Radchuk, V., Rohwäder, M. S., Stillman, R. A., Thiele, J. C., & Ayllón, D. (2020). The ODD protocol for describing agent-based and other simulation models: A second update to improve clarity, replication, and structural realism. Journal of Artificial Societies and Social Simulation, 23(2), Article 2. http://eprints.bournemouth.ac.uk/33918/. https://doi.org/10.18564/jasss.4259
- Hervas-Oliver, J.-L., & Albors-Garrigos, J. (2014). Are technology gatekeepers renewing clusters? Understanding gatekeepers and their dynamics across cluster life cycles. Entrepreneurship & Regional Development, 26(5–6), 431–452. https://doi.org/10.1080/08985626.2014.933489
- Hotelling, H. (1929). Stability in economic competition. Economic Journal, 39(153), 41–57. https://doi.org/10.2307/2224214
- Iqbal, K., Islam, A., List, J. A., & Nguyen, V. (2021). Myopic Loss Aversion and Investment Decisions: From the Laboratory to the Field (Working Paper No. 28730; Working Paper Series). National Bureau of Economic Research. https://doi.org/10.3386/w28730.
- Isaksen, A., Martin, R., & Trippl, M. (2018). New avenues for regional innovation systems—theoretical advances, empirical cases and policy lessons. Springer.
- Kaplan, S., & Henderson, R. (2005). Inertia and incentives: Bridging Organizational Economics and Organizational theory. Organization Science, 16(5), 509–521. https://doi.org/10.1287/orsc.1050.0154
- Keynes, J. M. (1936). The general theory of employment, interest, and money. Palgrave Macmillan.
- Klepper, S. (2007). Disagreements, spinoffs, and the evolution of Detroit as the capital of the US automobile industry. Management Science, 53(4), 616–631. https://doi.org/10.1287/mnsc.1060.0683
- Klepper, S. (2010). The origin and growth of industry clusters: The making of Silicon Valley and Detroit. Journal of Urban Economics, 67(1), 15–32. https://doi.org/10.1016/j.jue.2009.09.004
- Koetsier, I., & Bikker, J. A. (2017). Herding behaviour of Dutch pension funds in sovereign bond investments (SSRN scholarly Paper ID 3041258). Social Science Research Network, https://doi.org/10.2139/ssrn.3041258
- Koster, H. R. A., van Ommeren, J., & Rietveld, P. (2014). Is the sky the limit? High-rise buildings and office rents. Journal of Economic Geography, 14(1), 125–153. https://doi.org/10.1093/jeg/lbt008
- Larwood, L., & Whittaker, W. (1977). Managerial myopia: Self-serving biases in organizational planning. Journal of Applied Psychology, 62(2), 194–198. https://doi.org/10.1037/0021-9010.62.2.194
- Lejarraga, J., & Martinez-Ros, E. (2008). Comparing small vs large firms’ R&D productivity through a dual process perspective. Academy of Management Proceedings, 2008(1), 1–6. https://doi.org/10.5465/ambpp.2008.33631743
- Louw, E. (1996). Kantoorgebouw en vestigingsplaats. Een geografisch onderzoek naar de rol van huisvesting bij locatiebeslissingen van kantoorhoudende organisaties [TU Delft]. http://resolver.tudelft.nl/uuid:3f62884d-9375-44b5-b42a-ef8457b705bb.
- Luo, B., & Lin, Z. (2013). A decision tree model for herd behavior and empirical evidence from the online P2P lending market. Information Systems and E-Business Management, 11(1), 141–160. https://doi.org/10.1007/s10257-011-0182-4
- Lux, T. (1995). Herd behaviour, bubbles and crashes. The Economic Journal, 105(431), 881. https://doi.org/10.2307/2235156
- Malmberg, A., & Maskell, P. (2002). The elusive concept of Localization economies: Towards a knowledge-based theory of spatial clustering. Environment and Planning A: Economy and Space, 34(3), 429–449. https://doi.org/10.1068/a3457
- Marini, M., Chokani, N., & Abhari, R. S. (2019). Immigration and future housing needs in Switzerland: Agent-based modelling of agglomeration Lausanne. Computers, Environment and Urban Systems, 78, 101400. https://doi.org/10.1016/j.compenvurbsys.2019.101400
- Marshall, A. (1890). Principles of economics: An introductory volume. Macmillan.
- Martellato, D. (1998). Innovation, agglomeration and complexity in Urban systems. In C. S. Bertuglia, G. Bianchi, & A. Mela (Eds.), The city and Its sciences (pp. 439–452). Physica-Verlag HD.
- Maskell, P., & Malmberg, A. (2007). Myopia, knowledge development and cluster evolution. Journal of Economic Geography, 7(5), 603–618. https://doi.org/10.1093/jeg/lbm020
- Milidonis, A., & Stathopoulos, K. (2014). Managerial incentives, risk aversion, and debt. Journal of Financial and Quantitative Analysis, 49(2), 453–481. https://doi.org/10.1017/S0022109014000301
- Miller, J. H., & Page, S. E. (2007). Complex adaptive systems: An Introduction to computational models of social life (STU-student edition). Princeton University Press. http://www.jstor.org/stable/j.ctt7s3kx.
- Minniti, M. (2005). Entrepreneurship and network externalities. Journal of Economic Behavior & Organization, 57(1), 1–27. https://doi.org/10.1016/j.jebo.2004.10.002
- Nguyen, C. Y., Sano, K., Tran, T. V., & Doan, T. T. (2013). Firm relocation patterns incorporating spatial interactions. The Annals of Regional Science, 50(3), 685–703. https://doi.org/10.1007/s00168-012-0523-3
- Olsson, G., & Gale, S. (1968). Spatial theory and human behavior. Papers of the Regional Science Association, 21(1), 229–242. https://doi.org/10.1007/BF01952731
- Pellenbarg, P., van Steen, P., & van Wissen, L. (Eds.). (2005). Ruimtelijke aspecten van de bedrijvendynamiek in Nederland. Assen: Van Gorcum.
- Posen, H. E., Lee, J., & Yi, S. (2013). The power of imperfect imitation: The power of imperfect imitation. Strategic Management Journal, 34(2), 149–164. https://doi.org/10.1002/smj.2007
- Privault, N. (2013). Understanding Markov chains: Examples and applications. Heidelberg/New York: Springer.
- Rosenthal, S. S., & Strange, W. C. (2004). Evidence on the nature and sources of agglomeration economies. In V. Henderson, & J.-F. Thisse (Eds.), Handbook of Regional and Urban economics (pp. 2119–2171). Elsevier.
- Seiler, M. J., Lane, M. A., & Harrison, D. M. (2014). Mimetic herding Behavior and the decision to strategically default. The Journal of Real Estate Finance and Economics, 49(4), 621–653. https://doi.org/10.1007/s11146-012-9386-8
- Simon, H. A. (1955). A Behavioral model of rational choice. The Quarterly Journal of Economics, 69(1), 99. https://doi.org/10.2307/1884852
- Simon, H. A. (2013). Administrative behavior (4th ed.). Simon and Schuster.
- Slovic, P., Finucane, M. L., Peters, E., & MacGregor, D. G. (2004). Risk as analysis and risk as feelings: Some thoughts about affect, reason, risk, and rationality. Risk Analysis, 24(2), 311–322. https://doi.org/10.1111/j.0272-4332.2004.00433.x
- Smit, M. J. (2010). Agglomeration and innovation: Evidence from Dutch Microdata [Vrije Universiteit]. http://dare.ubvu.vu.nl/handle/1871/16065.
- Spencer, G. M. (2012). Creative economies of scale: An agent-based model of creativity and agglomeration. Journal of Economic Geography, 12(1), 247–271. https://doi.org/10.1093/jeg/lbr002
- Stein, J. C. (1988). Takeover threats and Managerial myopia. Journal of Political Economy, 96(1), 61–80. https://doi.org/10.1086/261524
- Suire, R., & Vicente, J. (2008). Why do some places succeed when others decline? A social interaction model of cluster viability. Journal of Economic Geography, 9(3), 381–404. https://doi.org/10.1093/jeg/lbn053
- Townroe, P. (1973). The supply of mobile industry: A cross-sectional analysis. Regional and Urban Economics, 2(4), 371–385. https://doi.org/10.1016/0034-3331(73)90003-1
- Townroe, P. (1991). Rationality in industrial location decisions. Urban Studies, 28(3), 383–392. https://doi.org/10.1080/00420989120080411
- van Dijk, J., & Pellenbarg, P. H. (2000). Firm relocation decisions in The Netherlands: An ordered logit approach. Papers in Regional Science, 79(2), 191–219. https://doi.org/10.1007/s101100050043
- van Witteloostuijn, A. (1998). Bridging Behavioral and Economic theories of decline: Organizational inertia, Strategic competition, and chronic failure. Management Science, 44(4), 501–519. https://doi.org/10.1287/mnsc.44.4.501
- Vicente, J., Dalla Pria, Y., & Suire, R. (2007). The ambivalent role of mimetic behavior in proximity dynamics: Evidence from the French ‘Silicon Sentier’. In J. Suriñach, R. Moreno, & E. Vay (Eds.), Knowledge externalities, innovation clusters and Regional development (pp. 61–91). Edward Elgar.
- Vicente, J., & Suire, R. (2007). Informational cascades versus network externalities in locational choice: Evidence of ‘ICT clusters’ formation and stability. Regional Studies, 41(2), 173–184. https://doi.org/10.1080/00343400601108424
- Weber, A. (1909). Über den Standort der industrien: Reine theorie des Standorts. Mohr.
- Weizsäcker, G. (2010). Do We follow others when We should? A simple test of rational expectations. American Economic Review, 100(5), 2340–2360. https://doi.org/10.1257/aer.100.5.2340
- Wernberg, J. (2017). The Inherent Complexity of Agglomeration: Essays on the self-organization of urban economies [Lund University]. https://portal.research.lu.se/portal/en/publications/the-inherent-complexity-of-agglomeration(0031ae28-1bbd-40b7-995d-fe4943ff4208).html.
- Wilensky, U., & Rand, W. (2015). An introduction to agent-based modeling: Modeling natural, social, and engineered complex systems with NetLogo. The MIT Press.
- Willigers, J., & van Wee, B. (2011). High-speed rail and office location choices. A stated choice experiment for the Netherlands. Journal of Transport Geography, 19(4), 745–754. https://doi.org/10.1016/j.jtrangeo.2010.09.002
- Zhao, L., Yang, G., Wang, W., Chen, Y., Huang, J. P., Ohashi, H., & Stanley, H. E. (2011). Herd behavior in a complex adaptive system. Proceedings of the National Academy of Sciences, 108(37), 15058–15063. https://doi.org/10.1073/pnas.1105239108