
Abstract
Silver is increasingly being used in garments to exploit its antibacterial properties. Information on the presence of silver nanoparticles (AgNPs) in garments and their in vivo penetration across healthy and impaired skin from use is limited. We investigated the presence of AgNPs in a silver containing garment and in the stratum corneum (SC) of healthy subjects (CTRLs) and individuals with atopic dermatitis (AD). Seven CTRLs and seven AD patients wore a silver sleeve (13% Ag w/w) 8 h/day for five days on a forearm and a placebo sleeve on the other forearm. After five days, the layers of the SC were collected by adhesive tapes. The silver particles in the garment and SC were characterized by scanning electron microscopy with energy dispersive X-ray analysis (SEM-EDX) and atomic force microscopy (AFM). AFM and SEM revealed the presence of sub-micrometre particles having a broad range of sizes (30–500 nm) on the surface of the garment that were identified as silver. On the SC tapes collected from different depths, aggregates with a wide range of sizes (150 nm–2 μm) and morphologies were found. Most aggregates contained primarily silver, although some also contained chlorine and sulfur. There was no clear difference in the number or size of the aggregates observed in SC between healthy and AD subjects.
After use, AgNPs and their aggregates were present in the SC at different depths of both healthy subjects and AD patients. Their micrometre size suggests that aggregation likely occurred in the SC.
Introduction
The skin acts as a primal barrier against loss of water and endogenous substances from the human body; furthermore, the skin prevents the ingress of exogenous pathogens and pollutants. The outermost layer of the skin, the stratum corneum (SC) represents the main barrier of the skin and prevents entrance of potentially harmful substances into the viable skin layers (underlying epidermis and dermis). While a large number of studies have investigated penetration of organic and inorganic solutes, little is known about percutaneous penetration of particles. At present there is a growing interest in this area because of the ascent of nanomedicine and drug delivery by nano-carriers (Jensen et al., Citation2011; Labouta et al., Citation2011; Lademann et al., Citation2007; Lieb et al., Citation1992; Schaefer and Lademann, Citation2001). As the SC is regarded as a primary barrier for skin absorption, the amount of a substance measured at different depths of the SC may be used to investigate percutaneous penetration. Tape stripping is a technique that allows for sequential removal of SC cell layers using an adhesive tape and has become a basic method to study the penetration and the reservoir behavior of topically applied substances (Bronaugh & Stewart, Citation1985; Jakasa et al., Citation2006; Lademann et al., Citation2009).
The role of silver as topical agent to reduce the colonization of bacteria is well known and is generally believed to be related to the release of silver ions from material. In the last decades the use of silver nanoparticles (AgNPs) as source of silver ions is strongly increased in various medical and consumer products (Ansari et al., Citation2011; Martinez-Castanon et al., Citation2008) and a number of studies address their toxicity (Arbabi et al., Citation2013; Korani et al., Citation2011, Citation2015). Since even a thin layer of metallic silver on the material could impart a nanostructured surface (Oriňáková et al., Citation2013), the characterization of silver in these materials is needed. Often, the presence of AgNPs in commercially available products is not stated by the manufacturer. Therefore, the aim of this study was to investigate the presence of AgNPs in a garment (i.e. textile sleeve covering forearm skin) and subsequently whether AgNPs are present in the skin after dermal exposure. As medical devices containing AgNPs are increasingly being used to combat frequent bacterial infections in atopic dermatitis (AD) (Jain et al., Citation2009; Keck & Schwabe, Citation2009;Keck et al., Citation2014; Kim et al., Citation2008), in the present study we included healthy subjects and AD patients. The European Scientific Committee on Cosmetics and Non-Food Products (SCCNP) nanotechnology report declares that the data on skin penetration of nanoparticles through diseased skin are limited. An impaired skin barrier will not only increase the amount of a compound that penetrate across the skin but will possibly also allow for penetration of particles that normally would not be able to penetrate due to their large size (Kezic & Nielsen, Citation2009). This study is a part of a larger previously published investigation (Pluut et al., Citation2015) in which percutaneous penetration of total silver (i.e. ionic and particulate form) has been investigated in 20 healthy volunteers and 20 AD patients. From the cohort of patients described in Pluut et al. (Citation2015), tape strips from seven AD and seven healthy subjects after the fifth day of exposure were randomly chosen and further investigated for the presence of silver particles in the skin by using more advanced techniques, atomic force microscopy (AFM) and scanning electron microscopy with energy dispersive X-ray analysis (SEM-EDX), than were used in Pluut et al. (Citation2015).
Methods
Dermal exposure
The subjects wore on their forearm a silver-containing sleeve for 8 h during the night on five consecutive days. As a control, on the other forearm the participants wore a placebo (silver free) sleeve. The silver garment (Medical device Class I) consisted of 79% Micromodal fiber, 13% Polyamide Ag and 7% Lycra. The area of the sleeve was on average 600 cm2. To determine the concentration of silver in the material, samples of 1 cm2 from three sleeves were digested for 24 h in 5 mL of nitric acid 69% v/v. After 24 h, the resulting solutions were diluted to 50 mL with Milli-Q water (Bedford, MA) and analyzed for silver content by inductively coupled plasma-atomic emission spectroscopy (ICP-AES). The average concentration of silver was 3.6 (±0.1 SD) (w/w).
Study population
The characterization of silver particles has been performed in the SC tape collected from 14 Caucasian subjects (seven healthy subjects and seven subjects with AD), 10 female and 4 male, with a mean age of 31.6 years (range 21–68 years). The participants gave a written informed consent before starting the study, which was approved by the Medical Ethics Committee of the Academic Medical Center, University of Amsterdam (METC 2013_031).
Tape stripping procedure
After the fifth day of exposure, the layers of the SC were sequentially removed with circular adhesive tapes (3.8 cm2, standard D-Squame, Monaderm, Monaco, France). The tapes were consecutively attached to the volunteer’s underarm and pressed for 10 s with a constant pressure (225 g/cm2) using a D-Squame pressure instrument D500 (CuDerm, Dallas, TX, USA). An average number of 20 tapes was needed to remove the whole SC. The SC depth of a particular tape could be deduced from the amount of protein measured on each tape as described elsewhere (Jakasa et al., Citation2007; Mohammed et al., Citation2012). The tapes were stored separately in cryo vials at 4 °C prior to analysis by SEM and AFM. The concentration of silver on the tapes was determined as describe previously in Pluut et al. (Citation2015). Briefly, 1 mL MilliQ water and 0.5 mL of ultrapure HNO3 (69%) was added to the tape. Samples were sonicated for 15 min and diluted to a final volume of 6.5 mL with MilliQ water. Only the first four tapes were analysed individually, other tapes were pooled (three or four tapes). The total silver concentration in tape strips was determined using inductively coupled plasma mass spectrometry (ICP-MS) (7500CE, Agilent Technologies, Santa Clara, CA, USA). The limit of detection of the method, LoD was 0.05 mg/L, RSD < 5%).
Characterization of silver particles by SEM and AFM
SEM with EDX analysis of the silver-containing and placebo textiles and SC tapes was performed blindly by three different laboratories. AFM analysis was performed by a single laboratory. For each sample (i.e. tape or material) at least three randomly selected areas were analysed.
FE-SEM-EDX – laboratory I (National Institute for Occupational Safety and Health, USA)
Textile samples were first visually observed under a light microscope. Both the silver textile and placebo had the same construction – an outer surface composed only of white threads and an internal surface (side intended to contact skin) composed of white threads inter-woven with bundles of golden colored threads. Individual golden threads were pulled from the bulk textile pieces using clean tweezers and placed on double-sided conductive carbon tape mounted on an aluminum electron microscopy stub. All microscopy stub samples were sputter coated with gold/palladium prior to analysis to enhance conductivity. Each sample was visually inspected using a field emission scanning electron microscope (FE-SEM, Model S-4800, Hitachi, Tokyo, Japan) at varying magnifications. The elemental composition of particles was evaluated using EDX analysis (Quantax, Bruker Instruments, Berlin, Germany). Identification of elements was made by matching spectra to the EDX reference library.
SEM-EDX – laboratory II (Serend-ip GmbH, Germany)
The samples were placed upon conductive carbon tape. To enhance the electrical conductivity, the samples were coated with a layer of gold approximately 5 nm thick. The images were taken in standard operation mode (15 kV) with a secondary electron detector by a LEO 1530 VP (Zeiss, Oberkochen, Germany) equipped with an EDX detector Oxford INCA energy 200 (Oxford Instruments Analytical, Wycombe, UK).
SEM-EDX – laboratory III (Department of Chemical and Pharmaceutical Sciences, University of Trieste, Italy)
Analysis was performed by a Hitachi model TM-3000 – equipped with Oxford Instruments X-ray Microanalysis (Hitachi Ltd., Tokyo, Japan). The tapes were fixed rigidly onto a circular metallic sample holder by means of an adhesive tape (silver free). All the analyses were run at 15 kV. A prior analysis at 50× was performed to have an overview of the whole sample stub. SEM analysis has been done at magnification of 2000× to identify the presence of silver aggregates for 500 fields (corresponding to an area of about 4 mm2). Any aggregate was then characterized at magnifications up to 8000× and the EDX spectrum was recorded. The starting field of analysis was randomly chosen at the upper left corner of the sample stub, and then the resting fields were selected at grid points formed by evenly spaced horizontal and vertical lines, with the distance between fields being sufficient to prevent field overlap.
AFM – laboratory IV (Laboratory for Bioelectrochemistry and Surface Imaging, Ruđer Bošković Institute, Croatia)
The AFM imaging was performed using a Multimode AFM with Nanoscope IIIa controller (Bruker, Billerica, MA, USA) with a vertical engagement (JV) 125 μm scanner using both, contact and tapping modes. Contact mode imaging was performed using silicon-nitride tips (NP-20, Veeco, nom. frequency 56 kHz, nom. spring constant of 0.32 N/m). The tapping mode was applied using silicon tips (RTESP, Veeco, resonance frequency 289–335 kHz, spring constant in the range 20–80 N/m). The maximal resolution of 512 samples per line was used if not stated otherwise. The processing and analysis of images was done by NanoScopeTM software (Digital Instruments, version V614r1). All the measurements were performed under ambient conditions i.e. at room temperature and a relative air humidity of 50-60%. Contact mode was used to analyze the silver-containing garment following previously developed protocol (Ercegović et al., Citation2011). Samples of silver-containing garment (1 cm2) were fixed onto the sample holder (stainless steel, diameter 1.5 cm) immediately before imaging using adhesive tape. The sample surface areas investigated ranged from 25 μm × 25 μm down to 2 μm × 2 μm, so as to ensure that the high-resolution images (scan areas of 2 μm × 2 μm) capture the features of interest.
Tape samples with precut surface area of 0.7 × 0.7 cm2 were fixed onto the sample holder (stainless steel, diameter 1 cm) immediately before imaging using adhesive tape.
The AFM imaging was performed using tapping mode. The linear scanning rate was optimized between 1.0 and 2.0 Hz with scan resolution of 512 samples per line, except for large scans (15 μm × 15 μm) were resolution was 256 samples per line. Scanned areas were 225 μm2, 25 μm2 and 4 μm2 corresponding to 15 μm × 15 μm, 5 μm × 5 μm and 2 μm × 2 μm scan size, respectively. For each SC sample, we have recorded at least three randomly selected large areas. The large-area images were used to select the areas of interest that were imaged at high resolution. The high-resolution images were analyzed for presence of particles that were suspected to be silver particles, which were measured using section analysis (height profiles along indicated lines).
Results
Silver particles in the garment
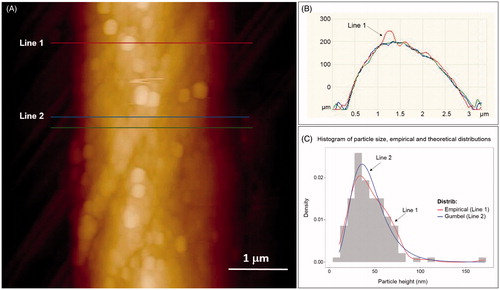
AFM images showed a grain-like morphology of the fiber surface with scattered particles of spherical or tetragonal shape (). In placebo textile, no such particles have been found.
The height of particles was measured taking into account the curvature of the fiber (). We measured the height of 117 individual particles and performed statistical analysis using “R” software environment for statistical computing and graphics (R Core Team, Citation2013). Histogram of particles height distribution is given in , and the summary of statistical analysis in Supplementary Table 1. Particles display Gumbel distribution with parameters a = 36.2 and b = 15.9.
Figure 1. AFM particle characterization of silver garment: (A) AFM height image of a silver coated fiber (vertical scale of 600 nm); (B) height profile along indicated lines. Arrow indicates particle height analysis taking into account the fiber curvature. (C) Histogram of particle height distribution (117 particles were analyzed). Red curve (Line 1) represents empirical distribution and the blue curve (Line 2) represents theoretical Gumbel distribution with parameters a = 36.2 and b = 15.9.
shows the SEM images fiber surfaces of the silver-containing textile at different magnification before use. Generally, fiber surfaces on the textile before use had a uniform coating though there were occasionally uncoated spots on the fibers (). Closer inspection of the coating revealed the presence of nanoscale particles (); the size of individual particles that comprised the coating were not measured individually to obtain a size distribution, though qualitatively they are on the order of 10s to hundreds of nanometers in diameter. EDX analysis of coating on a fiber () confirmed that the nanoscale particles that comprised the covering were made of silver (other elements identified were carbon and oxygen). EDX analysis did not identify silver particles on the uncoated spots of the garment textile or on the placebo textiles (data not shown). The EDX spectrum of the coating on the garment textile after use also contained only silver, carbon and oxygen signals (data not shown). were uniformly coated with particles, though as seen from , there were occasionally uncoated spots on the fibers. SEM-EDX analysis of silver-containing fiber () confirmed that the particles composing the covering were made of silver while no AgNP were identified on the placebo textiles.
Figure 2. SEM image of the fiber surface on the silver containing garment: (A) low (1000×) magnification illustrating overall appearance of fibers (white square indicates location of EDX spectra collection); (B) increased (5000×) magnification (area inside yellow rectangle in panel A) illustrating rough appearance of coating on fiber surfaces; (C) increased (50 000×) magnification (area inside yellow rectangle in panel B) illustrating roughness is due to presence of nanoparticles coating fibers; and (D) SEM-EDX spectra from SEM image A (white square) demonstrating that the nanoparticles coating the fibers are composed of silver (purple tags = silver, green tag = oxygen, orange tag = carbon).
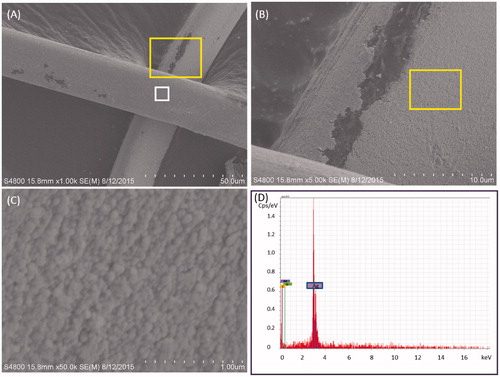
No differences in the EDX spectra of the textile before and after its use were found. There also did not appear to be any difference in the morphology of the AgNPs on the fibers before and after use; however, qualitatively there seemed to be more areas on the “after” fibers that were missing the silver coating compared to “before” fibers though this observation is based on visual inspection of only a few fields of view (images not shown).
Silver particles on the SC tapes
summarizes the information regarding SEM-EDX analysis of inorganic aggregates found in healthy and AD subjects exposed to the silver-containing garment. Furthermore, for each investigated tape, the tape number and the corresponding depth of the SC from which the tape originates are given. In all tapes, which were collected from investigated skin site, also the silver concentration has been determined by ICP-MS. As the tape in which SEM or AFM imaging has been done could not be analyzed for silver, we show in Supplementary Figure 1 the profile of silver concentration (expressed as ng Ag/cm2) vs. tape number which is obtained from other tapes. The silver concentrations on all investigated tapes (up to number 20) were above the limit of the detection of the ICP-MS method (0.05 μg/L). Numerous particles, ranging in size from a few hundred nanometers to 2 μm were detected almost in all SC samples collected from the silver exposed forearm in both healthy and AD subjects.
Table1. The summary of the SEM-EDX analysis of the SC samples after exposure to silver containing garment.
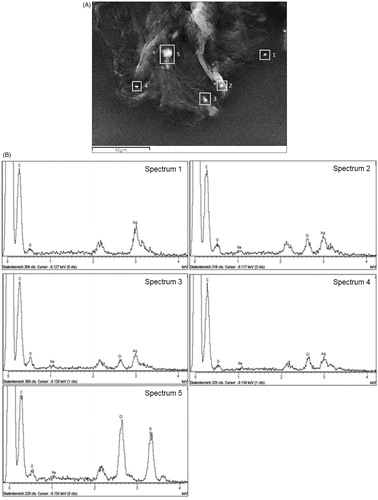
The electron density of silver resulted in these particles appearing as bright spots ( and ); moreover, the shape of silver aggregates was very irregular often revealing the single components borders. An elemental mapping for silver has been done in a number of samples consistently showing that the bright spots in the SEM image correspond with high density of silver in the elemental mapping, which is further confirmed by EDX spectra (). Consistently, the EDX of the sites without bright spots (, spot 3) showed absence of silver. Furthermore, in the control samples (placebo exposed skin) no silver was detected, although on the first tape several dull gray particles were detected on skin cell containing K–Ca–S (not shown).
Figure 3. SEM image and silver elemental mapping from three spots on the SC tape no.15 of a healthy subject after wearing of silver garment. Two bright spots on the corneocyte surface (yellow squares in images A and D) correspond to the spots with high silver electron density in the elemental maps (yellow squares in images B and E) and were identified as silver in the EDX spectrum (C and F).
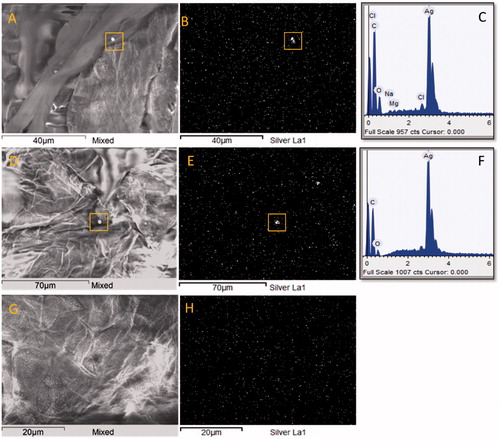
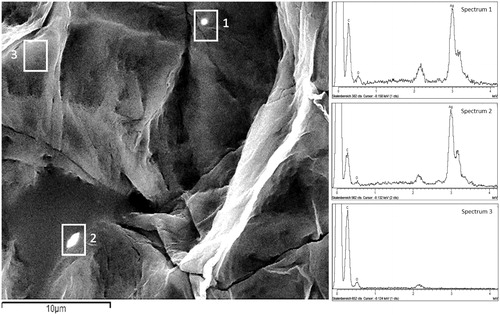
Figure 4. SEM image of SC tape no. 5 after wearing of silver garment. Micrometric aggregates with high electron density (white rectangles 1 and 2) on the corneocyte surface were identified as silver in the EDX spectrum (Spectrum 1 and 2). The EDX did not detect silver on the “black” spot (white rectangle 3) (Spectrum 3).
Although the number of silver particles in the deeper SC layers was clearly lower than in the uppermost layers , they could be detected even in the last collected tape (no. 20) ().
Figure 5. (A). SEM image of SC tape strip after wearing of silver garment. Micrometric aggregates on the corneocyte surface found on tape strip no. 5. (B): Corresponding EDX spectra of five bright spots (white rectangles) in the SEM image (A) showing different composition of the particles.
In the uppermost SC layer, (tape no.1) aggregates were found on the cells as well between the cells, whereas in the deeper layers it seems that they were located mainly on the cell surface.
Most of aggregates observed in the SEM images showed in the EDX spectra the presence of silver as major component although some aggregates, in particular those found in the deeper layers showed next to silver also chlorine, calcium, potassium, sulfur and sodium (, ). Example on the fifth tape shown in , one particle contained silver (spectrum 1), three particles showed presence of silver, chlorine and sodium (spectrum 2, 3 and 4) while one particle showed no presence of silver but only potassium, chlorine and sodium (spectrum 5). Particles that do not contain silver differed in morphology from silver aggregates as they showed more regular and compact shapes.
No striking differences were found between healthy and AD subjects regarding the morphology and number of the silver aggregates revealed.
As the elemental composition cannot be verified by AFM, the identification of silver particles was based on the particle shape (sharp edges, tetragonal or spherical shape, clusters) and by the comparison between placebo and silver exposed samples. In addition, the recorded phase images often provide a clear distinction between “organic” and “inorganic” particles. Sometimes, large objects were encountered but the edges were not sharp. In such cases, we changed the imaging parameters by applying a larger force while imaging. This way we succeeded in peeling-off the organic layer (presumably lipid) uncovering sharp objects. This finding might indicate the pathway of particle penetration being lipid bilayers between the cells. summarizes the results of AFM analysis performed on tapes of healthy and AD subjects exposed to the silver garment. According to AFM analysis, inorganic nanoparticles (30–100 nm), with a tetrahedral morphology characteristic for AgNPs (Pletikapić et al., Citation2012) were identified. Majority of the particles suspected to be silver were situated on the cells, fewer in the space between the cells (). Consistently with the SEM-EDX analysis, also AFM revealed presence of clusters and aggregates (e.g. and ). In contrast to silver-containing garment, in all but one subject no particles that were suspected to be silver have been identified by AFM (). Consistently with SEM-EDX analysis, no significant differences were revealed between healthy and AD subjects regarding the number and morphology of nanoparticles and aggregates or agglomerates found.
Figure 6. AFM imaging of the 15th SC tape of a healthy subject revealing cluster of nanoparticles: (A) height image with vertical scale of 400 nm; (B) 3D view of zoomed area (white box in A); (C) height image of zoomed area in A with height profile of the cluster along indicated line.
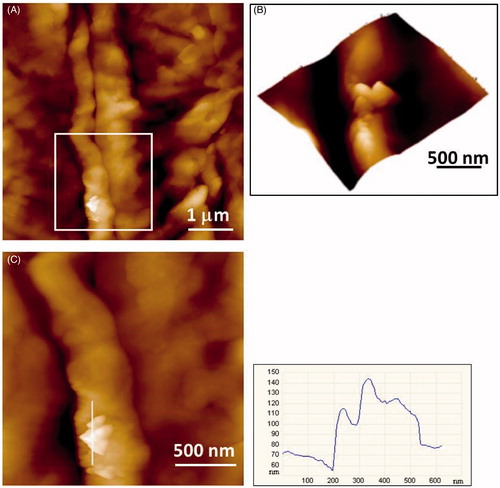
Figure 7. AFM imaging of the 12th SC tape of of an AD patient revealing particles of micrometric dimensions: (A) height image of the crystallites (vertical scale 1.2 mm); (B) 3D view; (C) height profile of the large crystallite along indicated line in A.
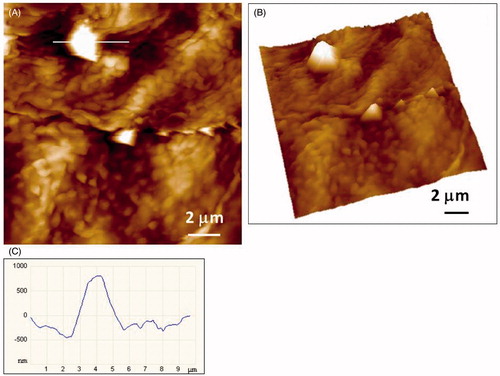
Table 2. The summary of the AFM results of SC samples analysis.
Discussion
This study was part of a larger study aiming to investigate dermal uptake of total silver (i.e. soluble and insoluble) in 20 AD patients and 20 healthy subjects (Pluut et al., Citation2015). In a number of subjects, next to dermal uptake we characterized the silver particles in the SC, which is described in this paper. The presence of Ag particles and their aggregates in different matrices was detected using AFM and SEM-EDX. The main advantage of AFM is high vertical resolution (1–2 nm), but on the other side absolute identification and elemental analysis is not possible. The first selection by using AFM was made according to the distinct morphology of the AgNPs and in comparison with the placebo samples. Next, textile and skin samples were analyzed by SEM-EDX. Both techniques used in this study require only minimal sample handling before analysis; therefore, the possibility of artifacts is strongly reduced. Moreover, SEM-EDX analysis were performed by three distinct laboratories with different instrumentations showing consistent results.
The garment characterization by AFM and SEM-EDX before and after dermal exposure revealed the presence of silver particles on the textile surface of nano- and micron-size. After five days exposure, the presence of silver particles of different size and composition was shown across the whole SC in both atopic and healthy skin, while these particles were not present in the placebo samples (with exception of one tape sample analysed by AFM). Interestingly, most of the Ag-particles on the tape 1 (approximately second–third layer of the SC) appeared between the cells, whereas the preferred localization on the deeper tapes was rather on cell surfaces. In some cases, the EDX spectra revealed also sulfur and chlorine as components of silver aggregates found in SC. The presence of chlorine in the aggregates could be ascribed to the reaction of silver ions released from the garment with chlorine from biological media, as no chlorine has been detected in the garment before exposure. The formation of silver chloride after immersion of silver-containing textiles in biological media was previously reported (Impellitteri et al., Citation2009; Stefaniak et al., Citation2014). Stefaniak et al. (Citation2014) suggested that silver chloride binding on nanoparticles surface is more likely than silver chloride precipitation. The presence of sulfur in silver aggregates might reflect silver binding to cysteine residues of skin proteins as, for example, keratin which is highly abundant in the SC (van der Zande et al., Citation2012). Our findings are consistent with previous studies, which reported the presence of silver compounds (Ag–S and Ag–Se) in different organs after oral exposure to CH3CO2Ag and AgNO3 (Loeschner et al., Citation2011; Liu et al., Citation2010). Furthermore, the formation of Ag–S and Ag–Se in the skin was also reported in argyria patients (Massi & Santucci, Citation1998). Presence of silver agglomerates in the SC is consistent with our parallel in vitro study with the same textile in which silver and silver chloride aggregates of sizes of up to 1 μm were identified both in the epidermis and dermis (Bianco et al., Citation2015).
To date, there are very few in vivo studies investigating penetration of AgNPs in human skin after topical application (George et al., Citation2014; Prow et al., Citation2011; Zhu et al., Citation2015) and some papers reported the penetration of AgNPs in burned skin (Rigo et al., Citation2013; Trop et al., Citation2006; Vlachou et al., Citation2007; Wang et al., Citation2009). Consistently with our results, George et al. (Citation2014) showed the presence of silver clusters up to 750 nm in size below the epidermis after the five-day dermal exposure of 16 healthy subjects to nanocrystaline silver dressing. Prow et al. (Citation2011) reported by using reflectance confocal microscopy the presence of AgNPs aggregates in furrows and hair follicles after treatment with an AgNPs spray. In a recent study, Zhu et al. (Citation2015) showed by using a sensitive surface-enhanced Raman scattering that the penetration depth of coated AgNPs (70 ± 20 nm) can exceed the SC. As in that study AgNPs were coated thus preventing oxidation to silver ions, it confirms that next to Ag ions also AgNPs can penetrate through the SC. Though, as stated by the authors it was not clear whether the presence of AgNPs is caused by the penetration of AgNPs through the SC or by the measurements inside the hair follicle. Some authors state that the skin penetration of nanoparticles larger than several nm through the intercellular space is not possible due to the small dimensions of the lipid bilayers which are the principal penetration route for most of chemicals (Watkinson et al., Citation2013). In the present study, we did not observe localization of the aggregates along the hair follicles. Furthermore, especially in the deeper SC, the aggregates were present on the cell surface.
The aggregation of silver in the SC might explain the low penetration of silver that we previously found both in our parallel in vitro and in vivo studies with the same textile (Bianco et al., Citation2015; Pluut et al., Citation2015). This is also consistent with a study of George et al. (Citation2014), which reported low serum and urinary levels of silver after topical application of a nanosilver textile (10–40 nm) although silver NPs have been found below epidermis (George et al., Citation2014).
Considering main application of silver garments i.e. combating microorganisms on the skin surface, the retention of silver in the SC due to aggregation might be beneficial. Formed silver aggregates in the SC can be seen as reservoir for silver ions that could prolong the antibacterial effect in the skin. As the aggregates are of μm size, they will not be able to penetrate further and will eventually be removed from the SC by desquamation. In that way, the formation of aggregates can be seen as a detoxification pathway as less silver will reach the systemic circulation. On the other side, the risk of local effects (e.g. pro-inflammatory effect) of silver in the skin will theoretically be increased. However, in our accompanied in vivo study we did not find the changes in the inflammatory IL-1 cytokines in the SC (Pluut et al., Citation2015).
Previously, Larese et al. (Citation2009) showed significant differences between intact and damaged skin permeation of Ag NPs dispersed in synthetic sweat. Thus, we expected a higher penetration of Ag NPs through atopic skin since it is known that the SC of AD patients has a reduced barrier function. However, in the present study, there was no striking difference between the atopics and non-atopics concerning the number and size of the particles and their abundance at different depths. This was also consistent with our parallel study on silver uptake, which did not show a significant difference in silver percutaneous absorption between atopic and healthy skin. It has to be noted that the number of subjects in this study was limited and the number and size of the particles at certain depths has not been assessed entirely in a systematic manner. Though, as a rule minimal three measurements on randomly chosen locations have been done per tape so we assume that the results are representative.
Conclusion
The silver garment tested in this study contains silver particles of nano and micro size. The released silver is able to penetrate into and across the SC. No differences in pattern concerning the size and amount of particle between controls and AD patients have been revealed although this might be related to the mild form of the disease in the included AD patients (most patients had quiescent dermatitis).
The large size of silver aggregates found in the deeper layers of SC suggests that their formation occurs in the skin. The presence of these aggregates likely slows down penetration of silver into viable layers however by forming a reservoir of Ag ions this might lead to longer retention of silver in the skin. The combination of AFM and SEM-EDX used in this study seems promising for the characterization of the penetration of NP across the skin.
Declaration of interest
This work is partly funded by NanoNext.nl, a micro- and nanotechnology consortium of the Dutch Government and 130 partners. Sanja Kezic received in the past funding from Argentum Medical company which provided the garment samples for this study but Argentum Medical had no involvement in the present study. All authors declared no conflict of interest.
Acknowledgments
The authors would like to acknowledge the contribution of the COST Action StanDerm. This work is partly funded by NanoNext.nl, a micro- and nanotechnology consortium of the Dutch Government and 130 partners. The garment samples were kindly provided by Argentum Medical. The findings and conclusions in this report are those of the author and do not necessarily represent the views of the National Institute for Occupational Safety and Health.
References
- Arbabi Bidgoli S, Mahdavi M, Rezayat SM, Korani M, Amani A, Ziarat I. 2013. Toxicity Assessment of Nanosilver Wound Dressing in Wistar Rat. Acta Medica Iranica 51:203–8
- Ansari MA, Khan HM, Khan AA, Malik A, Sultan A, Shahid M, et al. 2011. Evaluation of antibacterial activity of silver nanoparticles against MSSA and MRSA on isolates from skin infections. Biol Med 3:141–6
- Bianco C, Kezic S, Crosera M, Svetličić V, Šegota S, Maina G, et al. 2015. In vitro percutaneous penetration and characterization of silver from silver-containing textiles. Int J Nanomedicine 10:1899–908
- Bronaugh RL, Stewart RF. 1985. Methods for in vitro percutaneous absorption studies V: permeation through damaged skin. J Pharm Sci 74:1062–6
- Ercegović S, Ražić SE, Čunko R, Svetličić V, Šegota S. 2011. Application of AFM for identification of fibre surface changes after plasma treatments. Mat Technol 26:146–52
- George R, Merten S, Wang TT, Kennedy P, Maitz P. 2014. In vivo analysis of dermal and systemic absorption of silver nanoparticles through healthy human skin. Australas J Dermatol 55:185–90
- Impellitteri CA, Tolaymat TM, Scheckel KG. 2009. The speciation of silver nanoparticles in antimicrobial fabric before and after exposure to a hypochlorite/detergent solution. J Environ Qual 38:1528–30
- Jain J, Arora S, Rajwade JM, Omray P, Khandelwal S, Paknikar KM. 2009. Silver nanoparticles in therapeutics: development of an antimicrobial gel formulation for topical use. Mol Pharm 6:1388–401
- Jakasa I, Verberk MM, Bunge AL, Kruse J, Kezic S. 2006. Increased permeability for polyethylene glycols through skin compromised by sodium lauryl sulphate. Exp Dermatol 15:801–7
- Jakasa I, Verberk MM, Esposito M, Bos JD, Kezic S. 2007. Altered penetration of polyethylene glycols into uninvolved skin of atopic dermatitis patients. J Invest Dermatol 127:129–34
- Jensen LB, Petersson K, Nielsen HM. 2011. In vitro penetration properties of solid lipid nanoparticles in intact and barrier-impaired skin. Eur I. Eur J Pharm Biopharm 79:68–75
- Keck CM, Schwabe K. 2009. Silver-nanolipid complex for application to atopic dermatitis skin: rheological characterization, in vivo efficiency and theory of action. J Biomed Nanotechnol 5:428–36
- Keck CM, Anantaworasakul P, Patel M, Okonogi S, Singh KK, Roessner D, et al. 2014. A new concept for the treatment of atopic dermatitis: silver-nanolipid complex (sNLC). Int J Pharm 462:44–51
- Kezic S, Nielsen JB. 2009. Absorption of chemicals through compromised skin. Int Arch Occup Environ Health 82:677–88
- Kim KJ, Sung WS, Moon SK, Choi JS, Kim JG, Lee DG. 2008. Antifungal effect of silver nanoparticles on dermatophytes. J Microbiol Biotechnol 18:1482–4
- Korani M, Ghazizadeh E, Korani SH, Hami Z, Mohammadi- Bardbori A. 2015. Effects of silver nanoparticleson human health. Eur. J. Nanomed 7:51–62
- Korani M, Rezayat SM, Gilani K, Arbabi Bidgoli S, Adeli S. 2011. Acute and subchronic dermal toxicity of nanosilver in guinea pig. Int J Nanomed 6:855–62
- Labouta HI, El-Khordagui LK, Krausc T, Schneider M. 2011. Mechanism and determinants of nanoparticle penetration through human skin. Nanoscale 3:4989–99
- Lademann J, Jacobi U, Surber C, Weigmann HJ, Fluhr JW. 2009. The tape stripping procedure – evaluation of some critical parameters. Eur J Pharm Biopharm 72:317–23
- Lademann J, Richter H, Teichmann A, Otberg N, Blume-Peytavia U, Luengob J, et al. 2007. Nanoparticles—an efficient carrier for drug delivery into the hair follicles. Eur J Pharm Biopharm 66:159–64
- Larese FF, D’Agostin F, Crosera M, Adami G, Renzi N, Bovenzi M, Maina G. 2009. Human skin penetration of silver nanoparticles through intact and damaged skin. Toxicology 255:33–7
- Lieb LM, Ramachandran C, Egbaria K, Weiner N. 1992. Topical delivery enhancement with multilamellar liposomes into pilosebaceous units: I. In vitro evaluation using fluorescent techniques with the hamster ear model. J Invest Dermatol 99:108–13
- Liu J, Sonshine DA, Shervani S, Hurt RH. 2010. Controlled release of biologically active silver from nanosilver surfaces. ACS Nano 4:6903–13
- Loeschner K, Hadrup N, Qvortrup K, Larsen A, Gao X, Vogel U, et al. 2011. Distribution of silver in rats following 28 days of repeated oral exposure to silver nanoparticles or silver acetate. Part Fibre Toxicol 8:18
- Martinez-Castanon GA, Nino-Martinez N, Martinez-Gutierrez F, Martinez-Mendoza JR, Ruiz F. 2008. Synthesis and antibacterial activity of silver nanoparticles with different sizes. J Nanopart Res 10:1343
- Massi D, Santucci M. 1998. Human generalized argyria: a submicroscopic and X-ray spectroscopic study. Ultrastruct Pathol 22:47–53
- Mohammed D, Yang Q, Guy RH, Matts PJ, Hadgraft J, Lane ME. 2012. Comparison of gravimetric and spectroscopic approaches to quantify stratum corneum removed by tape-stripping. Eur J Pharm Biopharm 82:171–4
- Oriňáková R, Škantárová L, Oriňák A, Demko J, Kupková M, Andersson JT. 2013. Electrochemical deposition of SERS active nanostructured silver films. Int J Electrochem Sci 8:80–99
- Pletikapić G, Žutić V, Vinković Vrček I, Svetličić V. 2012. Atomic force microscopy characterization of silver nanoparticles interactions with marine diatom cells and extracellular polymeric substance. J Mol Recognit 25:309–17
- Pluut O, Bianco C, Jakasa I, Visser MI, Krystek P, Larese-Filon F, et al. 2015. Percutaneous penetration of silver from a silver containing garment in healthy volunteers and patients with atopic dermatitis. Tox Lett 235:116–22
- Prow TW, Grice JE, Lin LL, Faye R, Butler M, Becker W, et al. 2011. Nanoparticles and microparticles for skin drug delivery. Adv Drug Deliv Rev 63:470–91
- R Core Team. 2013. A language and environment for statistical computing. R Foundation for Statistical Computing, Vienna, Austria. Available at: http://www.R-project.org/
- Rigo C, Ferroni L, Tocco I, Roman M, Munivrana I, Gardin C, et al. 2013. Active silver nanoparticles for wound healing. Int J Mol Sci 14:4817–40
- Schaefer H, Lademann J. 2001. The role of follicular penetration. A differential view. Skin Pharmacol Appl Skin Physiol 14:23–7
- Stefaniak AB, Duling MG, Lawrence RB, Thomas TA, LeBouf RF, Wade EE, Virji MA. 2014. Dermal exposure potential from textiles that contain silver nanoparticles. Int J Occup Environ Health 20:220–34
- Trop M, Novak M, Rodl S, Hellbom B, Kroell W, Goessler W. 2006. Silver-coating dressing acticoat caused raised liver enzymes and argyria-like symptoms in burn patient. J Trauma 60:648–52
- van der Zande M, Vandebriel RJ, Van Doren E, Kramer E, Rivera ZH, Serrano-Rojero CS, et al. 2012. Distribution, elimination, and toxicity of silver nanoparticles and silver ions in rats after 28-day oral exposure. ACS Nano 6:7427–42
- Vlachou E, Chipp E, Shale E, Wilson YT, Papini R, Moiemen NS. 2007. The safety of nanocrystalline silver dressings on burns: a study of systemic silver absorption. Burns 33:979–85
- Wang XQ, Chang HE, Francis R, Olszowy H, Liu P-Y, Kempf M, et al. 2009. Silver deposits in cutaneous burn scar tissue is a common phenomenon following application of a silver dressing. J Cutan Pathol 36:788–92
- Watkinson AC, Bunge AL, Hadgraft J, Lane ME. 2013. Nanoparticles do not penetrate human skin - a theoretical perspective. Pharm Res 30:1943–6
- Zhu Y, Choe C-S, Ahlberg S, Meinke MC, Alexiev U, Lademann J, Darwin ME. 2015. Penetration of silver nanoparticles into porcine skin ex vivo using fluorescence lifetime imaging microscopy, Raman microscopy, and surface-enhanced Raman scattering microscopy. J Biomed Opt 20:051006