
Abstract
Copper oxide (CuO) nanoparticles (NPs) and copper carbonate nanoparticles (Cu2CO3(OH)2 NPs have applications as antimicrobial agents and wood preservatives: an application that may lead to oral ingestion via hand to mouth transfer. Rats were exposed by oral gavage to CuO NPs and Cu2CO3(OH)2 NPs for five consecutive days with doses from 1 to 512 mg/kg and 4 to 128 mg/kg per day, respectively, and toxicity was evaluated at days 6 and 26. Both CuO NPs and Cu2CO3(OH)2 NPs induced changes in hematology parameters, as well as clinical chemistry markers (e.g. increased alanine aminotransferase, ALT) indicative of liver damage For CuO NPs histopathological alterations were observed in bone marrow, stomach and liver mainly consisting of an inflammatory response, ulceration, and degeneration. Cu2CO3(OH)2 NPs induced morphological alterations in the stomach, liver, intestines, spleen, thymus, kidneys, and bone marrow. In spleen and thymus lymphoid, depletion was noted that warrants further immunotoxicological evaluation. The NPs showed partial dissolution in artificial simulated stomach fluids, while in intestinal conditions, the primary particles simultaneously shrank and agglomerated into large structures. This means that both copper ions and the particulate nanoforms should be considered as potential causal agents for the observed toxicity. For risk assessment, the lowest bench mark dose (BMD) was similar for both NPs for the serum liver enzyme AST (an indication of liver toxicity), being 26.2 mg/kg for CuO NPs and 30.8 mg/kg for Cu2CO3(OH)2 NPs. This was surprising since the histopathology evidence demonstrates more severe organ damage for Cu2CO3(OH)2 NPs than for CuO NPs.
Introduction
Materials such as wood need to be protected against degradation induced by fungi, bacteria and insects in order to prolong their use duration. Copper (Cu) is the most widely used fungicide for treating wood in contact with the soil, with no satisfactory alternative available since it is the only biocide that shows significant effects against soft rot fungi and other soil borne fungi. Cu is necessary for in-ground timber structures (use class 4 i.e. timber treated to make it suitable to be used in direct soil or water contact) and is a preferred antimicrobial wood preservative due to its minimal effect on mammals, including humans, even though it shows a relatively high toxicity against aquatic communities (Lebow and Foster Citation2005; Freeman and McIntyre Citation2008). Application occurs via impregnation techniques under high pressure and via non-pressure techniques like brushing, spraying, and coat-cutting (Lebow and Foster Citation2005). Solid copper carbonate (Cu2CO3(OH)2) needs to be micronized by milling to generate particle sizes able to penetrate to the centimeters depths required into the wood during pressure treatment. The resulting size distributions of micronized copper formulations contain a considerable fraction of nanoparticles. Woods impregnated with micronized Cu are reported to release no other Cu species than Cu ions (Pantano et al. Citation2018). At equal Cu loading per cubic meter of wood, the form and the rate of Cu release are comparable with wood impregnated with molecular Cu − amine. However, micronized Cu was slightly more stable throughout aging which was attributed to the transformations during the wood use (Pantano et al. Citation2018). In comparison with solutions of aqueous copper amine (ACA)-treated woods, the micronized copper-treated woods feature a lower corrosive potential, a natural wood color, and at least the same effectiveness of protection against fungal decomposition (Lebow and Foster Citation2005; Freeman and McIntyre Citation2008; Cookson et al. Citation2010; Akhtari, Taghiyari, and Kokandeh Citation2013; Platten et al. Citation2014). However, the use of nanoparticle-containing copper formulations has led to concerns regarding their safety in general (Clausen Citation2007; Evans, Matsunaga, and Kiguchi Citation2008, Kartal, Green, and Clausen Citation2009; Civardi et al. Citation2016) and specifically by hand-to-mouth transfer during installation or use of wooden installations (Platten et al. Citation2016). To the best of our knowledge, there are no publications available on oral toxicity of micronized Cu2CO3(OH)2, whereas the oral toxicity of Cu ions is extremely well known with an acceptable drinking water standard of 1.3 mg/L (ATSDR, Citation2013). Potential transformation between particulate and ionic forms of copper is likely, because leaching studies have indicated that the very acidic stomach fluids extract Cu ions from wood treated with micronized copper (Wang et al. Citation2013; Santiago-Rodríguez et al. Citation2015).
Results from in vivo studies indicate that lung inflammation and toxicity after inhalation of CuO NPs (identical to those used in this study) resolved over 3 weeks (Gosens et al. Citation2016) indicating a rapid recovery, with very little if any Cu remaining in the body of these animals. In a different study, systemic organ toxicity was observed after repeated intraperitoneal administration of CuO NPs (Privalova et al. Citation2014). For Cu nanoparticles, in vivo liver and kidney toxicity was reported in mice and rats after oral administration (Chen et al. Citation2006; Lei et al. Citation2008; Sarkar et al. Citation2011; Liao and Liu Citation2012).
The aim of this study was to compare the toxicity of CuO NPs and Cu2CO3(OH)2 NPs following short-term repeated oral exposure and to determine the Bench Mark Dose (BMDlow) for this short-term exposure duration.
Materials and methods
Test material
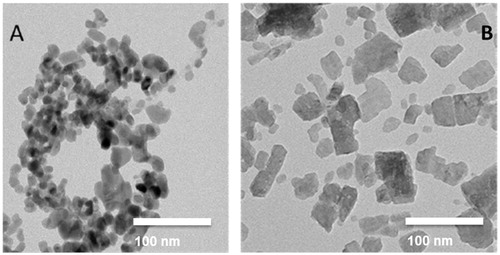
CuO–NPs were obtained as a black powder from PlasmaChem, GmbH (Berlin, Germany). The crystalline material exhibited a size of 15–20 nm, a specific surface area of 47 m2/g as assessed by the Brunauer–Emmett–Teller (BET) method and a density of 6.3 g/cm3 according to the manufacturer’s datasheet. The particles were crystalline with a density little below bulk (6.3 g/cm3). An extensive characterization is presented in Pantano et al. (Citation2018). Cu2CO3(OH)2 NPs were obtained as an aqueous dispersion from BASF SE, identification number LP 17206 (30% Cu), lot nr VM3041, best before date 05.02.2017. shows a representative example of CuO nanoparticles in water (Gosens et al. Citation2016) and Cu2CO3(OH)2 NPs in water.
Figure 1. (A) TEM image of nano-sized CuO NP. (B) TEM image of Cu2CO3(OH)2 NP.
CuO NP and Cu2CO3(OH)2 NP dispersions
Milli-Q water was used to disperse the CuO NP powder and to dilute the Cu2CO3(OH)2 NP suspensions before sonication for 16 min in a waterbath (Elmasonic S100) at room temperature. Before each administration, the nanoparticle dispersion was evaluated by CPS Disc Centrifuge™ (CPS Instruments Europe, Oosterhout, The Netherlands) to determine nanoparticle size and size distribution. Both the CuO NP and the Cu2CO3(OH)2 NP dispersions remained stable for up to 24 and 72 h, respectively. Representative results are presented in Supplementary Figure 1.
Dissolution of CuO NP and Cu2CO3(OH)2 NP
A dynamic flow-through system (Wohlleben et al. Citation2017) was used to determine the dissolution rate of both CuO NP and Cu2CO3(OH)2 NP far from equilibrium. The solid mass of 1 mg of Cu (that is 1.25 mg of CuO powder or 3.47 mg of the Cu2CO3(OH)2 suspension) was weighed onto a membrane (cellulose triacetate, Sartorius Stedim Biotech GmbH, Goettingen, Germany: 47 mm diameter, 5 kDa pore size), topped by another identical membrane, and enclosed in flow-through cells. Two complex buffers with standardized composition were used to mimic the stomach and intestine conditions at 37 ± 0.5 °C (Marques, Loebenberg, and Almukainzi Citation2011). For the stomach, the buffer was pH 1.6 and consisted of sodium taurocholate 0.08 mM, lecithin 0.02 μM, pepsin 0.1 mg/mL, and sodium chloride 34.2 mM. For the intestine conditions, the buffer was pH 5.8 and consisted of Fed-State Simulated Intestinal Fluid (FeSSIF) (Jantratid et al. Citation2008): Sodium taurocholate 10 mM, lecithin 2 mM, maleic acid 55.02 mM, sodium hydroxide 81.65 mM, sodium chloride 125.5 mM, glyceryl monocholate 5 mM, and sodium oleate 0.8 mM.
The eluates were determined by inductively coupled plasma-optical emission spectrometry (ICP-OES, Agilent 5100, Agilent Technologies, Palo Alto, CA). After the experiment, the remaining solids were rinsed off the membrane by particle-free water (Milli-Q). The resulting suspension was then pelleted onto a TEM grid held at the bottom of a centrifuge vial within 1 h, then dried, so that the morphology of the remaining solids could be inspected without interference from drying artifacts of bile salts, which are removed by this preparation. The remaining solids were analyzed by 200 keV bright-field TEM (Tecnai G2-F20ST or Tecnai Osiris, FEI Company, Hillsboro, USA).
Experimental design
Male-specific pathogen-free rats (RjHan:WI) aged 8–9 weeks were obtained from Janvier Labs (Le Genest-Saint-Isle, Saint Berthevin, France). The animals were treated via oral gavage for 5 d (days 1–5). The NPs were administered by oral gavage using a bulb tipped gavage needle attached to a syringe. Each treatment was administered as 0.1 mL per 20 g (1 mL per 200 g). For both CuO NPs and Cu2CO3(OH)2 NPs, each dose group consisted of eight animals of which four were sacrificed at day 6 (1 d after the last treatment) and four were sacrificed at day 26 (21 d after the last treatment). The day 26 time point was included in order to evaluate recovery, possible persistence of effects or progression of effects induced by the NPs. See Supplementary Table 1 for the experimental design of the study. This study design is inspired by the Short-Term Inhalation Study (STIS) protocol published by Klein et al. (Citation2012) and used by Gosens et al. (Citation2016) to investigate the respiratory effects of CuO NPs.
Assuming that the CuO NPs would be largely dissolved in the acid environment of the stomach a starting dose of CuO NPs was selected based on the literature for dissolved CuSO4. The no-observed-adverse-effect-level (NOAEL) for CuSO4 was reported to be 16.3 mg/kg b.w. (ECHA Citation2008). A pilot study was conducted with two animals with a dose of 64 mg/kg b.w. (days 1–5 daily). Based on observations from the pilot study, the doses administered in the subsequent study were vehicle control, 1, 2, 4, 8, 16, and 32 mg/kg b.w. CuO NPs. These doses were selected to be below and above the reported NOAEL for CuSO4 (Hébert Citation1993). In an additional study, one group of animals (n = 4) was treated with a high dose of 512 mg/kg b.w.
For Cu2CO3(OH)2 NPs, a pilot study according to OECD TG 425 was performed to determine the starting dose in the 5 d oral gavage toxicity study (OECD Citation2008). One animal was treated orally with a single dose of Cu2CO3(OH)2 NP. If no toxicity was observed, the dose was increased in the next animal until a toxic response was noted. When a single animal showed a toxic response an additional four animals were administered with the same dose. The highest dose chosen for Cu2CO3(OH)2 NP was 128 mg/kg b.w. Cu2CO3(OH)2 NPs were administered via gavage in the 5 d oral study as 4, 8, 16, 32, 64, and 128 mg/kg b.w. or as vehicle control.
Histopathology
At days 6 and 26, animals were killed by exsanguination from the abdominal aorta during anesthesia by isoflurane (3.5% in oxygen) inhalation. General macroscopic post mortem examinations were performed on all animals. At the time of necropsy, the following tissues and organs were collected and fixed in 4% neutral buffered formaldehyde (10% formalin): heart, lung, thymus, liver, spleen, kidney, testes, brain, mesenteric lymph node, adrenal glands, pancreas, prostate, seminal vesicles, epididymis, thyroid gland, skeletal muscle – quadriceps, stomach, duodenum, jejunum, ileum, Peyer’s patches, cecum, colon, rectum, skin, popliteal lymph node, femur with bone marrow, and peripheral nerve.
Microscopic examination of routinely prepared hematoxylin–eosin-stained paraffin sections was performed on heart, lungs, thymus, stomach, duodenum, jejunum, ileum, Peyer’s patches, cecum, colon, rectum, liver, spleen, mesenteric lymph nodes, kidneys, adrenal glands, brain, testis (unilateral), and femur with bone marrow. Microscopy was performed on all control groups, animals treated with CuO NPs at 32, 64, and 512 mg/kg b.w. and for Cu2CO3(OH)2 NPs-treated animals at 64 and 128 mg/kg b.w.
The animal data and macroscopic findings were manually entered into the computer system PathData®. Histopathological changes of examined sections were described according to distribution, severity, and morphological character. Severity scores for histopathology were assigned as follows.
Present, alteration present, severity not scored; Grade 1, alteration present as minimal/very few/very small size; Grade 2, alteration present as slight/few/small size; Grade 3, alteration present as moderate/moderate number/moderate size; Grade 4, alteration present as marked/many/large size; Grade 5, alteration present as massive/extensive number/extensive size; N.A.D., no abnormality detected.
Hematology
On days 6 and 26, blood was collected in EDTA-coated tubes. Hematological parameters included WBC count, RBC count, hemoglobin (Hb), hematocrit (Ht), mean corpuscular volume (MCV), mean corpuscular hemoglobin (MCHC), and platelet (PLT) count. All hematology parameters in the blood samples were determined in an Advia 120 Hematology Analyzer (Siemens Health Care, Berlin, Germany) according to the manufacturer’s instructions. In addition, blood smears were prepared for visual evaluation depending on the results obtained with the hematology analyzer.
Bone marrow
Bone marrow cells were collected by flushing 4 ml impuls cytometer fluid through the left femur. The concentration of nucleated cells was determined in a Coulter Counter.
Clinical chemistry
After collection of blood serum and storage at –20 °C, the following parameters were determined: albumin (ALB), alkaline phosphatase (ALP), alanine aminotransferase (ALT), aspartate aminotransferase (AST), gamma-glutamyl transpeptidase (GGT), amylase (AMY), creatinine kinase (CK), lactate dehydrogenase (LDH), sodium (Na), potassium (K), glucose (GLU), urea, creatinine (CRE), cholesterol (CHOL), and total protein (TP). All clinical chemistry parameters in the serum samples were determined in an automatic analyzer Unicel DxC 800 Synchron Clinical Systems (Beckman Coulter Nederland B.V., Woerden, The Netherlands).
Cu determination in organs
The acid mixture used for organ sample digestion included HNO3 (trace select ultra 69%, Sigma-Aldrich, St. Louis, MO <0.5 µg/kg) and H2O2 (trace select ultra 30%, Sigma-Aldrich, St. Louis, MO <0.05 µg/kg) in a 2:1 ratio. The microwave system ETHOS 1600 (Milestone S.r.l., Sorisole, Italy) was used to digest the samples, following a dedicated heating programme (1 min 250 W, 1 min 0 W, 5 min 250 W, 3 min 400 W, and 3 min 600 W). Afterwards, the samples were allowed to cool for 30 min at room temperature. The obtained solutions were transferred into PTFE tubes and diluted to 25 mL with MilliQ water. For determination of the Cu content, an aliquot of each sample was properly diluted and analyzed by inductively coupled plasma mass spectrometry equipped with a single channel Universal Cell (sp-ICP-MS NexION 350XXD, Perkin Elmer, Waltham, MA). Isotope 65Cu was selected to quantify Cu because of the lower polyatomic interferences (e.g. 40Ar23Na) compared with the isotope 63Cu. Moreover, to decrease interferences Kinetic energy discrimination (KED) was employed, using He as a collision gas. Samples were quantified by an external calibration method using a multi-point curve (blank and 10 points over the concentration range from 0.5 µg/L to 5000 µg/L). Yttrium at 5 µg/L was used as an internal standard.
Potential contamination from the laboratory was controlled by adding at least one reagent blank during each digestion session. The limit of detection (LOD) and the limit of quantification (LOQ) were calculated for each sample, and set as the average of blanks +3 standard deviation (SD) and as the average of blanks +10 SD, respectively. In order to verify the accuracy and repeatability of the method, six aliquots of the standard reference material (SRM) bovine liver (NIST 1577c, National Institute of Standards and Technology, Gaithersburg, MD) were analyzed after every 10 samples. The average Cu concentration detected in the SRM was 277 ± 5 mg/kg, which is in agreement with the reference value (262 ± 2 mg/kg). Average blank values, LOD, and LOQ were calculated by considering both the reagent and the control blanks. Detected LOD and LOQ values were 20 ng/L and 68 ng/L, respectively. Copper concentration in tissues and organs from rats exposed to CuO NPs and Cu2CO3(OH)2 NPs was expressed on a dry weight basis,
Statistical analysis
Effects of the CuO NPs and Cu2CO3(OH)2 NPs on various parameters in the orally exposed animals were initially compared with vehicle control animals using ANOVA for dose–response evaluation and a one sided Student’s T-test for group differences. Further dose response analysis was performed with Bench Mark Dose (BMD) evaluation using PROAST (version 60.1, www.rivm.nl/proast). Dose–response models were fitted to the data and a benchmark response (BMR) was defined. The 90%-confidence interval was derived from the fitted model as previously described (De Jong et al. Citation2013; Gosens et al. Citation2015), resulting in a lower and upper limit (BMDlow at 5% and BMDhigh at 95%, respectively) of the associated benchmark dose. The BMR or critical effect size (CES) for general and specific toxicity endpoints was chosen as 5% deviation of the control values. In this study, consensus default BMR values were used as proposed by the European Food Safety Authority (EFSA Citation2009).
Results
Particle dissolution and transformation
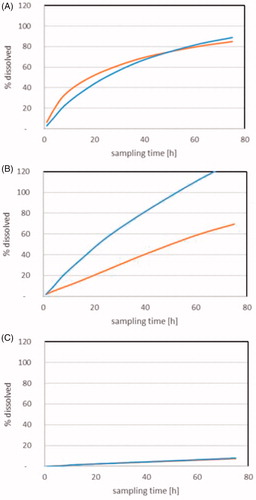
CuO NPs and Cu2CO3(OH)2 NPs dissolve almost completely under stomach conditions at pH1.6 within 72 h (). During that time, the ion-resolved dissolution rate was very similar for both materials with 50% dissolved after about 16 h for both materials (). As this time is longer than the residence time in the stomach, this suggests dissolution in the stomach will be incomplete, and so we tested the dissolution at pH 5.8 in conditions representative of the intestine. Here we observed that the dissolution is incomplete, although transformation of the particles is clearly observed via TEM (Supplementary Figure 2(f)). This includes a decrease in the size of the primary particles in conjunction with an increase in agglomerate size resulting in larger structures. The time to 50% dissolution is 20 h for micronized copper carbonate (Cu2CO3(OH)2 NPs), but 50 h for CuO NPs. Adding to this interesting difference, we observed that dissolution occurs at much lower rates in the simple GI-tract simulant medium with the NaNO3 buffer at pH 5.3 compared with the complex GI-tract simulant FeSSIF-V2 (pH 5.8) (). Thus, the dissolution in the intestine is not only pH driven but is likely to be accelerated by the bile salts and other physiological substances, in complete analogy to the interactions observed under environmental dissolution and transformation of Cu NPs (Adeleye et al. Citation2014; Keller et al. Citation2017). The effect of dissolution on nanoparticle morphology in stomach fluid simulant and complex intestinal fluid simulant is shown in Supplementary Figure 2.
Figure 2. Dissolution of Cu2CO3(OH)2 NPs (blue) and CuO NPs (orange) during flow-through testing at 37 °C. A pH1.6 stomach simulant. B. pH 5.8 GI-tract simulant FeSSIF V2. C. pH 5.4 simple medium 0.1 NaNO3. Quantification of ions was by ICP-OES.
General observations
CuO NP: During the study of doses up to 32 mg/kg b.w. there were no premature deaths in the study or overt signs of toxicity, such as reduced body or organ weights (Supplementary Table 2(A,B)). In addition, no treatment-related findings were observed at the macroscopic observation level at autopsy. Due to the lack of effects observed, the higher dose of 512 mg/kg b.w. was investigated. The 512 mg/kg b.w. dose induced slight weight loss in one animal after 2 d of treatment and diarrhea after 3 d of administration. After 4 d of administrations, two animals showed diarrhea.
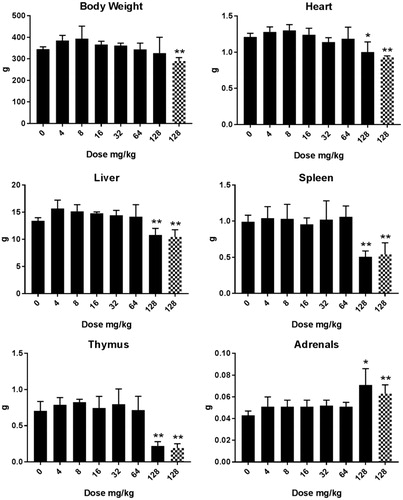
Cu2CO3(OH)2 NP: Repeated oral administration of a dose of 128 mg/kg b.w. Cu2CO3(OH)2 NPs induced severe toxic responses in the animals as indicated by the behavior of the animals, including frequent washing and piloerection. For this reason, the animals which had been scheduled for autopsy at day 21 after treatment were instead autopsied prematurely at days 6 and 7. At these times, a decrease in organ weight was observed for heart, liver, spleen, and thymus whereas the adrenal glands showed an increase in weight (, Supplementary Table 2(C)). The most severe decrease in organ weight was noted for the spleen and thymus, with approximately 45% and 70% loss, respectively. For doses up to 64 mg/kg b.w. both body and organ weight determined at day 26 showed no changes compared with the vehicle-treated animals (Supplementary Table 2(D)).
Figure 3. Body and organ weight (g) in male rats after five days consecutive oral administration of Cu2CO3(OH)2 NPs. Analysis of tissues was conducted at day 6/7 (24/48 hours after the last administration). The number of animals per group were 4 (n = 4). Two groups of the dose group of 128 mg/kg b.w. are presented for autopsy at days 6/7 after treatment. For one group (blocked columns) an unscheduled autopsy was conducted due to the poor condition of the animals intended for recovery group. Significant differences compared to vehicle treated animals. *p < 0.05, **p < 0.01 (ANOVA). An extended set of body weight data are presented in Supplementary Table 2(C,D).
Hematology and clinical chemistry
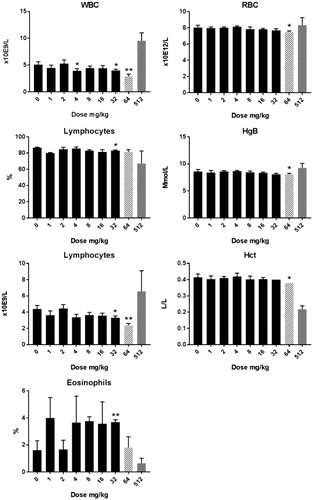
CuO NP hematology: An overview of hematological parameters that were affected by the 5 d oral administration of CuO NPs nanoparticles is presented in , whereas the extended set of hematology parameters are presented in Supplementary Table 3(A). At day 6, the total WBC count was slightly decreased at doses of 32 and 64 mg/kg b.w., whereas a two-fold increase was present at the dose of 512 mg/kg b.w. (). In addition, in the animals treated with 64 mg/kg b.w. CuO NPs some red blood cell parameters (number of red blood cells, hemoglobin content, and hematocrit) were slightly decreased. For the doses evaluated up to 32 mg/kg b.w., all white and red blood cell parameters returned to values similar to control vehicle treated animals at day 26 (Supplementary Table 3(B)). At day 6, there was no treatment-related effect on the cellularity of the bone marrow (Supplementary Table 4).
Figure 4. Hematology in male rats after five days consecutive oral administration of CuO NPs. Analysis was conducted at day 6 (24 hours after the last administration). The animals treated with a dose of 512 mg/kg were an extra group which were treated subsequently and without a concurrent control. Significant differences with vehicle treated animals were determined by ANOVA for the dose response study followed by a one sided students t-test between groups. *p < 0.05, **p < 0.01, ***p < 0.01. An extended set of hematology parameters are presented in Supplementary Table 3(A,B).
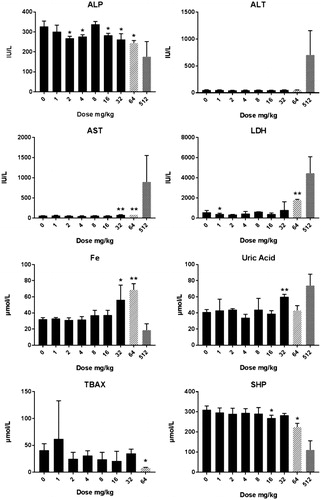
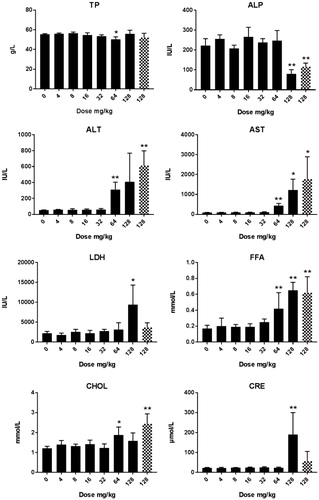
CuO NP: Clinical chemistry: At day 6, alterations in the level of alkaline phosphatase (ALP) and aspartate aminotransferase (AST) enzymes indicated the presence of liver toxicity (). At the dose of 64 mg/kg b.w., lactate dehydrogenase (LDH) levels were also increased indicating cell and organ damage. This was further confirmed by the high increase for the 512 mg/kg b.w. dose. All clinical chemistry data are presented in Supplementary Table 5(A). At day 26, only the ALP was significantly (p < 0.05) decreased at the 2 mg/kg b.w. dose group compared with the vehicle-treated control group (Supplementary Table 5(B)). Animals treated with 512 mg/kg showed similar alterations in clinical chemistry (low level of ALP, high level of AST, and high level of LDH) thus supporting the data of the dose–response study (Supplementary Table 5(A)). There was no effect on the cellularity of the bone marrow after treatment with CuO NPs (Supplementary Table 4).
Figure 5. Clinical chemistry in male rats after five days consecutive oral administration of CuO NPs. The data presented represent analysis at day 6 (24 hours after the last administration). The abbreviations represent: ALP: alkaline phosphatase; ALT: alanine aminotransferase; AST: aspartate aminotransferase; Fe: iron; GGT: gamma glutamyltransferase; GLU: glucose; LDH: lactate dehydrogenase; SHP: plasmatic thiol groups; TBAX: total bile acids. For all groups n = 4 with the exception of the (pilot study) dose of 64 mg/kg in which n = 2. Significant differences compared to vehicle treated animals. *p < 0.05 compared to vehicle control (ANOVA), **p < 001 compared to vehicle control (ANOVA). Animals terated with a dose of 512 mg/kg were an extra group conducted without a concurrent control. An extended set of clinical chemistry parameters are presented in Supplementary Table 5(A,B).
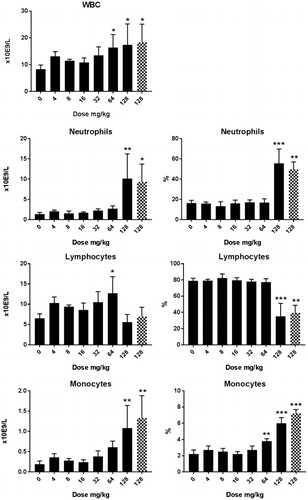
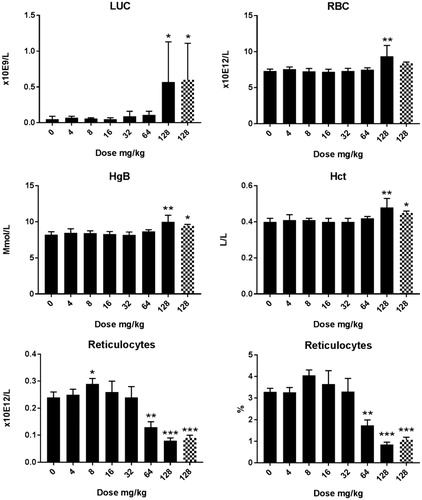
Cu2CO3(OH)2 NP hematology: Alterations in hematological parameters after 5 d oral administration of Cu2CO3(OH)2 NPs are presented in , whereas the extended set of hematology parameters are presented in Supplementary Table 3(C,D). At day 6, an increase in WBC was present for doses of 64 mg/kg b.w., which was due to an increase in lymphocytes. At 128 mg/kg b.w., the increase in WBC was mainly due to an increase in neutrophilic granulocytes. The decrease in the relative number of lymphocytes can be attributed to the increase in neutrophilic granulocytes. The absolute number of lymphocytes was not affected by the Cu2CO3(OH)2 NPs treatment at the dose of 128 mg/kg b.w. Data for day 26 are shown in Supplementary Table 3(D). At day 26, no alterations in hematological parameters were observed compared with vehicle-treated animals for the highest dose investigated (64 mg/kg b.w.). The dose of 128 mg/kg increased RBC, HgB, Hct, HDW, and LUC at day 6. In contrast, reticulocytes were decreased on treatment with doses above 64 mg/kg, while a dose of 8 mg/kg increased reticulocytes at day 6.
Figure 6. Hematology in male rats after five days consecutive oral administration of Cu2CO3(OH)2 NPs. Parameters are assessed at day 6 (24 hours after the last administration). The number of animals per group is 4 (n = 4), however, for some animal blood was not available for evaluation. An unscheduled autopsy was conducted of a 128 mg/kg dose group at days 6/7 in view of the poor condition of these animals (blocked columns, n = 3). Significant differences compared to vehicle treated animals. One sided students t-test, *p < 0.05, **p < 0.01, ***p < 0.01. An extended set of hematology parameters are presented in Supplementary Table 3(C,D).
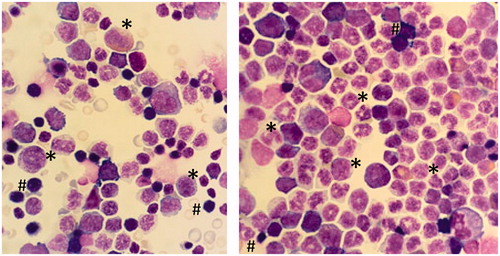
There was no effect on the cellularity of the bone marrow after treatment with Cu2CO3(OH)2 NP (Supplementary Table 4). However, microscopic evaluation of the bone marrow after treatment with 128 mg/kg b.w. indicated a significant shift from erythroid cells into myeloid cells (p < 0.01, p < 0.001), that was confirmed by histopathology (, Supplementary Table 4).
Figure 7. Cytospin preparation of bone marrow. Abundant presence of myeloid cells in the bone marrow cell population after being treated with 128 mg/kg Cu2CO3(OH)2 NPs for five consecutive days (day 1–5). The left hand image is the vehicle control (day 6), while the right hand image is the Cu2CO3(OH)2 NP treated animal on day 7. * Myeloid progenitor cells, # erythroid progenitor cells. Magnification ×500.
Cu2CO3(OH)2 NP clinical chemistry: For animals treated with Cu2CO3(OH)2 NPs ALP was decreased at day 6, while AST, ALT, and LDH were increased (). All clinical chemistry data are presented in Supplementary Table 5(C,D). The observed enzyme alterations in the blood indicate organ toxicity, including the liver. In addition, free fatty acids, creatinine, iron, and potassium levels in blood were increased. At day 26, only some incidental alterations were observed in clinical chemistry parameters and most parameters were back to levels similar to control vehicle-treated animals, while those that did show an alteration did not show a dose–response effect (Supplementary Table 5).
Figure 8. Clinical chemistry in male rats after five days of consecutive oral administration of Cu2CO3(OH)2 NPs. Parameters were assessed at day 6 (24 hours after the last administration). ALB: albumin; ALP: alkaline phosphatase: ALT: alanine aminotransferase; AST: aspartate aminotransferase; BAP: biological anto-oxidant potential; Ca: calcium; Cl: chloride; ; CHOL: cholesterol; CRE: creatinine; Fe: iron; GGT: gamma glutamyltransferase; GLU: glucose; K: potassium; LDH: lactate dehydrogenase; Na: sodium; ROM: reactive oxygen metabolites; SHP: plasmatic thiol groups; TBAX: total bile acids; TBIL: total bilirubin; TG: triglycerides; TP: total protein; TTT: total thiols. DL: detection limit. For each group of animals n = 4. An unscheduled autopsy was conducted for a dose group of 128 mg/kg (blocked columns) at days 6/7 after treatment in view of the poor condition of the animals. *p < 0.05 compared to vehicle control (ANOVA), **p<.001 compared to vehicle control (ANOVA). An extended set of clinical chemistry parameters are presented in Supplementary Table 5(C,D).

Histopathology
CuO NP: In the initial dose–response study, there were no microscopic changes observed at the highest dose of 64 mg/kg b.w. of CuO NPs evaluated (data not shown). The dose of 512 mg/kg b.w. CuO NPs induced histopathological alterations in the stomach, liver, and bone marrow (Supplementary Table 6). In the stomach, an increased incidence and severity of submucosal glandular inflammation with eosinophilic granulocytes was observed. The liver exhibited slight Kupffer cell hypertrophy/hyperplasia, inflammation composed of mixed inflammatory cells, hepatocellular hypertrophy, hepatocellular necrosis, and single cell necrosis (above the background level of minimal). Bone marrow changes included slight increased myeloid elements and decreased erythroid elements.
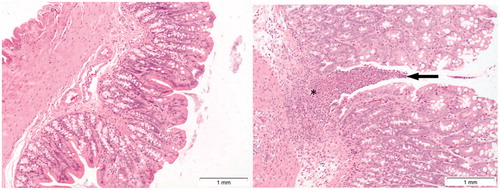
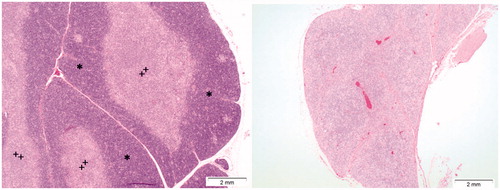
Cu2CO3(OH)2 NP: Test item-related microscopic findings were observed in a number of organs examined after treatment with 64 or 128 mg/kg b.w. Cu2CO3(OH)2 NPs. An overview is presented in Supplementary Table 6. After a 5-d oral administration of Cu2CO3(OH)2 NPs, the stomach exhibited an increased incidence and severity of submucosal glandular inflammation with eosinophilic granulocytes on day 6 () which was still present in some animals after the 3-week recovery period (Supplementary Table 6). In other parts of the GI-tract, effects were only seen at the dose of 128 mg/kg b.w. Ulceration was observed in the cecum, colon, and rectum (Supplementary Table 6). shows ulceration of colon after 5 d treatment with 128 mg/kg b.w. Cu2CO3(OH)2 NPs. Other lesions observed in the GI-tract were apoptosis (duodenum, ileum, and cecum) and edema (colon and rectum).
Figure 9. Presence of inflammation (arrows) in the submucosa of the stomach in a rat treated with a dose of 64 mg/kg b.w. of Cu2CO3(OH)2 NP for five consecutive days. Autopsy was at day 6, 1 day after the last Cu2CO3(OH)2 NP administration. The left image provides an overview, while the right image provides detail of inflammatory cells (arrows).
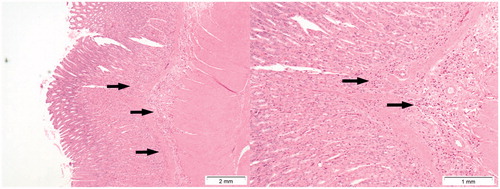
Figure 10. Presence of ulceration of colon mucosa (arrow, right image) of a rat treated with 128 mg/kg b.w. of Cu2CO3(OH)2 NPs for five consecutive days. Note severe inflammation (asterisk) and loss of colon epithelium above the area of inflammation. The autopsy was conducted at day 6, 1 day after the last Cu2CO3(OH)2 NP administration. The left image is of the colon of a vehicle treated control animal.
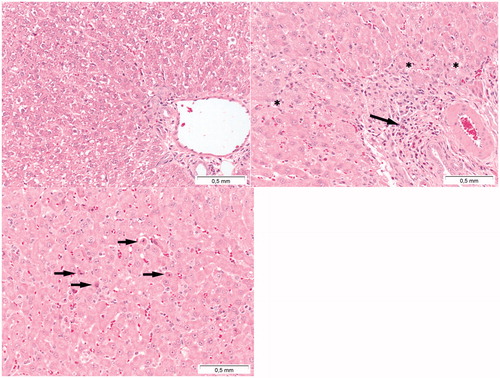
In the liver, inflammation composed of mixed inflammatory cells () occurred at day 6 in rats treated at 64 mg/kg and at 128 mg/kg. These doses also induced hepatocellular necrosis, single-cell necrosis (), increased mitosis, liver and Kupffer cell hypertrophy. In the kidneys at the 128 mg/kg, dose effects included tubular necrosis, hyaline casts in the tubules, and tubular degeneration/regeneration (Supplementary Table 6).
Figure 11. Presence of toxic effects in the liver following Cu2CO3(OH)2 NP administration. The top left image represents the liver of a vehicle control treated animal. The top right image indicates the presence of inflammation (arrow) and vacuolisation (asterisks) of liver parenchyma cells. The bottom image indicates single cell necrosis of liver cells (arrows). The autopsy was conducted at day 7, 2 days after the last Cu2CO3(OH)2 NP administration. The liver with histopathological lesions was from an animal treated with 128 mg/kg b.w. of Cu2CO3(OH)2 NPs for five consecutive days (days 1-5).
For Cu2CO3(OH)2 NPs at a dose of 128 mg/kg b.w., severe lymphoid atrophy was observed in the spleen () and thymus (). In the bone marrow, an increase in myeloid activity and a decrease in erythroid activity were observed at 128 mg/kg treatment as already indicated by the evaluation of bone marrow cell populations (, Supplementary Figure 3).
Figure 12. Presence of toxic effects in the spleen following Cu2CO3(OH)2 NPs exposure. The left image shows the histology of a normal spleen of a control animal. Note the extensive presence of lymphocytes (white pulp) (asterisks). The right image shows lymphoid atrophy as shown by the depletion of lymphocytes (white pulp) (asterisks). The right hand image is from day 6 of an animal treated with Cu2CO3(OH)2 NPs 128 mg/kg b.w. for five consecutive days (days 1-5).
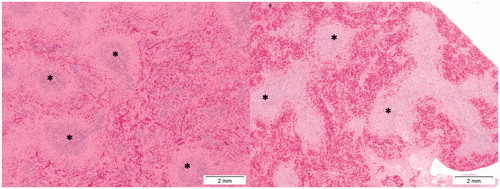
Figure 13. Effects of Cu2CO3(OH)2 NPs on the thymus. The left image shows the histology of a normal thymus of a control animal. Note the extensive presence of lymphocytes in the thymus cortex (asterisks) and medulla (plus). The right image is from day 6 of an animal treated with Cu2CO3(OH)2 NPs 128 mg/kg for five consecutive days (days 1–5). The histology shows lymphoid atrophy as shown by the low number of lymphocytes present resulting in a disappearance of demarcation between cortex and medulla.
In the testes, a moderate degeneration of germ cells (including slight multinucleated giant cells) and marked spermatid retention was observed at the 128 mg/kg dose. Also at this dose, decreased fluid was observed in the seminal vesicles of eight out of eight animals (Supplementary Table 6).
After the recovery period at day 26, the submucosal glandular inflammation with eosinophilic granulocytes remained in the stomach, whereas other histopathological alterations in the other organs were not observed at the dose of 64 mg/kg b.w., the highest dose investigated after the recovery period (Supplementary Table 6).
Organ burden
CuO NP: Rats treated with 32 mg/kg b.w. exhibited an increase in Cu content in the liver (p < 0.05) and rats treated with 64 mg/kg b.w. an increase in both liver and the mesenteric lymph node (MLN) (p < 0.001) (). Rats treated with 512 mg/kg b.w. showed an increase in Cu content in the liver, lung, kidneys, spleen, thymus, and mesenteric lymph node tissue when compared with vehicle-treated control animals of the dose response study. At day 26, animals treated with the 32 mg/kg dose exhibited Cu levels in all organs that were equivalent to the levels in the control animals.
Table 1. Cu content of organs of male rats after five consecutive days of oral administration of CuO NPs.
Cu2CO3(OH)2 NP: The Cu content of tissues after five consecutive days of Cu2CO3(OH)2 NPs oral administration is presented in . The lower dose of 64 mg/kg b.w. induced an increase in Cu content in liver, kidney, testes, brain, and thymus only. The highest dose of 128 mg/kg b.w. induced an increase in Cu content in all organs evaluated. At day 26, the increased levels of Cu in liver, thymus, and kidney for the dose of 64 mg/kg b.w. had returned to background levels whereas for the liver and testes they were still increased (p < 0.05 and p < 0.01, respectively), although the increase was limited compared with day 6.
Table 2. Cu content in organs of male rats after five consecutive days of oral administration of Cu2CO3(OH)2 NPs.
Dose–response modeling
and show a further statistical evaluation of the outcomes of the oral CuO NPs and Cu2CO3(OH)2 NPs studies, using the bench mark dose (BMD) approach with a 5% deviation of levels in vehicle control-treated animals as the bench mark. This analysis shows that for the liver enzyme AST and the red blood cell parameters (RBC, Hb, Ht), an effect could be demonstrated showing a 5% deviation from controls both for CuO NPs and Cu2CO3(OH)2 NPs. Histopathology confirmed the liver toxicity at high doses. The complete BMD analysis is presented in Supplementary Tables 7 and 8 for CuO NPs and Cu2CO3(OH)2 NPs, respectively.
Table 3. Bench mark dose calculations for toxic effects after oral CuO NPs exposure for five consecutive days.
Table 4. Bench mark dose calculations for toxic effects after oral Cu2CO3(OH)2 NPs exposure for five consecutive days.
The lowest BMD for an effect of Cu2CO3(OH)2 NPs was the effect on the liver enzyme AST with a dose of 30.8 mg/kg directly followed by the effect on liver weight (BMD 32.2 mg/kg b.w.) (). The accompanying BMDlow being the lower end of the 90% confidence interval that might be used for risk assessment was 18.8 mg/kg for an AST effect and 9.5 mg/kg b.w. for the liver weight effect.
Discussion
The present study investigated the toxicity of two Cu containing nano-formulations used for the preservation of wood products that were repeatedly administered to rodents via oral gavage in a repeated dose oral toxicity study.
Investigation of the Cu2CO3(OH)2 NPs and CuO NPs demonstrated similar dissolution characteristics in simulated stomach conditions, while in simulated intestine conditions, Cu2CO3(OH)2 NPs dissolved faster. For the stomach, both CuO NPs and Cu2CO3(OH)2 NPs exhibited approximately 50% dissolution at approximately 20 h during flow through conditions, while 100% dissolution was observed for CuSO4. Such conditions are relatively realistic for the stomach environment; however, emptying of the stomach in rats may be reached within 6 h (Qualls-Creekmore, Tong, and Holmes Citation2010). We, therefore, hypothesize that a fraction of both particle types would survive the fast pH-driven dissolution in the stomach passage. This means NPs would reach the intestines where they would undergo further transformation, with the Cu2CO3(OH)2 NPs shedding Cu ions earlier or to a greater extent than the CuO NPs. In fact, imaging of the particles after intestinal conditions with a pH 5.8 indicated shrinking of individual particle size which is indicative of dissolution, but this shrinkage was also associated with agglomeration to form relatively large structures. These data would suggest that it is relevant to consider the possible toxicological effects of both the Cu ions and the nanoparticles.
Cu accounts for about 80% of the CuO mass, about 60% in Cu2CO3(OH)2, and about 40% in CuSO4 mass. Based on these mass values and solubility data, which indicates 50% dissolution, it is possible to estimate the amount of Cu ion release in the stomach (i.e. about 40% of mass dose for CuO NPs, 30% of the mass dose for Cu2CO3(OH)2 NPs, and about 40% of mass dose for CuSO4). CuO NPs would be hypothesized to have a higher toxicity than Cu2CO3(OH)2 NPs if the mechanism of toxicity is via ion release in the stomach. However, Cu2CO3(OH)2 NPs would have higher toxicity via ions originating in the intestine in view of its high dissolution in simulant intestinal fluids. To investigate this further, a more sophisticated protocol would be to use sequential buffers (Bove et al. Citation2017) and/or simulated full diets (DeLoid et al. Citation2017). Flow-through-testing (for ease of retrieving transformed NPs, for fast time resolution on ions) could in theory be combined with sequential buffers (for added physiological realism), but that was beyond the scope of the present investigation. Although we tested the materials at relatively low concentration and out of equilibrium, saturation may have suppressed dissolution rates below the in vivo rates. In previous studies, investigating the release of Cu ions from wood treated with Cu2CO3(OH)2 NPs revealed more than 80% dissolution after 1 h at room temperature in a simple glycine simulant with pH1.5 (Santiago-Rodríguez et al. Citation2015), and only slightly longer times were suggested under environmental unsaturated conditions.(Kent and Vikesland Citation2016; Vencalek et al. Citation2016). These data are in line with our own in that it suggests the use of Cu-containing nanomaterials as a wood preservative would result in both human and environmental exposure to Cu ions.
In this study, the different Cu containing nanomaterials were administered to rodents for five consecutive days via oral gavage, before sacrificing the animals either on days 6 and 7 or on day 26 (after a 3 week recovery period). Investigation of the biodistribution of CuO NPs resulted in a detectable increase in the Cu content of the liver for doses below 512 mg/kg b.w, while at the highest dose of 512 mg/kg b.w., increased Cu levels were observed in all evaluated organs (). Similarly, oral exposure to Cu2CO3(OH)2 NPs at a dose of 128 mg/kg b.w. increased Cu levels in all organs investigated (liver, lung, kidney, spleen, thymus, mesenteric lymph node, testes, brain), whereas at a dose of 64 mg/kg b.w., Cu levels were increased in liver, kidney, thymus, testis, and brain.
In terms of toxicity, the high dose of 512 mg/kg b.w. CuO NPs induced histopathological alterations in the stomach, liver, and bone marrow. These alterations in the liver were accompanied by an increase of liver enzymes (ALT, AST) and WBC in the blood. Clinical chemistry effects were also observed at lower doses (up to 64 mg/kg b.w. CuO NPs) for which histopathological alterations were not evaluated. This suggests that liver toxicity as indicated by liver enzyme levels in serum might be useful indicators for adverse effects of nanomaterials. For CuO NPs, no impacts were observed in terms of lymphoid depletion in the spleen and thymus. Lower doses of CuO NPs at doses up to 32 mg/kg b.w. had limited toxic impacts compared with the reported toxicity of soluble Cu formulations such as CuSO4 (NOAEL of 16.3 mg/kg (Hébert Citation1993)). The partial dissolution of CuO NPs in the stomach might explain the lower toxicity.
Interestingly, Cu2CO3(OH)2 NPs were more toxic than CuO NPs when compared on the basis of dose in mg/kg b.w. After 5 d of repeated dosing with 128 mg/kg b.w., animals showed overt signs of toxicity. Both hematology and clinical chemistry indicated toxic effects at the 64 and 128 mg/kg b.w. doses. Similar to the high-dose CuO NPs clinical chemistry results, the Cu2CO3(OH)2 NPs increased levels of AST and ALT indicating liver toxicity, while LDH increases indicated cellular damage in general. Treatment with Cu2CO3(OH)2 NP also induced inflammation in the stomach, apoptosis in the duodenum, ileum, and cecum, as well as ulceration in the large intestines (cecum, colon, rectum). In the liver inflammation, apoptosis, and necrosis occurred, as well as hypertrophy which is indicative of repair of the liver. In addition, kidney degeneration/regeneration and necrosis was observed. Unlike CuO NPs, there was a marked lymphoid atrophy in spleen and thymus after the 5 d oral treatment with Cu2CO3(OH)2 NP, accompanied by an increase in myeloid activity in the bone marrow. In the spleen, both T (periarteriolar lymphoid sheath, PALS) and B cell areas (follicles) were affected at a dose of 128 mg/kg b.w. Overall, the pathology in terms of organ damage in the GI-tract, kidney, and the lymphoid organs (spleen, thymus) was more severe for Cu2CO3(OH)2 NP compared with CuO NP administration.
The dose–response effects for various toxicity indicators were further evaluated by using the BMD approach. The benchmark used was a 5% alteration compared with the vehicle control, as suggested by EFSA (Citation2009). The BMDlow is the lower end on the 90% confidence interval of the BMD for which effects larger than the BMD response are unlikely to occur, and can, therefore, be used as starting point for the risk assessment. BMDlow values of 16.1 and 18.8 mg/kg b.w. were calculated for serum AST alteration induced by CuO NPs and Cu2CO3(OH)2 NPs, respectively. These values are surprisingly similar to the NOAEL for CuSO4. For CuSO4, the Cu ion is likely the main toxicant. As suggested above, the Cu ions may also play an important role in the mechanism of Cu nanomaterial toxicity.
Privalova et al. (Citation2014) administered CuO NPs (diameter 20 nm) via the intraperitoneal route into rats. Administration was conducted three times a week applying a total of 19 injections including a total dose of up to approximately 10 mg/kg b.w. which resulted in the induction of kidney lesions. In contrast to the study by Privalova et al. (Citation2014), we did not observe histopathological lesions in kidney and spleen by CuO NPs, but we did note lesions in stomach, liver, and bone marrow after 5 d repeated oral administration of 512 mg/kg b.w. In view of the very fast dissolution of the CuO NPs used by Privalova et al. (Citation2014), it might be assumed that Cu ions were responsible for the observed toxicity. In this respect, our results on Cu2CO3(OH)2 NPs show a more widespread organ toxicity including severe cellular depletion of spleen and thymus, as well as kidney lesions which might be related to the more complete dissolution in the GI-tract and the resulting higher internal Cu ion dose at the organ level.
Toxicity of CuO NPs, presumably due to the release of Cu ions, was previously demonstrated in in vitro cellular toxicity tests for various lung-derived cells such as A549 cells, 16-HBE cells, and BEAS-2B cells (Cho et al. Citation2013; Jing et al. Citation2015; Strauch et al. Citation2017; Ude et al. Citation2017). CuO NPs were found to be more toxic compared with micrometer CuO particles (CuO-MP) and CuCl2, when comparing doses as total mass per mL in the cell culture medium (Strauch et al. Citation2017). The toxic effect was explained by a much higher Cu content in the cell (cellular cytoplasm and nucleus) after exposure to the CuO NPs compared with CuO MP and CuCl2, followed by intracellular Cu ion release. Both for Ag NPs and CuO NPs, a higher cellular content of metal (Ag and Cu) ions was observed in A549 and BEAS-2B cells compared with exposure to Ag and Cu ions in the form of AgNO3 or CuCl2, respectively (Cronholm et al. Citation2013).
Our data identified that the immune system may also be severely affected by the Cu ions released from the Cu containing nanomaterials as shown by the severe lymphoid cell depletion in spleen and thymus. This may have consequences for the functionality of the immune system as was recently demonstrated by us for silver nanoparticles (De Jong et al. Citation2013; Vandebriel et al. Citation2014). In view of the potentially high migration of nanomaterials to the spleen, the immune system may be a target for nanomaterial toxicity and needs consideration for a more specific toxicity evaluation (Dobrovolskaia, Shurin, and Shvedova Citation2016; Dusinska et al. Citation2017).
In conclusion, we observed a marked difference in the severity of the pathological lesions in various organs (e.g. GI-tract, kidney, spleen, and thymus) between CuO NPs and Cu2CO3(OH)2 NPs after oral exposure comparing dose effects in our rat study. For animals exposed to Cu2CO3(OH)2 NPs, body weight and severe organ weight loss were observed. In the spleen and the thymus, the severe weight loss was accompanied by lymphoid depletion that warrants further immunotoxicological evaluation. However, for risk assessment using the serum liver enzyme AST as an indicator of liver toxicity, the BMD with a 5% deviation of the vehicle control is 26.2 mg/kg for CuO NPs and 30.8 mg/kg for Cu2CO3(OH)2 NPs: these values are surprisingly similar. These data may be useful for deriving an acceptable daily intake for these wood preservatives which may then be used for a risk assessment including exposure scenarios.
TNAN-2018-0111-File019.docx
Download MS Word (3.8 MB)Acknowledgements
The authors would like to thank P. K. Beekhof, A. J. F Boere, L. J. J. De La Fonteyne, E. Gremmer, K. M. P. Van Den Hurk, A. De Klerk, F. Kolkman, D. L. A. C. Leseman, B. Nagarajah, J. Rigters, C. M. R. Soputan, and H. W. Verharen for valuable technical assistance, and E. Gremmer for help with the BMD analysis. Kai Werle is acknowledged for performing the dissolution experiments.
Disclosure statement
The authors report that they have no conflicts of interest. The authors alone are responsible for the content and writing of the paper.
Additional information
Funding
References
- Adeleye, A. S., J. R. Conway, T. Perez, P. Rutten, and A. A. Keller. 2014. “Influence of Extracellular Polymeric Substances on the Long-Term Fate, Dissolution, and Speciation of Copper-Based Nanoparticles.” Environmental Science and Technology 48 (21): 12561–12568. doi:10.1021/es5033426.
- Agency for Toxic Substances and Disease Registry (ATSDR). 2013. “Toxicological Profile for Copper.” Division of Toxicology/Toxicology Information Branch, Atlanta, GA, USA. http://www.atsdr.cdc.gov/toxprofiles/tp.asp?id=206&tid=37.
- Akhtari, M., H. R. Taghiyari, and M. G. Kokandeh. 2013. “Effect of Some Metal Nanoparticles on the Spectroscopy Analysis of Paulownia Wood Exposed to White-Rot Fungus.” European Journal of Wood and Wood Products 71 (2): 283–285. doi:10.1007/s00107-013-0676-5.
- Bove, P., M. A. Malvindi, S. S. Kote, R. Bertorelli, M. Summa, and S. Sabella. 2017. “Dissolution Test for Risk Assessment of Nanoparticles: A Pilot Study.” Nanoscale 9 (19): 6315–6326. doi:10.1039/C6NR08131B.
- Chen, Z., H. Meng, G. Xing, C. Chen, Y. Zhao, G. Jia, T. Wang, et al. 2006. “Acute Toxicological Effects of Copper Nanoparticles In Vivo.” Toxicology Letters 163 (2): 109–120. doi:10.1016/j.toxlet.2005.10.003.
- Cho, W.-S., R. Duffin, M. Bradley, I. L. Megson, W. MacNee, J. K. Lee, J. Jeong, and K. Donaldson. 2013. “Predictive Value of In Vitro Assays Depends on the Mechanism of Toxicity of Metal Oxide Nanoparticles.” Particle and Fibre Toxicology 10 (1): 55. doi:10.1186/1743-8977-10-55.
- Civardi, C., L. Schlagenhauf, J. P. Kaiser, C. Hirsch, C. Mucchino, A. Wichser, P. Wick, and F. W. Schwarze. 2016. “Release of Copper-Amended Particles from Micronized Copper-Pressure-Treated Wood during Mechanical Abrasion.” Journal of Nanobiotechnology 14:77. doi: 10.1186/s12951-016-0232-7
- Clausen, C. A. 2007. Nanotechnology: Implications for the wood preservation industry. Report IRG/WP 07-30415. IRG-WP International Research Group on Wood Protection, Stockholm, Sweden.
- Cookson, L. J., J. W. Creffield, K. J. McCarthy, and D. K. Scown. 2010. “Trials on the Efficacy of Micronized Copper in Australia.” Forest Products Journal 60 (1): 6–12. doi:10.13073/0015-7473-60.1.6.
- Cronholm, P., H. L. Karlsson, J. Hedberg, T. A. Lowe, L. Winnberg, K. Elihn, I. O. Wallinder, and L. Möller. 2013. “Intracellular Uptake and Toxicity of Ag and CuO Nanoparticles: A Comparison between Nanoparticles and Their Corresponding Metal Ions.” Small 9: 970–982. doi: 10.1002/smll.201201069
- De Jong, W. H., L. T. Van Der Ven, A. Sleijffers, M. V. D. Z. Park, E. H. Jansen, H. Van Loveren, and R. J. Vandebriel. 2013. “Systemic and Immunotoxicity of Silver Nanoparticles in an Intravenous 28 Days Repeated Dose Toxicity Study in Rats.” Biomaterials 34 (33): 8333–8343. doi: 10.1016/j.biomaterials.2013.06.048
- DeLoid, G. M., Y. Wang, K. Kapronezai, L. R. Lorente, R. Zhang, G. Pyrgiotakis, N. V. Konduru, et al. 2017. “An Integrated Methodology for Assessing the Impact of Food Matrix and Gastrointestinal Effects on the Biokinetics and Cellular Toxicity of Ingested Engineered Nanomaterials.” Particle and Fibre Toxicology 14: 40. doi: 10.1186.s12989-017-0221-5
- Dobrovolskaia, M. A., M. Shurin, and A. A. Shvedova. 2016. “Current Understanding of Interactions between Nanoparticles and the Immune System.” Toxicology and Applied Pharmacology 299: 78–89. doi: 10.1016/j.taap.2015.12.022
- Dusinska, M., J. Tulinska, N. El Yamani, M. Kuricova, A. Liskova, E. Rollerova, E. Rundén-Pran, and B. Smolkova. 2017. “Immunotoxicity, Genotoxicity and Epigenetic Toxicity of Nanomaterials: New Strategies for Toxicity Testing?” Food and Chemical Toxicology 109: 797–811. doi: 10.1016/j.fct.2017.08.030
- EFSA. 2009. “Guidance of the Scientific Committee on a Request from EFSA on the Use of the Benchmark Dose Approach in Risk Assessment.” EFSA Journal 1150: 1–72.
- ECHA. European Risk Assessment Report. Copper, Copper II sulphate pentahydrate, copper(I)oxide, copper(II)oxide, dicopper chloride trihydroxide. European Copper Institute 2008. ECHA, European Chemicals Agency, Helsinki, Finland. Published at the website of the European Chemicals Agency http://echa.europa.eu/nl/home.
- Evans, P., H. Matsunaga, and M. Kiguchi. 2008. “Large-Scale Application of Nanotechnology for Wood Protection.” Nature Nanotechnology 3 (10): 577. doi: 10.1038/nnano.2008.286
- Freeman, B. M. H., and C. R. McIntyre. 2008. “A Comprehensive Review of Copper-Based Wood Preservatives with a Focus on New Micronized or Dispersed Copper Systems.” Forest Products Journal 58: 6–27.
- Gosens, I., A. Kermanizadeh, N. R. Jacobsen, A. G. Lenz, B. Bokkers, W. H. De Jong, P. Krystek, et al. 2015. “Comparative Hazard Identification by a Single Dose Lung Exposure of Zinc Oxide and Silver Nanomaterials in Mice.” PLoS One 10 (5): e0126934. doi: 10.1371/journal.pone.0126934
- Gosens, I., F. R. Cassee, M. Zanella, L. Manodori, A. Brunelli, A. L. Costa, B. G. Bokkers, et al. 2016. “Organ Burden and Pulmonary Toxicity of Nano-Sized Copper (II) Oxide Particles after Short-Term Inhalation Exposure.” Nanotoxicology 10 (8): 1084–1095. doi: 10.3109/17435390.2016.1172678
- Hébert, C. D. 1993. NTP Technical Report on toxicity studies of cupric sulphate (CAS N°7758-99-8) administered in drinking water and feed to F344/N rats and B6C3F1 mice. National Toxicology Program, Toxicity Report Series N° 29, United States Department of Health and Human Services (NIH Publication 93-3352); Not GLP; Published, Washington, DC, USA. https://ntp.niehs.nih.gov/ntp/htdocs/st_rpts/tox029.pdf.
- Jantratid, E., N. Janssen, C. Reppas, and J. B. Dressman. 2008. “Dissolution Media Simulating Conditions in the Proximal Human Gastrointestinal Tract: an Update.” Pharmaceutical Research 25 (7): 1663–1676. DOI: 10.1007/s11095-008-9569-4
- Jing, X., J. H. Park, T. M. Peters, and P. S. Thorne. 2015. “Toxicity of Copper Oxide Nanoparticles in Lung Epithelial Cells Exposed at the Air–Liquid Interface Compared with in Vivo Assessment.” Toxicology in Vitro 29: 502–511. DOI: 10.1016/j.tiv.2014.12.023
- Kartal, S. N., F. Green, and C. A. Clausen. 2009. “Do the Unique Properties of Nanometals Affect Leachability or Efficacy against Fungi and Termites?” International Biodeterioration and Biodegradation 63 (4): 490–495.
- Keller, A. A., A. S. Adeleye, J. R. Conway, K. L. Garner, L. Zhao, G. N. Cherr, J. Hong, et al. 2017. “Comparative Environmental Fate and Toxicity of Copper Nanomaterials.” NanoImpact 7: 28–40.
- Kent, R. D., and P. J. Vikesland. 2016. “Dissolution and Persistence of Copper-Based Nanomaterials in Undersaturated Solutions with respect to Cupric Solid Phases.” Environmental Science and Technology 50 (13): 6772–6781. doi: 10.1021/acs.est.5b04719
- Klein, C. L., K. Wiench, M. Wiemann, L. Ma-Hock, B. Van Ravenzwaay, and R. Landsiedel. 2012. “Hazard Identification of Inhaled Nanomaterials: Making Use of Short-Term Inhalation Studies.” Archives of Toxicology 86 (7): 1137–1151. doi: 10.1007/s00204-012-0834-2
- Liao, M., and H. Liu. 2012. “Gene Expression Profiling of Nephrotoxicity from Copper Nanoparticles in Rats after Repeated Oral Administration.” Environmental Toxicology and Pharmacology 34 (1): 67–80. doi: 10.1016/j.etap.2011.05.014
- Lebow, S., and D. Foster. 2005. “Environmental Concentrations of Copper, Chromium, and Arsenic Released from a Chromated-Copper-Arsenate- (CCA-C-) Treated Wetland Boardwalk.” Forest Products Journal 55: 62–70.
- Lei, R., C. Wu, B. Yang, H. Ma, C. Shi, Q. Wang, Q. Wang, Y. Yuan, and M. Liao. 2008. “Integrated Metabolomic Analysis of the Nano-Sized Copper Particle-Induced Hepatotoxicity and Nephrotoxicity in Rats: A Rapid In Vivo Screening Method for Nanotoxicity.” Toxicology and Applied Pharmacology 232 (2): 292–301. doi: 10.1016/j.taap.2008.06.026
- Marques, M.,. R. Loebenberg, and M. Almukainzi. 2011. “Simulated Biological Fluids with Possible Application in Dissolution Testing.” Dissolution Technologies 18 (3): 15–28.
- OECD 2008. “OECD Guidelines for the testing of chemicals: Acute Oral Toxicity: Up-and-Down Procedure.” In Test Guideline 425, 27. Paris, France: Organisation for Economic Co-operation and Development.
- Pantano, D., N. Neubauer, J. Navratilova, L. Scifo, C. Civardi, V. Stone, F. Von Der Kammer, et al. 2018. “Transformations of Nanoenabled Copper Formulations Govern Release, Antifungal Effectiveness, and Sustainability throughout the Wood Protection Lifecycle.” Environmental Science and Technology 52 (3): 1128–1138. doi: 10.1021/acs.est.7b04130
- Platten, W., T. Luxton, S. Gerke, N. Harmon, K. Sylvest, B. Rogers, and K. Rogers. 2014. Release of micronized copper particles from pressure treated wood products. Washington, DC: US Environmental Protection Agency.
- Platten, W.E., N. Sylvest, C. Warren, M. Arambewela, S. HArmon, K. Bradham, K. Rogers, T. Thomas, T.P. Luxton. 2016. “Estimating dermal transfer of copper particles from the surfaces of pressure treated lumber and implications for exposure.” Science of the Total Environment 548–549: 441–449. doi: 10.1016/j.scitotenv.2015.12.108
- Privalova, L. I., B. A. Katsnelson, N. V. Loginova, V. B. Gurvich, V. Y. Shur, I. E. Valamina, O. H. Makeyev, et al. 2014. “Subchronic Toxicity of Copper Oxide Nanoparticles and Its Attenuation with the Help of a Combination of Bioprotectors.” International Journal of Molecular Sciences 15 (7): 12379–12406. doi: 10.3390/ijms150712379
- Qualls-Creekmore, E., M. Tong, and G. M. Holmes. 2010. “Time-Course of Recovery of Gastric Emptying and Motility in Rats with Experimental Spinal Cord Injury.” Neurogastroenterol Motil 22: 62–69. doi: 10.1111/j.1365-2982.2009.01347.x
- Santiago-Rodríguez, L., J. L. Griggs, K. D. Bradham, C. Nelson, T. Luxton, W. E. Platten Iii, and K. R. Rogers. 2015. “Assessment of the Bioaccessibility of Micronized Copper Wood in Synthetic Stomach Fluid.” Environmental Nanotechnology, Monitoring and Management 4: 85–92.
- Sarkar, A., J. Das, P. Manna, and PC Sil. 2011. “Nano-Copper Induces Oxidative Stress and Apoptosis in Kidney via Both Extrinsic and Intrinsic Pathways.” Toxicology 290 (2–3): 208–217. doi: 10.1016/j.tox.2011.09.086
- Strauch, B. M., R. K. Niemand, N. L. Winkelbeiner, and A. Hartwig. 2017. “Comparison between Micro- and Nanosized Copper Oxide and Water Soluble Copper Chloride: interrelationship between Intracellular Copper Concentrations, Oxidative Stress and DNA Damage Response in Human Lung Cells.” Particle and Fibre Toxicology 14: 28. doi: 10.1186/s12989-017-0209-1
- Ude, V. C., D. M. Brown, L. Viale, N. Kanase, V. Stone, and H. J. Johnston. 2017. “Impact of Copper Oxide Nanomaterials on Differentiated and Undifferentiated Caco-2 Intestinal Epithelial Cells; Assessment of Cytotoxicity, Barrier Integrity, Cytokine Production and Nanomaterial Penetration.” Particle and Fibre Toxicology 14:31. doi: 10.1186/s12989-017-0211-7
- Vandebriel, R. J., E. C. Tonk, L. J. J. De La Fonteyne-Blankestijn, E. R. Gremmer, H. W. Verharen, L. T. Van Der Ven, H. Van Loveren, and W. H. de Jong. 2014. “Immunotoxicity of Silver Nanoparticles in an Intravenous 28-Day Repeated-Dose Toxicity Study in Rats.” Particle and Fibre Toxicology 11: 21. doi: 10.1186/1743-8977-11-21
- Vencalek, B. E., S. N. Laughton, E. Spielman-Sun, S. M. Rodrigues, J. M. Unrine, G. V. Lowry, and K. B. Gregory. 2016. “In Situ Measurement of CuO and Cu(OH)2 Nanoparticle Dissolution Rates in Quiescent Freshwater Mesocosms.” Environmental Science and Technology Letters 3 (10): 375–380.
- Wang, Z., A. Von Dem Bussche, P. K. Kabadi, A. B. Kane, and R. H. Hurt. 2013. “Biological and Environmental Transformations of Copper-Based Nanomaterials.” ACS Nano 7 (10): 8715–8727. doi: 10.1021/nn403080y
- Wohlleben, W.,. H. Waindok, B. Daumann, K. Werle, M. Drum, and H. Egenolf. 2017. “Composition, Respirable Fraction and Dissolution Rate of 24 Stone Wool MMVF with Their Binder.” Particle and Fibre Toxicology 14: 29. doi: 10.1186/s12989-017-0210-8