Article title: Development and haematotoxicological evaluation of doped hydroxyapatite based multimodal nanocontrast agent for near-infrared, magnetic resonance, and X-ray contrast imaging
Authors: Ashokan, A., P. Chandran, A. R. Sadanandan, C. K. Koduri, A. P. Retnakumari, D. Menon, S. Nair, and M. Koyakutty
Journal: Nanotoxicology
Bibliometrics: Volume 06, Number 06, pages 652–666.
DOI: http://dx.doi.org/10.3109/17435390.2011.600839
The authors would like to apologize for errors occurred in the Figure 1B and Figure 11B of this paper. In Figure 1B, the SEM image of doped calcium phosphate nanoparticles (nCP) was shown in place of doped hydroxyapatite nanoparticles (D-nHAp). In Figure 11B, an image of the positive control, lectin, treated mononuclear cells was repeated for D-nHAp + Lectin sample. The corrected images are shown below. The authors regret the errors and apologize for any inconvenience caused.
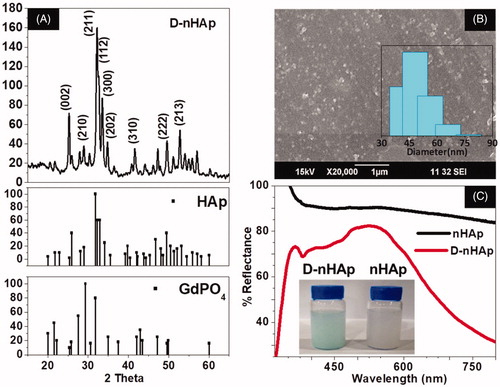
Corrected Figure 1B
Figure 1. (A) XRD of D-nHAp showing hexagonal HAp crystal structure along with the reference patterns of HAp and GdPO4. (B) SEM image of D-nHAp showing particle size ∼50 nm. Inset: DLS data of D-nHAp showing an average size ∼50 nm. (C) Diffuse reflectance spectra showing characteristic features of ICG in D-nHAp samples compared to undoped nHAp. Inset: Digital photograph pf D-nHAp and nHAp solutions (∼20 mg/ml) indicating the greenish body color due to ICG doping. nHAp: hydroxyapatite nanoparticle; D-nHAp: doped nHAp; ICG: indocyanine green.
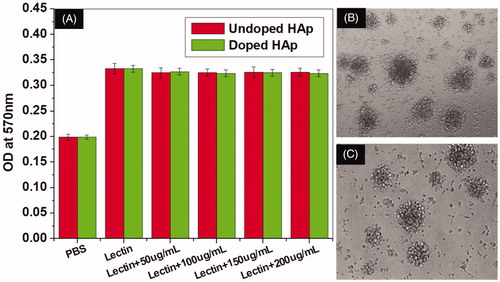
Corrected Figure 11B
Figure 11. (A) Immunosuppression studied by cell viability analysis on mononuclear cells exposed to mixture of lectins + nHAp/D-nHAp samples. Optical microscopic images of mononuclear cells treated with (B) 100 µg/mL of D-nHAp + lectins and (C) lectins. The data indicate that nHAp/DnHAp do not interfere with proliferation of mononuclear cells activated by lectins. nHAp: hydroxyapatite nanoparticle; D-nHAp: doped nHAp.