
Abstract
Inhalation of multi-walled carbon nanotubes (MWCNTs) induces lung inflammation. Depending on industrial applications, CNTs with different physicochemical characteristics are produced and workers can potentially be exposed. This raises concerns about the long-term health effects of these nanomaterials. Because of the wide variety of MWCNTs, it is essential to study the toxicological effects of CNTs of various shapes and to better understand the impact physical and chemical properties have on their toxicity. In this study, rats were exposed by nose-only to two pristine MWCNTs with different morphologies: the long and thick NM-401 or the short and thin NM-403. After four weeks of inhalation, animals were euthanized at four different times during the recovery period: three days (short-term), 30 and 90 days (intermediate-term) and 180 days (long-term). Analyses of the transcriptome in the whole lung and the proteome in the bronchoalveolar lavage fluid of exposed animals were performed to understand the MWCNT underlying mechanisms of toxicity. Following inhalation of NM-401, we observed a dose-dependent increase in the number of differentially expressed genes and proteins, whereas there is no clear difference between the two concentrations of NM-403. After NM-403 inhalation, the number of differentially expressed genes and proteins varied less between the four post-exposure times compared to NM-401, which supports the postulation of a persistent effect of this type of CNT. Our toxicogenomics approaches give insights into the different toxicological profile following MWCNT exposure.
Introduction
Due to their physical and chemical properties, multi-walled carbon nanotubes (MWCNTs) are among the most promising nanomaterials. However, since MWCNTs are biopersistent fibrous materials that share similarities with asbestos, concerns have arisen about their possible toxic effects (Iarc Citation2017). Occupational exposure to MWCNTs may occur mainly by inhalation, as these nanomaterials may be aerosolized in various industrial usages (Guseva Canu et al. Citation2020). The number of toxicological studies on CNTs has been steadily increasing for the last few decades. Different works have shown that MWCNT exposure by inhalation or intratracheal instillation could lead to pulmonary toxicological effects, such as lung inflammation, genotoxicity, fibrosis or lung cancer (Kasai et al. Citation2015, Citation2016; Porter et al. Citation2013; Suzui et al. Citation2016). To date, only one MWCNT (MWNT-7) has been classified as ‘possibly carcinogenic to humans’ (Group 2B), whereas the carcinogenicity of the other MWCNTs (Group 3) has not been characterized because of the lack of data on their carcinogenic potential (Iarc Citation2017). Because of the wide variety of CNTs with various lengths, diameters and functions, additional effort is required to assess their pulmonary toxicity.
As a complementary approach to conventional toxicological assays, the omics methods are useful technologies for gaining a mechanistic understanding of the toxicological effects observed following exposure to chemicals and particulate matters. Importantly, these methods can also be exploited as predictive tools for identifying the mode of action of particles with similar physical and chemical characteristics. These molecular approaches may also be used to identify exposure markers or early markers of adverse effects, before the appearance of clinical signs of a disease (Rahman et al. Citation2017).
Several studies have assessed gene expression alterations following in vivo exposure to CNTs (Ellinger-Ziegelbauer and Pauluhn Citation2009; Poulsen et al. Citation2015; Snyder-Talkington et al. Citation2013). These omics approaches were used to identify genes and pathways modulated in response to CNT exposure. However, there are still too few studies to assess the link between MWCNT physicochemical properties, global gene or protein expression profiles and long-term effects.
In the previous study, we showed that inhalation of two pristine MWCNTs – the long and thick NM-401 and the short and thin NM-403 – induced alveolar neutrophilic granulocyte influx, a hallmark of inflammation, which was proportional to the lung CNT deposited surface area (Gate et al. Citation2019). However, due to their different morphology, one could assume that these two CNTs may have diverse toxicological profiles, but the conventional toxicology approaches used in this early work were probably not sensitive enough to detect such differences.
In order to gain additional insight into their toxicological properties, we compared the alterations triggered by these two MWCNTs in rats after inhalation exposure at the level of the transcriptome in the lung tissue and the proteome in the bronchoalveolar lavage fluid (BALF). We integrated transcriptomics and proteomics data to highlight differences between NM-401 and NM-403 effects.
Materials and methods
Carbon nanotubes
The two pristine MWCNTs NM-401 and NM-403 were obtained from the Fraunhofer Institute for Toxicology and Experimental Medicine (Hannover, Germany) and the Joint Research Center (Ispra, Italy), respectively. The full characterization of the CNTs summarized in was performed in earlier works (JRC Citation2014; Poulsen et al. Citation2017). Monitoring and in-depth characterization of the corresponding aerosols have also been described in detail previously by Gate et al. (Citation2019); the main characteristics are presented in .
Table 1. Characteristics of the two Pristine MWCNTs NM-401 and NM-403.
Table 2. Main characteristics of the aerosols.
Animal exposure
Animal experiments were performed in accordance with the EC Directive 2010/63/EU and with the approval of the local Ethical Committee and the French Ministry for Research and Higher Education (APAFIS# 3468). The animal facility has been approved by the French Ministry of Agriculture (Agreement #D54-547-10). The animal exposure procedure has been published before (Gate et al. Citation2019). Briefly, 13-week-old female Sprague Dawley rats (Janvier Labs, Le Genest Saint Isle, France) were housed in individually ventilated cages (Tecniplast), maintained in 12 h/12h light/dark cycles and, when not in restraining tubes, they had ad libitum access to food and water. Since the respiratory parameters of females and males (tidal volume or minute ventilation) vary in the same way depending on their weight and because the morphology of the males can cause complications for nose-only exposure, we used females in this study. Animals (six per group) were exposed by nose-only in 9-port inhalation chambers (EMMS, UK) either to filtered air or to CNT aerosols (generated with an acoustic generator at 0.5 or 1.5 mg/m3) 2 × 3 h/day, 5 days/week for 4 weeks (Gate et al. Citation2019).
Tissue sampling
Lung tissues were collected following animal anesthesia with pentobarbital (60 mg/kg) and exsanguination through the abdominal aorta. Sampling was performed at four post-exposure times to evaluate the short (3 days), intermediate (30 and 90 days) and long-term (180 days) effects of CNT exposure. Accessory lung lobes were stored in RNAlater solution until use. Bronchoalveolar lavage (BAL) was performed on the left lung as described previously (Gate et al. Citation2019).
Transcriptomic analysis from lung
Accessory lung lobes from six animals per group were disrupted and total RNAs were extracted and purified as described previously (Chezeau et al. Citation2018). The RNA purity was analyzed using a NanoPhotometer® spectrophotometer (IMPLEN) and A260/A280 ratios were between 2 and 2.1. The RNA integrity was analyzed with the RNA 6000 Nano Assay kit on the 2100 Bioanalyzer system (Agilent Technologies) and the RNA integrity numbers were above 6.2 (above 7.0 for 90% of the samples). The gene expression analyses were performed using Low Input Quick Amp Labeling kits (Agilent Technologies). Briefly, 100 ng of RNAs were reverse transcribed into cDNA. cRNA labeled by Cyanine 3-CTP was then synthesized and purified using a RNeasy Mini Kit (Qiagen). The specific activity was analyzed for each sample (pmol Cyanine/µg RNA) and the threshold was set at 6, as indicated by the manufacturer. Labeled cRNAs were hybridized for 17 h at 65 °C onto Agilent G4853A SurePrint G3 Rat GE 8*60 K v2 microarrays (Agilent Technologies) and scanned on an Agilent G2505C microarray scanner with a 3 µm resolution. Data were extracted with Agilent Feature Extraction software, version 11.0. Microarray data have been uploaded to the NCBI Gene Expression Omnibus database under accession number GSE113532 (http://www.ncbi.nlm.nih.gov/geo/).
Proteomic analysis from bronchoalveolar lavage
Filter-aided sample preparation (FASP) was performed as previously described (Nahle et al. Citation2020). Between 2.5 and 10.2 µg/µL of protein was measured for the BALFs prior to preparation for mass spectrometry. Briefly, 50 μg of protein was reduced by adding IM DTT to a final concentration of 0.1 M DTT. The samples were mixed with 8 M urea in 0.1 M Tris-HCl, pH 8.9 (UA buffer) and loaded onto ultracentrifugation units with a nominal molecular weight cutoff at 10.000 (Vivacon 500, catalogue no. VN01H02, Sartorius Stedim Biotech) and detergents were removed by washing the samples twice with the 8 M urea buffer. Subsequently, proteins were alkylated with 0.05 M iodoacetamide in the UA buffer (IAA). Then, the filter units were washed three times with 50 mM ammonium bicarbonate (NH4HCO3). Proteins were digested overnight at 37 °C using sequence grade trypsin (Trypsin Gold, Promega, Madison, WI) at an enzyme-to-protein ratio of 1:50 (w/w). Peptides were recovered by centrifugation and two additional washes with 50 mM NH4HCO3, combining the flow-through. Afterward, samples were acidified with trifluoroacetic acid (TFA) to a final concentration of 1% (v/v) TFA and lyophilized. Then, 20 μg of the tryptic digest was loaded separately and desalinated on C18 Stage tip as described by Rappsilber, Mann, and Ishihama (Citation2007). After elution, the samples were evaporated by placing them in a CentriVap Concentrator with open caps for approximately 10–15 min, until a volume of approximately 5 μL remained. The sample was then resuspended in 15 μL of 0.1% TFA and stored at 4 °C until mass spectrometry analysis.
Mass spectrometry settings
Each sample was run in triplicate on a Thermo Scientific Q Exactive mass spectrometer connected to a Dionex UltiMate 3000 (RSLCnano) chromatography system. Tryptic peptides were resuspended in 0.1% formic acid. Each sample was loaded onto a fused silica emitter (75 μm ID), pulled using a laser puller (Sutter Instruments P2000, Novato, CA, USA), packed with ReproSil Pur (Dr Maisch, Ammerbuch-Entringen, Germany) C18 (1.9 μm; 12 cm in length) reverse phase media and separated by an increasing acetonitrile gradient for 60 min at a flow rate of 250 nL/min direct into a Q Exactive MS. The MS was operated in positive ion mode with a capillary temperature of 320 °C and a potential of 2,300 V applied to the frit. All data were acquired while operating in automatic data-dependent switching mode. A high resolution (70,000) MS scan (300–1600 m/z) was performed using the Q Exactive to select the 12 most intense ions prior to MS/MS analysis using high-energy collision dissociation (HCD).
Proteomics analysis
Proteins were identified and quantified using MaxLFQ (Cox et al. Citation2014) by searching with the MaxQuant version 1.5 against the Homo Sapiens reference proteome database (Uniprot). Modifications included C carbamylation (fixed) and M oxidation (variable). The proteomics dataset has been deposited in the PRIDE database (http://www.ebi.ac.uk/pride), with the identifier PXD18900 (Vizcaino et al. Citation2016).
Gene and protein differential expression analysis
The raw microarray dataset was filtered in order to exclude unexpressed probes and then normalized by the quantile method (Bolstad et al. Citation2003). An analysis of differentially expressed genes (DEGs) was performed using a Bayesian model implemented in the limma package in R/Bioconductor (Ritchie et al. Citation2015). The genes were considered to be significantly differentially expressed if (1) the expression changes were equal to or larger than 1.5-fold in either direction for the group exposed to MWCNTs compared to the control group for each experimental condition and (2) the BH-adjusted (false discovery rate – FDR) p values were less than or equal to 0.05 (p ≤ 0.05).
As input for the proteomics analysis, we used MaxQuant output files. The data were log2-transformed after removing reversed matches and contaminants. Missing values in LFQ intensities were imputed using group mean imputation with normal distribution correction as follows: when a protein was identified in at least two replicas in a certain experimental condition, the missing values were replaced by random draws from the Gaussian distribution centered at their mean value. In all other cases, the missing values were replaced by random draws from a Gaussian distribution centered at a minimum value for an experimental condition.
An analysis of differentially expressed proteins (DEPs) was performed using the limma package in R/Bioconductor (Ritchie et al. Citation2015). The proteins were considered to be significantly differentially expressed if (1) the expression changes were equal to or larger than 1.5-fold in either direction for the group exposed to MWCNTs compared to the control group for each experimental condition and (2) the BH-adjusted (FDR) p values were less than or equal to 0.05 (p ≤ 0.05). Unsupervised integration of transcriptomics and proteomics datasets was performed using Multi-Omics Factor Analysis (MOFA) (Argelaguet et al. Citation2018). Pathway analysis of differentially expressed genes/proteins was performed using the gprofiler2 package in R (Raudvere et al. Citation2019), the Gene Ontology (GO) (The Gene Ontology Consortium Citation2019) and the KEGG database (Kanehisa et al. Citation2017). Gene regulatory networks were inferred using the GENIE3 algorithm; the list of transcription factors was derived from the Animal TFDB 3.0 database (Hu et al. Citation2019). The optimal threshold cutoff for selecting ranked gene pairs was identified using a gene ontology semantic similarity approach described previously (Zhernovkov et al. Citation2019). The software Cytoscape (version 3.4.0) was used for network visualization and calculation of topological parameters of networks (Shannon et al. Citation2003). The network clustering was performed using the Girvan-Newman (GLay) algorithm from the clusterMaker Cytoscape plugin (Girvan and Newman Citation2002; Su et al. Citation2010). Statistical analysis and data processing were performed with R version 3.6.1 (https://www.r-project.org/) and RStudio version 1.1.383 (https://www.rstudio.com).
Results
Gene expression and pathway analysis
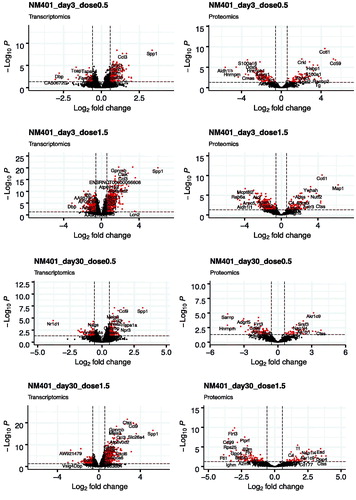
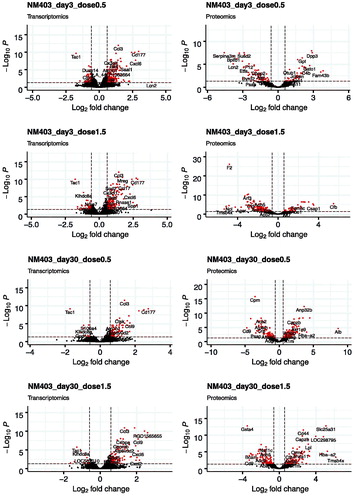
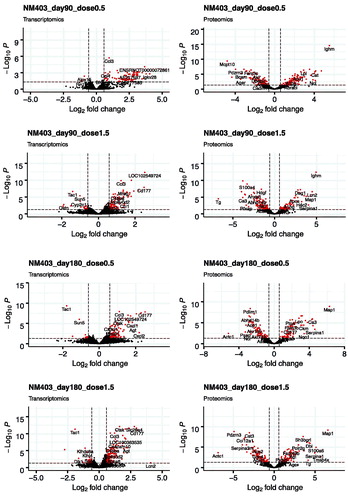
We first analyzed the differentially expressed genes (DEGs) in the lungs of animals exposed to filtered air or MWCNTs. The total number of genes detected in all conditions was 25,151 (NM-401) and 23,125 (NM-403). DEGs were selected according to the criteria of fold change >1.5 and FDR corrected p value <0.05. A full list of identified DEGs can be found in Supplementary files 1 (NM-401) and 2 (NM-403). The numbers of DEGs following exposure to NM-401 and NM-403 at the four post-exposure times are presented in and the global distribution of log2 fold change and FDR values are illustrated in using volcano plots. Three days after exposure to the low dose (0.5 mg/m3) of NM-401, we observed four times fewer DEGs than for high-dose exposure (1.5 mg/m3); 293 versus 1,256 genes, respectively. The number of DEGs decreased with time post-exposure to reach 243 and 857 on day 30, 8 and 359 on day 90 and 1 and 410 on day 180 in the low and high-dose groups, respectively. In contrast, NM-403 exposure induced the less prominent effect on day 3 in the high-dose group (220 DEGs). The number of DEGs was comparable between the two doses on day 3 (298 versus 220 in low and high-dose groups, respectively). However, the decrease in the number of DEGs at later post-exposure times appeared to be more pronounced in the animals exposed to a low dose than in the high-dose group. Indeed, about a three-fold decrease was observed between day 3 and the other times in the low-dose group. In the high-dose group, there were 220 DEGs on day 3, a lower number on days 30 and 90 (132 and 134, respectively) but a higher number of genes on day 180 (261).
Figure 1. Intersection between transcriptomics and proteomics analyses. The intersection between the number of differentially expressed genes (DEGs) and proteins (DEPs) is presented as Venn diagrams at the different post-exposure times: 3, 30, 90 and 180 days. (A) Comparison between the two concentrations of NM-401 (upper panel) or NM-403 (lower panel). (B) Comparison between 0.5 mg/m3 of NM-401 and NM-403 (upper panel) or between 1.5 mg/m3 of NM-401 and NM-403 (lower panel). (C) Table with the genes in question divided into transcriptomes and proteomes. The number of DEGs, DEPs, intersected genes, percentage of intersected genes and gene names are indicated. P: proteomics, T: transcriptomics.
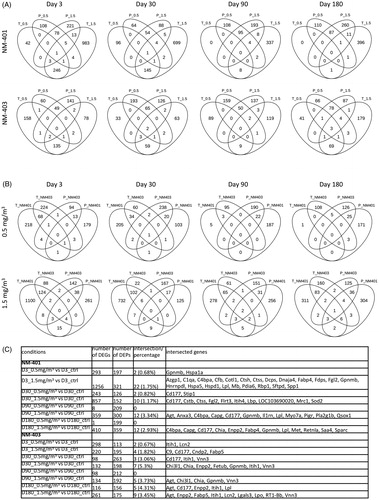
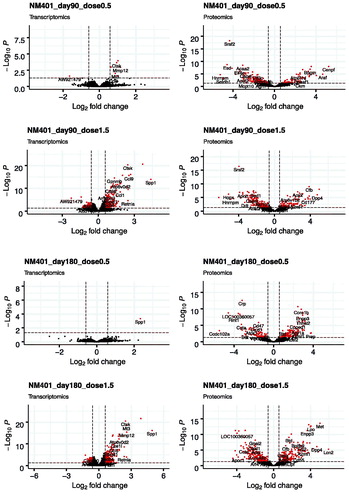
Figure 2. Volcano plots of the distribution of gene and protein expression for NM-401 and NM-403 responses. Genes and proteins that are differentially expressed due to MWCNT inhalation with fold changes ≥1.5-fold in either direction and FDR-corrected p values ≤ 0.05 are denoted by red symbols. Genes and proteins that were not classified as differentially expressed are plotted in black.
To identify altered pathways, we used the KEGG database (Kanehisa et al. Citation2017) and pathway over-representation analysis using gProfiler tools (Raudvere et al. Citation2019). Inhalation of NM-401 and NM-403 altered the expression of genes involved in multiple signaling pathways, such as the immune system, inflammation and signal transduction pathways (Supplementary files 3 and 4). Among the processes relating to the immune system, several signaling pathways were identified to be altered in response to both MWCNTs with the maximum effect on day 3, including the complement and coagulation cascades (the max. number of DEGs with 8 genes for NM-401 and 22 genes for NM-403), Toll-like receptor (the max. number of DEGs was found in the high dose of NM-401 with 5 genes and in the low dose of NM-403 with 7 genes), tumor necrosis factor (TNF) (the max. number of DEGs was found in the high dose of NM-401 with 15 genes and in the low dose of NM-403 with 14 genes) and IL-17 signaling (the max. number of DEGs was found in the high dose of NM-401 with 8 genes and in the low dose of NM-403 with 13 genes). In addition, the following pathways relating to inflammation were identified as altered by both MWCNTs at the two doses: cytokine–cytokine receptor interaction (the max. number of DEGs was found in the high dose of NM-401 with 38 genes and in the low dose of NM-403 with 23 genes on day 3), NF-κB signaling pathway (the max. number of DEGs was found in the high dose of NM-401 with 11 genes on day 30 and in the low dose of NM-403 with 8 genes on day 3) and chemokine signaling pathway (the max. number of DEGs was found in the high dose of NM-401 with 24 genes and in the low dose of NM-403 with 17 genes on day 3). In accordance with the total number of DEGs, inhalation of the high dose of NM-401 altered far more pathways than the low dose, while for NM-403 the effect was comparable for both doses. The long-term effects of two types of CNT treatments differ mainly in the expression of genes from cytokine–cytokine receptor interaction (24 DEGs/high dose/NM-401 and 12 DEGs/high dose/NM-403) and chemokine signaling pathways (17 DEGs/high dose/NM-401 and 8 DEGs/low dose/NM-403). On day 180, the NM-401-triggered alteration of these genes was dose-dependent, while for NM-403 the effect was comparable for both doses or more marked at low concentrations. Interestingly, only NM-401 triggered the cell cycle signaling pathways on day 3 with the two doses (9 DEGs/low dose, 19 DEGs/high dose) and the phagosome pathway on day 3 after exposure to the higher dose (24 DEGs) (Supplementary file 3). Finally, enrichment analysis using gene ontology (biological process) annotations shows an alteration of several innate processes relating to the immune system for both MWCNTs: neutrophil chemotaxis (the max. number of DEGs was found in the high dose of NM-401 with 28 genes and in the low dose of NM-403 with 14 genes on day 3), response to interleukin-1 (the max. number of DEGs was found in the high dose of NM-401 with 20 genes and in the low dose of NM-403 with 14 genes on day 3) and superoxide metabolic process (the max. number of DEGs was identified in the high dose of NM-401 with 15 genes and in the low dose of NM-403 with 5 genes on day 3). Only inhalation of the high dose of NM-401 altered genes from GO term redox process (69 DEGs/day 3) (Supplementary files 5 and 6).
Protein expression and pathway analysis
We then compared the protein expression in the BALF between the animals exposed to filtered air and those exposed to MWCNTs. DEPs were selected according to the criteria of fold change > 1.5 and FDR corrected p value < 0.05. A full list of identified DEPs can be found in Supplementary files 7 (NM-401) and 8 (NM-403). The total number of proteins detected in all conditions was 1,984 (NM-401) and 1,169 (NM-403). The numbers of DEPs following NM-401 and NM-403 exposure at the four post-exposure times are presented in and global distribution of log2 fold change and FDR values are illustrated in using volcano plots. On day 3 after exposure to NM-401, 197 and 321 proteins were differentially expressed in the low and high-dose groups, respectively. The number of DEPs decreased on day 30 (126 and 152 in low and high-dose group, respectively). We observed an increase of DEPs for the two later times: 209 and 300 proteins on day 90, and 199 and 359 proteins on day 180, in the low and high-dose group, respectively. In support of the dose dependence of gene expression, as well as the time dependence, NM-403 caused a less prominent effect in protein expression compared to NM-401. In the low-dose group, the number of DEPs increased between the day 3 and 30 follow-ups (113 versus 263, respectively) and decreased for the later times (212 on day 90 versus 156 on day 180). In the high-dose group, the number of DEPs decreased slightly with time post-exposure: 195 on day 3, 198 on day 30, 192 on day 90, and 156 on day 180. In line with the analysis of gene expression profiles, the KEGG pathway over-representation analysis revealed alteration of proteins from the complement and coagulation cascades signaling pathway (the highest number of DEPs was found in the high dose of NM-401 with 14 proteins on day 180 and in the high dose of NM-403 with 8 proteins on day 3) in response to MWCNT inhalation (Supplementary files 3 and 4). Several processes relating to the immune system were identified as significantly changed in the BALF at different times in response to MWCNT exposure: proteasome (the max. number of DEPs was found in the low dose of NM-401 with 12 proteins on day 3 and in the low dose of NM-403 with 8 proteins on day 30), lysosome (8 DEPs/low dose/NM-401/day 3), phagosome (the max. number of DEPs was found in the high dose of NM-401 with 12 proteins on day 90 and in the high dose of NM-403 with 8 proteins on day 3), citrate cycle (the max. number of DEPs was found in the high dose of NM-401 with 10 proteins on day 3), endocytosis (12 DEPs/low dose and 13 DEPs/high dose of NM-401 on day 3) and metabolic pathways (the max. number of DEPs was found in the high dose of NM-401 with 66 proteins on day 3 and in the low dose of NM-403 with 49 proteins on day 30). Enrichment analysis using gene ontology annotations showed changes for regulation of the peptidase activity (the max. number of DEPs was found in the high dose of NM-401 with 21 proteins on day 3 and in the high dose of NM-403 with 29 proteins on day 180) for both MWCNTs. Remarkably, NM-401 and NM-403 induced strong alteration in expression levels of proteins related to redox process (the max. number of DEPs was found in the high dose of NM-401 with 42 proteins on day 3 and in the low dose of NM-403 with 26 proteins on day 3) (Supplementary files 5 and 6).
The direct comparison of DEGs and DEPs revealed small amounts of overlapping genes and proteins. summarizes the numbers of genes and proteins that were differentially expressed and represents genes and proteins that were found to be simultaneously differentially expressed. The maximum number of overlapped genes and proteins was found for the high dose of NM-401 on day 3, while the maximum percentage of the overlapping pairs was identified for a later time: the values were doubled. On day 3 after exposure to the high dose of NM-401, 22 genes/proteins were simultaneously differentially expressed: Azgp1, C1qa, C4bpa, Cfb, Cotl1, Ctsh, Ctss, Dcps, Dnaja4, Fabp4, Fdps, Fgl2, Gpnmb, Hnrnpdl, Hspa5, Hspd1, Lpl, Mb, Pdia6, Rbp1, Sftpd, Spp1. On day 180 after exposure to a high dose of NM-403, 9 genes/proteins were simultaneously differentially expressed: Agt, Enpp2, Fabp5, Itih1, Lcn2, Lgals3, Lpo, RT1-Bb, Vnn3.
Integration of transcriptomics and proteomics data
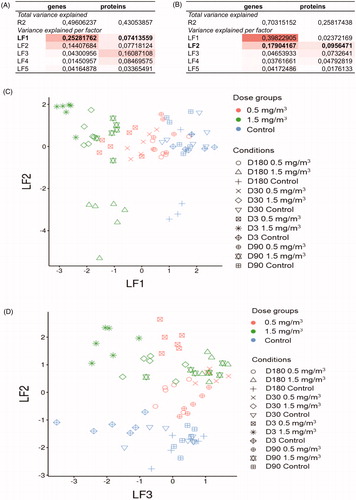
After we identified regulated pathways following inhalation of CNTs in single datasets, we then integrated transcriptomic and proteomic datasets to obtain a deeper understanding of the multiple regulatory changes. To link overall mRNA transcription activity with protein expression in BALF, we used a MOFA approach (Argelaguet et al. Citation2018). From a technical perspective, this method is very similar to principal component analysis (PCA) but developed for multi-omics analysis. Like PCA, the MOFA method reduces data dimensionality, but it also captures coordinated changes in multi-omics datasets. Moreover, MOFA helps us eliminate technical noise, such as missing values in proteomics data, batch effects, etc. MOFA infers latent factors (analogous to principal components in PCA), which detect the major source and proportion of variation in multi‐omics datasets. We used two matrices of the gene and protein expression values as input for the algorithm. Using this method, we identified the top five latent factors that cumulatively captured sources of variation in transcriptomics and proteomics datasets ( and ). In total, these latent factors explain: (i) 49% of the variability of genes and 43% of the variability of proteins in NM-401 datasets ( and ); (ii) 70% of the variability of genes and 26% of the variability of proteins in NM-403 datasets ( and ). Among them, only latent factor 1 for the NM-401 dataset ( and ) and latent factor 2 for the NM-403 dataset ( and ) represent dose-dependent responses. The other three latent factors mainly separate samples from different times. To identify genes/proteins with the most contribution to the variability identified by latent factor 1 (NM-401) and latent factor 2 (NM-403), we calculated factor loadings and selected the top 100 genes/proteins based on this criterion (Supplementary file 9). Genes/proteins with the highest weight values contribute the most to variability identified by these latent factors and might be considered as potential markers of coordinated changes in mRNA and protein abundance levels. We will hereinafter use the term ‘multimodal signature set’ for these markers in the manuscript. Gene ontology and KEGG pathway enrichment analysis of these markers highlighted the important role of oxidative stress processes for NM-401 treatment (Supplementary file 10). A total of ten genes (Lcn2, Mt3, Tnf, Areg, Ect2, Gch1, Cdk1, Ccna2, Hmox1, Sod2) and eight proteins (the genes encoding these proteins: Lcn2, Pdcd10, Mpo, Ppp5c, Sod1, Cst3, Met, Itgb2) from the NM-401 multimodal signature set were involved in the response to reactive oxygen species. Also, proteomics sets for both CNTs involve neutrophil chemotaxis related proteins, but NM-403 induced a more prominent response.
Figure 3. Top 5 latent factors that cumulatively captured sources of variation in transcriptomics and proteomics datasets. Total variance explained by the top 5 latent factors (LFs) and variance explained by each factor for NM-401 (A) and NM-403 (B) multi-omics datasets. Samples were displayed using LFs 1 and 2 for NM-401 (C) and LFs 2 and 3 for NM-403 (D) datasets. The colors denote different doses; symbol shape indicates conditions.
Network analysis of transcription factors
To identify key transcription regulators of toxicological response, we implemented a computational approach based on reverse engineering techniques. These methods can identify mutual variation in expression levels among genes in different samples and represent these dependencies as a network (Serra et al. Citation2020; Zhernovkov et al. Citation2019). Using the GENIE3 algorithm (Huynh-Thu et al. Citation2010) and transcriptomics data from NM-401 and NM-403 experiments, we identified co-expression scores for transcription factors (TFs) and their potential target genes. The analysis was performed separately for NM-401 and NM-403 datasets. These TF-gene pairs formed a gene regulatory network, where nodes denote genes and edges represent the strength of co-expression similarities between them (). One of the important properties of the inferred networks is the colocalization of genes in distinct clusters (). The final networks consist of several large modules of genes. To prioritize these network modules according to their importance in driving the biological responses to CNT inhalation, we mapped gene markers from the multimodal signature set onto the inferred gene networks. Having found that the major part of genes from the NM-401 set belonged to two closely located clusters in the NM-401 network () and genes from the NM-403 set were mainly represented in one cluster in NM-403 network (, Supplementary File 8), we next focused on the analysis of TFs in these network clusters. In order to prioritize TFs, we analyzed nodes in the selected network clusters using the betweenness centrality metric, which measures the number of shortest paths passing through a node in a network. Therefore, nodes with the highest betweenness centrality value are ‘bottlenecks’ or crucial junctions of the network. These network topological features are widely used in the analysis of gene regulatory networks, and such types of genes are considered important in the cellular regulatory program (Van Dam et al. Citation2018). shows a prioritized list of TFs based on betweenness centrality values calculated for each network. The results show that transcription factors relating to the immune system Batf, Meis3, Elf3 and Bhlhe41 (also known as Dec2) had high betweenness centrality values in all networks, while other key transcription factors are differentially represented in different networks. For instance, transcription factors Irf5, Egr2, Foxm1, Myc, Litaf and Mafb are identified as essential regulators only in the NM-401 network, and Zbtb48, Tfeb, Bhlha15 and Hmg20a are identified as regulators only in the NM-403 network.
Figure 4. Inferred gene regulatory networks for MWCNT inhalation studies. The gene regulatory networks after exposure to NM-401 (A) or to NM-403 (B) are presented. Genes are represented by colored cycles; network clusters are denoted by different colors. Transcription factors with high betweenness centrality values are indicated with black font. The dotted line on the graph represents network clusters with a high proportion of gene markers from the ‘multimodal signature set.’
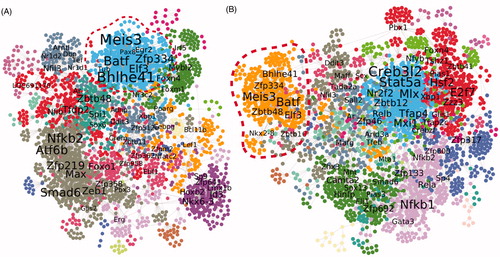
Table 3. Prioritized list of key regulators for NM-401 and NM-403 responses.
Discussion
Because of their use in many industrial sectors, occupational exposure to MWCNTs primarily by inhalation is a concern for workers’ health. To date, evidence suggests that pristine MWCNTs with very different physicochemical properties provoke very similar short-term toxicological responses – especially in terms of inflammation – which have been associated with nanomaterial BET surface area normalized deposited dose (Gate et al. Citation2019; Poulsen et al. Citation2016). However, only some MWCNTs induce cancer in rodent studies (Kasai et al. Citation2016; Muller et al. Citation2009; Poulsen et al. Citation2015; Rittinghausen et al. Citation2014). In order to gain insight into the mechanisms involved in the long-term toxicity of CNTs with different physical and chemical properties, it is necessary to compare the toxicological profiles of different MWCNTs. Toxicogenomics could be a promising approach toward this objective and could help in the development of safer-by-design nanomaterials. In this study, we compared the toxicological profiles of two MWCNTs of different lengths and diameters: the long and thick NM-401 and the short and thin NM-403. For this purpose, we assessed their effects on gene expression in total lung and protein levels in the BALF. Following one month of exposure by inhalation to low concentrations of CNT (0.5 and 1.5 mg/m3) omics analyses were performed at four post-exposure times, allowing us to assess and compare the short (3 days), intermediate (30 and 90 days) and long-term (180 days) effects of CNT exposure. Although both CNTs induced lung inflammation (Gate et al. Citation2019), the number of differentially expressed genes and proteins differed.
When comparing the level of alveolar neutrophil influx for the low and high doses of NM-401 or NM-403 with the number of differentially expressed genes and proteins, we noticed that there was a good correlation between the two parameters. In the previous study, we showed a neutrophilic influx in rats exposed to 1.5 mg/m3 of NM-401 (27-fold increase compared to the control group on day 3) that decreased over time, whereas 0.5 mg/m3 did not induce such an increase (Gate et al. Citation2019). This appearance of lung inflammation is associated with a dose-dependent increase in the number of DEGs/DEPs observed. Following NM-403 inhalation, we previously observed that the level of neutrophil influx was comparable for the two doses (20- and 15-fold increase on day 3 in the low and high-dose group, respectively) which were still significantly different on day 180 (11- and 13-fold increase in the low and high-dose group, respectively) (Gate et al. Citation2019). The observed neutrophilic influx in rats exposed to NM-403 is correlated with the number of DEGs/DEPs. The correlation between the neutrophil influx and the number of DEGs may be partly explained by the fact that many of these genes are involved in inflammation. Interestingly, the high dose of NM-401 induced a higher number of DEGs than NM-403, which decreased over time, whereas the number of DEGs was comparable to NM-403 at the four post-exposure times. These observations are similar to those of Fujita et al. (Citation2015) following intratracheal instillation of single-walled CNTs (Fujita et al. Citation2015). The authors showed that for the long CNTs, which induced more DEGs than the short ones at early post-exposure times, the number of DEGs decreased over time. In contrast, for the short CNTs, the number was comparable at all post-exposure times (Fujita et al. Citation2015).
Additionally, in our study, mainly at early and intermediate post-exposure times, both CNTs affected the expression of DEGs associated with KEGG pathways relating to the immune system, i.e. Toll-like receptor signaling pathway, IL-17 signaling pathway and TNF signaling pathway. However, our analysis clearly shows that NM-401 and NM-403 inhalations cause a differential response in rat lungs. While inhalation of both MWCNTs did not induce lung diseases, administration by intratracheal instillation of NM-401 (but not NM-403) induced slight fibrosis in rat lungs (Gate et al. Citation2019). In this study, the omics analyses showed differential deregulation of genes involved in fibrosis between the two nanomaterials, demonstrating the increased sensitivity of this approach. Even if NM-401 inhalation did not induce such a pathology, we identified eight genes (from the DEGs common across all times) commonly deregulated in the ‘fibrosis gene list’ from Snyder-Talkington et al. (Citation2013): Il1rn, Lgals3, Ccl17, Arg1, Ccl2, C3, Tnf and Mmp12 (Snyder-Talkington et al. Citation2013). For NM-403, only two genes that were commonly deregulated at all times were found in the ‘fibrosis gene list’: Hpx and Tnf. Despite inhalation of these MWCNTs not inducing fibrosis, more genes associated with this pathology are differentially expressed following inhalation of NM-401, which demonstrates the greater fibrogenic potential of this CNT compared to NM-403. In addition, exposure to these CNTs induced specific pathways: Cell cycle and Lysosome were specifically deregulated shortly after NM-401 exposure, while the cytosolic DNA-sensing pathway was specific to NM-403. Altogether, these findings are strong indications that MWCNT morphology could play a role in their toxicological properties and the pathways triggered.
We performed a proteomics analysis on the BALF which focused on extracellular proteins that could be secreted by lung cells or immune cells present in the airways. It must be noted that only a few changes in the protein clusters were observed between NM-401 and NM-403 but we could still identify differences between exposures to each CNT. For instance, NM-403 exposure modulated more metabolic pathways than NM-401. In addition, only NM-403, affected the expression of genes involved in ‘Adherens junctions’ 3 days post-exposure. However, these CNTs shared the modulation of pathways such as ‘Proteasome, Metabolic pathways and Phagosome’ but at different times post-exposure. These pathways are linked with the activity of macrophages and especially their role in the phagocytosis of foreign bodies like MWCNTs, as well as in the clearance of materials from the alveoli (Gate et al. Citation2019). The only common pathway between transcriptomics and proteomics analyses was ‘Complement and coagulation cascades.’ Despite small absolute numbers, we identified an increased convergence for overlapping genes and proteins over time for all conditions for percentage values. The small amount of overlap between genes and proteins was widely discussed previously and could be explained by post-transcriptional regulation, post-translational modification and other technical and biological factors (Nie et al. Citation2007). Moreover, we performed the transcriptomics analysis in the lung tissue and the proteomics analysis in the BALF, which should also contribute to the differences observed. The use of different technology platforms also certainly affects the results obtained. The dynamic range of mass spectrometric analysis is much smaller compared to microarrays technology. For instance, the total number of genes detected in the whole lung in all conditions for NM-401 was 25,151, while using mass spectrometric analysis, we identified only 1,984 proteins in the BALF. In order to overcome these limitations, we used an integrative MOFA approach. This method reduces data dimensionality and captures coordinated changes in microarrays and mass spectrometry datasets. It is important to highlight that our integrative transcriptomics/proteomics analysis identified that NM-401 triggered oxidative stress defense processes, which might be considered a major component of the mode of action of this CNT. The expression level of the genes Lcn2, Mt3, Tnf, Areg, Ect2, Gch1, Cdk1, Ccna2, Hmox1, Sod2 and proteins Lcn2, Pdcd10, Mpo, Ppp5c, Sod1, Cst3, Met, Itgb2 can be considered a potential biomarker of oxidative stress in lung tissue after CNT inhalation. In contrast, NM-403 altered expression of BALF proteins associated with neutrophil cell influx activity.
Finally, in order to gain a deeper insight into the mechanisms induced by CNT inhalation, we used a bioinformatics approach to identify the upstream regulators and compare those modulated by NM-401 and NM-403. Five TFs were common to the two materials and are involved in the negative regulation of AP-1/ATF transcriptional events (Batf) (Williams et al. Citation2001), cell survival (Meis3) (Liu et al. Citation2010), vascular inflammation (Elf3) (Luk, Reehorst, and Mariadason Citation2018), the zinc-finger protein Zfp334 and the transcriptional repressor Bhlhe41. Importantly, this analysis also identifies specific responses to each CNT. NM-403 specifically modulated five other TFs, some of which are involved in lysosomal function (Tfeb) (Napolitano and Ballabio Citation2016) or epithelial-mesenchymal transition (Hmg20a) (Rivero et al. Citation2015). In the case of NM-401 exposure, our analysis shows that it affected 13 TFs mainly implicated in cancer development and progression (Mybl2, Foxm1, Myc, Tshz2 and Pax8) (Bie et al. Citation2019; Gabay, Li, and Felsher Citation2014; Liao et al. Citation2018; Musa et al. Citation2017; Yamamoto et al. Citation2011) or inflammation (Irf5, Egr2, Litaf, Tub, Mafb) (Almuttaqi and Udalova Citation2019; Caberoy et al. Citation2010; Kim Citation2017; Taefehshokr et al. Citation2017; Zou et al. Citation2015). Some of these TFs (Litaf, Foxm1, Myc, Egr2, Mafb) were also identified as key regulators following NM-401 exposure in mice (Zhernovkov et al. Citation2019). Using single-cell RNA sequencing, the expression of Litaf was shown to increase in monocyte-derived alveolar macrophages which were associated with asbestos-induced pulmonary fibrosis (Joshi et al. Citation2020). It is important to note that we observed modulation of TFs involved in cancer development and progression only following exposure to NM-401, which is long and thick. This CNT presents a morphology similar to that of MWNT-7, which induced lung tumors in rats following inhalation (Kasai et al. Citation2016). Therefore, there can be concerns about the long-term toxic effect of such long and thick MWCNTs on lung diseases.
These omics data are in accordance with the hypothesis that NM-401 and NM-403, with strikingly different physical properties, may have different modes of action. On one hand, the long and thick NM-401 induced a dose-dependent increase of DEGs and DEPs that decrease over time. On the other hand, the short and thin NM-403 modulated a more constant number of DEGs and DEPs at all post-exposure times, in accordance with long-term pulmonary inflammation. A persistent state of inflammation can be the starting point of tissue disorders and consequently the development of lung pathology.
Conclusion
This work shows that regardless of their particular morphology, MWCNTs induce lung inflammation and modulate expression of genes and proteins, as well as altering pathways involved in this process. However, these morphological differences are linked with the alteration of pathways that may be specific to a given carbon nanotube. Such toxicogenomics approaches shed a new light on the toxicological profile of MWCNTs and may help to explain differences in terms of toxicity potentials between various carbon nanotubes. This study showed that even if exposure to a CNT induced a moderate influx of neutrophils, it modulated the expression of genes that could be involved in lung pathologies. In addition, this study supports the other observations showing different molecular responses to long and short CNTs. Therefore, the method employed in this study helped to distinguish MWCNTs and gain a deeper mechanistic understanding of key events that could result in different toxicological response.
Supplemental Material
Download Zip (76.6 MB)Acknowledgments
The authors gratefully acknowledge Laëtitia Chézeau for the training on transcriptomics; Sylvie Sébillaud and Mylène Lorcin for animal exposure and sample collection; Stéphane Grossmann, Stéphane Viton and Hervé Nunge for aerosol generation and characterization; Sylvie Michaux and Laurine Douteau for animal care and husbandry.
Disclosure statement
The authors declare that they have no conflicts of interest to disclose.
Data availability statement
The neutrophil influx datasets supporting the conclusions of this article are included in (Gate et al. Citation2019). Raw data are available upon request to the corresponding author. The transcriptomic datasets are available in the GEO repository under number GSE113532 (http://www.ncbi.nlm.nih.gov/geo/). The proteomics dataset generated for this study can be found in the PRIDE database (http://www.ebi.ac.uk/pride), with the identifier PXD18900 (Vizcaino et al. Citation2016).
Additional information
Funding
References
- Almuttaqi, H., and I. A. Udalova. 2019. “Advances and Challenges in Targeting IRF5, a Key Regulator of Inflammation.” The FEBS Journal 286 (9): 1624–1637. doi:10.1111/febs.14654.
- Argelaguet, R., B. Velten, D. Arnol, S. Dietrich, T. Zenz, J. C. Marioni, F. Buettner, W. Huber, and O. Stegle. 2018. “Multi-Omics Factor Analysis – a Framework for Unsupervised Integration of Multi-Omics Data Sets.” Molecular Systems Biology 14 (6): e8124. doi:10.15252/msb.20178124.
- Bie, L. Y., D. Li, Y. Wei, N. Li, X. B. Chen, and S. X. Luo. 2019. “SOX13 Dependent PAX8 Expression Promotes the Proliferation of Gastric Carcinoma cells.” Artificial Cells, Nanomedicine, and Biotechnology 47 (1): 3180–3187. doi:10.1080/21691401.2019.1646751.
- Bolstad, B. M., R. A. Irizarry, M. Astrand, and T. P. Speed. 2003. “A Comparison of Normalization Methods for High Density Oligonucleotide Array Data Based on Variance and Bias.” Bioinformatics (Oxford, England) 19 (2): 185–193. doi:10.1093/bioinformatics/19.2.185.
- Caberoy, N. B., D. Maiguel, Y. Kim, and W. Li. 2010. “Identification of Tubby and Tubby-like Protein 1 as Eat-Me Signals by Phage Display.” Experimental Cell Research 316 (2): 245–257. doi:10.1016/j.yexcr.2009.10.008.
- Chezeau, L., S. Sebillaud, R. Safar, C. Seidel, D. Dembele, M. Lorcin, C. Langlais, et al. 2018. “Short- and Long-Term Gene Expression Profiles Induced by Inhaled TiO2 Nanostructured Aerosol in Rat Lung.” Toxicology and Applied Pharmacology 356: 54–64. doi:10.1016/j.taap.2018.07.013.
- Cox, J., M. Y. Hein, C. A. Luber, I. Paron, N. Nagaraj, and M. Mann. 2014. “Accurate Proteome-Wide Label-Free Quantification by Delayed Normalization and Maximal Peptide Ratio Extraction, Termed MaxLFQ.” Molecular & Cellular Proteomics : MCP 13 (9): 2513–2526. doi:10.1074/mcp.M113.031591.
- Ellinger-Ziegelbauer, H., and J. Pauluhn. 2009. “Pulmonary Toxicity of Multi-Walled Carbon Nanotubes (Baytubes) Relative to Alpha-Quartz Following a Single 6h Inhalation Exposure of Rats and a 3 Months Post-Exposure Period.” Toxicology 266 (1-3): 16–29. doi:10.1016/j.tox.2009.10.007.
- Fujita, K., M. Fukuda, S. Endoh, J. Maru, H. Kato, A. Nakamura, N. Shinohara, K. Uchino, and K. Honda. 2015. “Size Effects of Single-Walled Carbon Nanotubes on In Vivo and In Vitro Pulmonary Toxicity.” Inhalation Toxicology 27 (4): 207–223. doi:10.3109/08958378.2015.1026620.
- Gabay, M., Y. Li, and D. W. Felsher. 2014. MYC Activation Is a Hallmark of Cancer Initiation and Maintenance. Cold Spring Harbor Perspectives in Medicine 4: a014241.
- Gate, L., K. B. Knudsen, C. Seidel, T. Berthing, L. Chezeau, N. R. Jacobsen, S. Valentino, et al. 2019. “Pulmonary Toxicity of Two Different Multi-Walled Carbon Nanotubes in Rat: Comparison Between Intratracheal Instillation and Inhalation Exposure.” Toxicology and Applied Pharmacology 375: 17–31. doi:10.1016/j.taap.2019.05.001.
- Girvan, M., and M. E. Newman. 2002. “Community Structure in Social and Biological Networks.” Proceedings of the National Academy of Sciences of the United States of America 99 (12): 7821–7826. doi:10.1073/pnas.122653799.
- Guseva Canu, I., K. Batsungnoen, A. Maynard, and N. B. Hopf. 2020. “State of Knowledge on the Occupational Exposure to Carbon Nanotubes.” International Journal of Hygiene and Environmental Health 225: 113472. doi:10.1016/j.ijheh.2020.113472.
- Hu, H., Y. R. Miao, L. H. Jia, Q. Y. Yu, Q. Zhang, and A. Y. Guo. 2019. “AnimalTFDB 3.0: A Comprehensive Resource for Annotation and Prediction of Animal Transcription Factors.” Nucleic Acids Research 47 (D1): D33–D38. doi:10.1093/nar/gky822.
- Huynh-Thu, V. A., A. Irrthum, L. Wehenkel, and P. Geurts. 2010. “Inferring Regulatory Networks from Expression Data Using Tree-Based Methods.” PLoS One 5 (9): e12776. doi:10.1371/journal.pone.0012776.
- IARC. 2017. “Some Nanomaterials and Some Fibres.” IARC Monographs on the Evaluation of Carcinogenic Risks to Humans 111: 35–214.
- Joshi, N., S. Watanabe, R. Verma, R. P. Jablonski, C. I. Chen, P. Cheresh, N. S. Markov, et al. 2020. “A Spatially Restricted Fibrotic Niche in Pulmonary Fibrosis is Sustained by M-CSF/M-CSFR Signalling in Monocyte-Derived Alveolar Macrophages.” European Respiratory Journal 55 (1): 1900646. doi:10.1183/13993003.00646-2019.
- JRC. 2014. Multi-Walled Carbon Nanotubes, NM-400, NM-401, NM-402, NM-403: Characterisation and Physico-Chemical Properties. JRC Repository: NM-Series of Representative Manufactured Nanomaterials. Luxembourg: Publications Office of the European Union.
- Kanehisa, M., M. Furumichi, M. Tanabe, Y. Sato, and K. Morishima. 2017. “KEGG: New Perspectives on Genomes, Pathways, Diseases and Drugs.” Nucleic Acids Research 45 (D1): D353–D361. doi:10.1093/nar/gkw1092.
- Kasai, T., Y. Umeda, M. Ohnishi, H. Kondo, T. Takeuchi, S. Aiso, T. Nishizawa, M. Matsumoto, and S. Fukushima. 2015. “Thirteen-Week Study of Toxicity of Fiber-like Multi-Walled Carbon Nanotubes with Whole-Body Inhalation Exposure in Rats.” Nanotoxicology 9 (4): 413–422. doi:10.3109/17435390.2014.933903.
- Kasai, T., Y. Umeda, M. Ohnishi, T. Mine, H. Kondo, T. Takeuchi, M. Matsumoto, and S. Fukushima. 2016. “Lung Carcinogenicity of Inhaled Multi-Walled Carbon Nanotube in Rats.” Particle and Fibre Toxicology 13 (1): 53. doi:10.1186/s12989-016-0164-2.
- Kim, H. 2017. “The Transcription Factor MafB Promotes Anti-Inflammatory M2 Polarization and Cholesterol Efflux in Macrophages.” Scientific Reports 7 (1): 7591. doi:10.1038/s41598-017-07381-8.
- Liao, G. B., X. Z. Li, S. Zeng, C. Liu, S. M. Yang, L. Yang, C. J. Hu, and J. Y. Bai. 2018. “Regulation of the Master Regulator FOXM1 in Cancer.” Cell Communication and Signaling 16 (1): 57. doi:10.1186/s12964-018-0266-6.
- Liu, J., Y. Wang, M. J. Birnbaum, and D. A. Stoffers. 2010. “Three-Amino-Acid-Loop-Extension Homeodomain Factor Meis3 Regulates Cell Survival via PDK1.” Proceedings of the National Academy of Sciences of the United States of America 107 (47): 20494–20499. doi:10.1073/pnas.1007001107.
- Luk, I. Y., C. M. Reehorst, and J. M. Mariadason. 2018. “ELF3, ELF5, EHF and SPDEF Transcription Factors in Tissue Homeostasis and Cancer.” Molecules 23 (9): 2191. doi:10.3390/molecules23092191.
- Muller, J., M. Delos, N. Panin, V. Rabolli, F. Huaux, and D. Lison. 2009. “Absence of Carcinogenic Response to Multiwall Carbon Nanotubes in a 2-Year Bioassay in the Peritoneal Cavity of the Rat.” Toxicological Sciences 110 (2): 442–448. doi:10.1093/toxsci/kfp100.
- Musa, J., M. M. Aynaud, O. Mirabeau, O. Delattre, and T. G. Grunewald. 2017. “MYBL2 (B-Myb): a Central Regulator of Cell Proliferation, Cell Survival and Differentiation Involved in Tumorigenesis.” Cell Death & Disease 8 (6): e2895 doi:10.1038/cddis.2017.244.
- Nahle, S., H. Cassidy, M. M. Leroux, R. Mercier, J. Ghanbaja, Z. Doumandji, D. Matallanas, B. H. Rihn, O. Joubert, and L. Ferrari. 2020. “Genes Expression Profiling of Alveolar Macrophages Exposed to Non-Functionalized, Anionic and Cationic Multi-Walled Carbon Nanotubes Shows Three Different Mechanisms of Toxicity.” Journal of Nanobiotechnology 18 (1): 36. doi:10.1186/s12951-020-0587-7.
- Napolitano, G., and A. Ballabio. 2016. “TFEB at a Glance.” Journal of Cell Science 129 (13): 2475–2481. doi:10.1242/jcs.146365.
- Nie, L., G. Wu, D. E. Culley, J. C. Scholten, and W. Zhang. 2007. “Integrative Analysis of Transcriptomic and Proteomic Data: Challenges, Solutions and Applications.” Critical Reviews in Biotechnology 27 (2): 63–75. doi:10.1080/07388550701334212.
- Porter, D. W., A. F. Hubbs, B. T. Chen, W. Mckinney, R. R. Mercer, M. G. Wolfarth, L. Battelli, et al. 2013. “Acute Pulmonary Dose-Responses to Inhaled Multi-Walled Carbon Nanotubes.” Nanotoxicology 7 (7): 1179–1194. doi:10.3109/17435390.2012.719649.
- Poulsen, S. S., P. Jackson, K. Kling, K. B. Knudsen, V. Skaug, Z. O. Kyjovska, B. L. Thomsen, et al. 2016. “Multi-Walled Carbon Nanotube Physicochemical Properties Predict Pulmonary Inflammation and Genotoxicity.” Nanotoxicology 10 (9): 1263–1275. doi:10.1080/17435390.2016.1202351.
- Poulsen, S. S., K. B. Knudsen, P. Jackson, I. E. Weydahl, A. T. Saber, H. Wallin, and U. Vogel. 2017. “Multi-Walled Carbon Nanotube-Physicochemical Properties Predict the Systemic Acute Phase Response Following Pulmonary Exposure in Mice.” PLoS One 12 (4): e0174167. doi:10.1371/journal.pone.0174167.
- Poulsen, S. S., A. T. Saber, A. Williams, O. Andersen, C. Kobler, R. Atluri, M. E. Pozzebon, et al. 2015. “MWCNTs of Different Physicochemical Properties Cause Similar Inflammatory Responses, but Differences in Transcriptional and Histological Markers of Fibrosis in Mouse lungs.” Toxicology and Applied Pharmacology 284 (1): 16–32. doi:10.1016/j.taap.2014.12.011.
- Rahman, L., D. Wu, M. Johnston, A. William, and S. Halappanavar. 2017. “Toxicogenomics Analysis of Mouse Lung Responses Following Exposure to Titanium Dioxide Nanomaterials Reveal Their Disease Potential at High Doses.” Mutagenesis 32 (1): 59–76. doi:10.1093/mutage/gew048.
- Rappsilber, J., M. Mann, and Y. Ishihama. 2007. “Protocol for Micro-Purification, Enrichment, Pre-Fractionation and Storage of Peptides for Proteomics Using StageTips.” Nature Protocols 2 (8): 1896–1906. doi:10.1038/nprot.2007.261.
- Raudvere, U., L. Kolberg, I. Kuzmin, T. Arak, P. Adler, H. Peterson, and J. Vilo. 2019. “g:Profiler: A Web Server for Functional Enrichment Analysis and Conversions of Gene Lists (2019 Update).” Nucleic Acids Research 47 (W1): W191–W198. doi:10.1093/nar/gkz369.
- Ritchie, M. E., B. Phipson, D. Wu, Y. Hu, C. W. Law, W. Shi, and G. K. Smyth. 2015. “Limma Powers Differential Expression Analyses for RNA-Sequencing and Microarray Studies.” Nucleic Acids Research 43 (7): e47 doi:10.1093/nar/gkv007.
- Rittinghausen, S., A. Hackbarth, O. Creutzenberg, H. Ernst, U. Heinrich, A. Leonhardt, and D. Schaudien. 2014. “The Carcinogenic Effect of Various Multi-Walled Carbon Nanotubes (MWCNTs) after Intraperitoneal Injection in Rats.” Particle and Fibre Toxicology 11: 59. doi:10.1186/s12989-014-0059-z.
- Rivero, S., M. Ceballos-Chavez, S. S. Bhattacharya, and J. C. Reyes. 2015. “HMG20A Is Required for SNAI1-Mediated Epithelial to Mesenchymal Transition.” Oncogene 34 (41): 5264–5276. doi:10.1038/onc.2014.446.
- Serra, A., M. Fratello, L. Cattelani, I. Liampa, G. Melagraki, P. Kohonen, P. Nymark, et al. 2020. “Transcriptomics in Toxicogenomics, Part III: Data Modelling for Risk Assessment.” Nanomaterials 10 (4): 708. doi:10.3390/nano10040708.
- Shannon, P., A. Markiel, O. Ozier, N. S. Baliga, J. T. Wang, D. Ramage, N. Amin, B. Schwikowski, and T. Ideker. 2003. “Cytoscape: A Software Environment for Integrated Models of Biomolecular Interaction Networks.” Genome Research 13 (11): 2498–2504. doi:10.1101/gr.1239303.
- Snyder-Talkington, B. N., J. Dymacek, D. W. Porter, M. G. Wolfarth, R. R. Mercer, M. Pacurari, J. Denvir, V. Castranova, Y. Qian, and N. L. Guo. 2013. “System-Based Identification of Toxicity Pathways Associated with Multi-Walled Carbon Nanotube-Induced Pathological Responses.” Toxicology and Applied Pharmacology 272 (2): 476–489. doi:10.1016/j.taap.2013.06.026.
- Su, G., A. Kuchinsky, J. H. Morris, D. J. States, and F. Meng. 2010. “GLay: Community Structure Analysis of Biological Networks.” Bioinformatics (Oxford, England) 26 (24): 3135–3137. doi:10.1093/bioinformatics/btq596.
- Suzui, M., M. Futakuchi, K. Fukamachi, T. Numano, M. Abdelgied, S. Takahashi, M. Ohnishi, et al. 2016. “Multiwalled Carbon Nanotubes Intratracheally Instilled into the Rat Lung Induce Development of Pleural Malignant Mesothelioma and Lung Tumors.” Cancer Science 107 (7): 924–935. doi:10.1111/cas.12954.
- Taefehshokr, S., Y. A. Key, M. Khakpour, P. Dadebighlu, and A. Oveisi. 2017. “Early Growth Response 2 and Egr3 Are Unique Regulators in Immune System.” Central-European Journal of Immunology 42 (2): 205–209. doi:10.5114/ceji.2017.69363.
- The Gene Ontology Consortium. 2019. “The Gene Ontology Resource: 20 Years and Still GOing Strong.” Nucleic Acids Research. 47: D330–D338.
- Van Dam, S., U. Vosa, A. Van Der Graaf, L. Franke, and J. P. De Magalhaes. 2018. “Gene Co-Expression Analysis for Functional Classification and Gene-Disease Predictions.” Briefings in bioinformatics 19: 575–592.
- Vizcaino, J. A., A. Csordas, N. Del-Toro, J. A. Dianes, J. Griss, I. Lavidas, G. Mayer, et al. 2016. “2016 Update of the PRIDE Database and Its Related Tools.” Nucleic Acids Research 44 (22): 11033. doi:10.1093/nar/gkw880.
- Williams, K. L., I. Nanda, G. E. Lyons, C. T. Kuo, M. Schmid, J. M. Leiden, M. H. Kaplan, and E. J. Taparowsky. 2001. “Characterization of Murine BATF: A Negative Regulator of Activator Protein-1 Activity in the Thymus.” European Journal of Immunology 31 (5): 1620–1627. doi:10.1002/1521-4141(200105)31:5<1620::AID-IMMU1620>3.0.CO;2-3.
- Yamamoto, M., E. Cid, S. Bru, and F. Yamamoto. 2011. “Rare and Frequent Promoter Methylation, Respectively, of TSHZ2 and 3 Genes That Are Both Downregulated in Expression in Breast and Prostate cancers.” PLoS One 6 (3): e17149. doi:10.1371/journal.pone.0017149.
- Zhernovkov, V., T. Santra, H. Cassidy, O. Rukhlenko, D. Matallanas, A. Krstic, W. Kolch, V. Lobaskin, and B. N. Kholodenko. 2019. “An Integrative Computational Approach for a Prioritization of Key Transcription Regulators Associated with Nanomaterial-Induced Toxicity.” Toxicological Sciences 171 (2): 303–314.
- Zou, J., P. Guo, N. Lv, and D. Huang. 2015. “Lipopolysaccharide-Induced Tumor Necrosis Factor-α Factor Enhances Inflammation and Is Associated with Cancer (Review).” Molecular Medicine Reports 12 (5): 6399–6404. doi:10.3892/mmr.2015.4243.