
 ?Mathematical formulae have been encoded as MathML and are displayed in this HTML version using MathJax in order to improve their display. Uncheck the box to turn MathJax off. This feature requires Javascript. Click on a formula to zoom.
Abstract
Microplastic (MP) pollution in the environment is increasing, leading to growing concerns about human exposures and the subsequent impact on health. Although marine MP research has received significant attention in recent years, only a few studies have attempted characterization of MP in air and examined the MP uptake and influence via inhalation on human health. Moreover, the methods used for MP characterization in the marine environment require further optimization to be applicable to MP in the air. This paper details method for collecting and characterizing MP < 2.5 μm in air samples for the purposes of toxicological assessment. The first phase of the study evaluated (a) the suitability of various filter types to collect respirable airborne MP <2.5 μm, and; (b) the ability of Raman and enhanced darkfield-hyperspectral spectroscopy methods to identify MP reference standards collected from spiked filters and in cells after exposure to reference MP. In the second phase, these methods were employed to characterize MP <2.5 μm in personal, indoor and outdoor filter air samples and in cells following exposure to filter extracted material. The results showed the presence of a variety of MP in the respirable size fraction (0.1–1 µm aerodynamic diameter). Silver membrane filters were found not suitable for collecting and analyzing MP <2.5 μm. While it was easy to detect reference MP in cells post-exposure, the identity of only two types of air-borne MP was confirmed in cells. The study highlighted possible sources of artifacts and inconsistencies in analyzing airborne MP.
1. Introduction
Microplastics (MP) are plastic polymer particles measuring less than five millimeters in length (Huppertsberg and Knepper Citation2018; Ivleva, Wiesheu, and Niessner Citation2017; Weinstein, Crocker, and Gray Citation2016). A wide variety of MP polymers are released into the environment, including primary MP manufactured intentionally for industrial and consumer applications (e.g. clothing, cosmetics, skin care products, pharmaceuticals) (Gregory Citation1996) and secondary MP resulting from the fragmentation or weathering of larger plastics due to photochemical, biological, chemical and mechanical processes (Gewert, Plassmann, and MacLeod Citation2015). It is likely that some MP are readily suspended into the air because of their small size and low density (Allen et al. Citation2019). As MP pollution increases, concerns about their potential impacts on health are growing.
Most research to date has focused on the presence and impact of MP on the marine environment and organisms (Haegerbaeumer et al. Citation2019; Lim, Fraser, and Knights Citation2020) as millions of tonnes of plastic waste are released into the marine water every year (Gallo et al. Citation2018). While the knowledge gained from research in the marine environment is helpful, characterizing MP in air necessitates different methods, due to differences in the background composition, sampling methods, and relevant size fraction, with air pollution research typically focusing on particles smaller than 2.5 microns in aerodynamic diameter.
A few studies have investigated exposure to MP from indoor and outdoor air but with substantial limitations (Abbasi et al. Citation2019; Bergmann et al. Citation2019; Cai et al. Citation2017; Dris et al. Citation2017; Klein and Fischer Citation2019; Liu et al. Citation2019). A study by Dris et al. showed higher numbers of plastic fibers indoors than in outdoor air near Paris, France (Dris et al. Citation2017). Another study analyzed indoor and outdoor dust samples collected from 39 major cities in China, and showed high levels of MP in indoor dust, with polyethylene terephthalate (PET) and polycarbonate (PC) fibers being the major compositional types (Liu et al. Citation2019). However, these studies reported fibers larger than the respirable size fraction, highlighting the need for improved methods for conducting human health-relevant MP research in the air. Even though, these studies suggested the large abundance of MP in the air from different regions, they were only able to detect and characterize MP ≥5.5 µm due to the limitation of analytical methods used (Abbasi et al. Citation2019; Bergmann et al. Citation2019; Cai et al. Citation2017; Dris et al. Citation2015; Dris et al. Citation2017; Klein and Fischer Citation2019; Liu et al. Citation2019). Recently, two other studies reported the detection of MP ≥ 2 µm (Levermore et al. Citation2020; Prata et al. Citation2020). Thus, the current state of knowledge of MP in the air is inconsistent and unclear.
As most people spend approximately 90% of their time indoors, data on both indoor and outdoor MP exposures will be required to understand their sources, pathways, fate, and distribution. This information can be used to identify and prioritize specific MP categories or mixtures for future targeted research, risk assessment and management.
Occupational studies investigating toxicity associated with exposure to airborne MP have been conducted (Vianello et al. Citation2019; Ragusa et al. Citation2021). Vianello et al. showed that the fraction of MP present in inhaled indoor air samples is non-negligible (272 MP/day) using a simulation method (Vianello et al. Citation2019). However, in a recent study, Ragusa et al. detected microplastics in the human placenta (Ragusa et al. Citation2021). What these results from occupational settings mean to public health is still uncertain and hence needs further investigation. In a study by Pauly et al., plastic fibers were found in 99 of 114 fresh human lung specimens obtained from non-neoplastic or malignant lung tissues, with more frequent observations of plastic in the malignant tissues (Pauly et al. Citation1998). The study suggested that the bio-resistant and bio-persistent plastic fibers can trigger foreign body reactions and contribute to chronic inflammation, malignant and nonmalignant lung diseases in humans (Pauly et al. Citation1998). However, with the methodologies used in the study, it was not possible to distinguish if the detected MP are man-made polymers or originated from natural fibers. More recently, Raman spectroscopy was used to detect MP in human lungs obtained at autopsy (Amato-Lourenço et al. Citation2021). In another study, using µFTIR MP were detected in human lungs presenting with ground glass nodules (Chen et al. Citation2021). However, the limitations of current methods for analyzing MP exposure in air together with lack of MP exposure data have impeded the progress in the field of MP inhalation toxicology. Moving forward, optimization of exposure characterization methodologies and targeted toxicological research is needed to characterize the hazards of MP exposure via inhalation.
MP characterization includes size, morphology, composition and abundance. The current analytical methods available for MP identification and characterizations are (i) gas chromatography techniques – desorption gas chromatography mass spectroscopy (TED GC-MS) (Duemichen et al. Citation2014; Dümichen et al. Citation2015; Dümichen et al. Citation2017; Eisentraut et al. Citation2018) and pyrolysis gas chromatography (Py-GC-MS) (Fischer and Scholz-Böttcher Citation2017; Mintenig et al. Citation2018) and (ii) spectroscopy methods – Focal Plane Array Fourier Infrared spectroscopy (FPA-FTIR) (Huppertsberg and Knepper Citation2018; Ivleva, Wiesheu, and Niessner Citation2017; Joachim et al. Citation2015; Käppler et al. Citation2016; Primpke et al. Citation2017; Simon, van Alst, and Vollertsen Citation2018) and Raman spectroscopy (Araujo et al. Citation2018; Lenz et al. Citation2015; Zhao et al. Citation2017). However, the gas chromatography techniques require particle decomposition, preventing a comprehensive MP characterization. Both FPA-FTIR and Raman spectroscopy methods can be used to determine MP composition, size and morphology, with detection limits of 10 µm (Joachim et al. Citation2015; Vianello et al. Citation2019) and ≥ 2 µm (Ballent et al. Citation2016; Enders et al. Citation2015; Frére et al. Citation2016; Zada et al. Citation2018), respectively. However, very few studies have used FPA-FTIR or µFTIR to detect MP smaller than ∼10 µm (Vianello et al. Citation2019). Recently, Enhanced Darkfield (EDF) nanoscale hyperspectral spectroscopic imaging (HSI) has shown promise for MP detection in complex matrices as it can detect MP in the range of ultrafine nanometer size fraction (Fournier et al. Citation2020).
The objective of the present study was to optimize sample collection and subsequent microscopic and analytical methods to detect and characterize different types of MP <2.5 μm in diameter. The study examined sample collection filter matrices, and the applicability of the EDF-HSI integrated with Raman spectroscopy to identify and characterize MP <2.5 μm in real-world air samples and in cells after exposure. The project was carried out in two phases; first, the study evaluated the suitability of various filter types to collect airborne MP <2.5 μm, and tested the ability of various analytical methods to identify MP reference standards; second, the optimized methods were deployed to characterize MP <2.5 μm in personal, indoor, outdoor air samples and in cells exposed to MP derived from air filters.
2. Methodology
2.1. Materials
2.1.1. Reference MP
Aqueous suspension of unmodified polystyrene (PS) beads of various sizes (1 µm, 300 nm, 100 nm and 60 nm) and ethylene tetrafluoroethylene beads (ETFE, ∼300 nm) (National Institute of Standards and Technology (NIST), Maryland, United States); Low-density polyethylene (LDPE) large beads (non-nano certified reference material, Sigma Aldrich, Mississauga); polyamide-nylon powder (5–50 µm, non-nano certified reference material, Sigma Aldrich, Mississauga) and polypropylene (PP) large beads (non-nano certified reference material, NIST, Maryland, United States) were used as reference MP. The 1 µm, 300 nm, and 100 nm PS suspensions contained an emulsifier (possibly sodium lauryl sulfate or sodium 1-dodecanesulfonate and 1-dodecanol at a concentration < 0.05%) as well as an electrolyte (∼0.02%) to prevent agglomeration. The 1 µm and 300 nm PS suspension also contained 50 ppm sodium azide to retard the growth of algae and bacteria. The 60 nm PS bead contained a carboxyl group, thus no additional surfactant was not required to stabilize the suspension.
2.1.2. Imaging instruments
The imaging system couples an EDF optical microscope and hyperspectral imaging (HSI) (CytoViva, Inc. Auburn, AL, USA) with a confocal Raman imaging system (Horiba Scientific XploRa Plus, Japan). The EDF-HSI images were analyzed using Environment for Visualization (ENVI 4.8, CytoViva, Inc. Auburn, AL, USA) software. The LabSpec 6 software suite (Horiba Ltd, Piscataway, NJ, USA) was used for the acquisition of Raman spectral information and the KnowItAll spectral database (Bio-Rad Laboratories Inc., Hercules, CA, USA) was used to identify the MP type.
2.2. Air sampling (PM2.5)
This study used a combination of newly collected air samples, and samples from previously completed studies (Nethery et al. Citation2014). Previously collected samples included personal, indoor and outdoor air samples collected on Teflon (poly tetra fluoro ethylene, Pall-Gelman PTFE, VWR, Mississauga, Ontario, Canada) filters. New sampling in one home was carried out to evaluate whether silver membrane filters would be better for collecting MP, whereas samples collected on the other filter types were already available for analysis.
2.2.1. Personal air sample collection
The sampling procedure is described in Nethery et al. (Citation2014). In brief, 24 h particulate matter that has an aerodynamic diameter of less than 2.5 µm (PM2.5) samples were collected on 37 mm Teflon filters with a membrane pore size of 0.2 µm from a 10-day study of 54 children with asthma living in Montreal (Montreal Asthma Study (MAS)), Canada. The sampling was conducted for 24 h using a personal environmental monitor (PEM) (Chempass System R&P/Thermo, Waltham, MA, USA) at 4 L/min with the aid of a pump.
2.2.2. Outdoor and indoor air sample collection
Seven-day outdoor PM2.5 samples were also collected in 2007–2008 on 47 mm Teflon filters with a membrane pore size of 0.2 µm during a study of people diagnosed with congestive heart failure in Montreal (Montreal Congestive Heart Failure (MCHF)), Canada, using OMNI FT ambient air samplers (BGI by MESA Labs, Butler, NJ) fitted with 5 L/min PM2.5 impactors. In the same study, 7-day indoor and outdoor PM2.5 samples were collected on 37 mm Teflon filters using Harvard cascade impactors (HSPH, Boston, MA) at 5 L/min. Pre- and post-sampling flow calibrations and flow checks were performed using a DryCal DC Lite air flow calibrator (BGI by MESA Labs, Butler, NJ). Sample masses were obtained for the archived PM2.5 samples.
Outdoor PM2.5 samples were also collected during the above-mentioned study of children with asthma living in Montreal, Canada, using the same sampling equipment used for collecting personal air samples. Samplers were placed on tripods in regions with urban backgrounds and located at one of 4 ambient monitoring locations -in National Air Pollution Surveillance (NAPS) stations and City-run air monitoring stations around the East End on the Island of Montreal, Canada.
2.2.3. Indoor air sample collection on silver membrane filter
New indoor PM2.5 samples were collected on 37 mm silver membrane filters with a pore size of 1.2 µm (Sterlitech Corporation, WA, USA), at one of the author’s homes in Fall 2019. Harvard cascade impactors (HSPH, Boston, MA) were used to collect 96 h samples at 5 L/min. Pre- and post-sampling flow calibrations and flow checks were performed using a DeltaCal DC1 air flow calibrator (BGI by MESA Labs, Butler, NJ). Samplers were placed on tripods and located in the researcher’s living room.
2.3. Phase 1: Optimizing the MP collection and detection procedure
2.3.1. Reference materials and sample preparation
Commercially available reference MP was used to determine whether the analytical methods could accurately identify known MP, and the influence of substrates and filters used on the analysis. These included PS (1 µm, 300 nm, 100 nm, 60 nm, microbead suspension in water), LDPE (bulk size pellet), PP (bulk size pellet), and ETFE (microbead suspension in water) with mixed ETFE microbead size range of 100–300 nm.
For direct visualization and analysis by Raman, the stock suspensions (as purchased) of reference MP were sonicated at room temperature for 1 min in a Bransonic digital ultrasonic water bath sonicator (model 2800, Branson, Danbury, USA) at high power. Then, 5 µL of the suspension was deposited on a calcium fluoride slide fluoride (CaF2) slide (75 × 25 × 1 mm, Crystran, UK) or silica glass slide (Soda-lime silica microscope slide, 75 × 25 × 1 mm, VWR, Mississauga, Ontario) using a Hamilton glass syringe. For EDF-HSI, the original stock suspensions were diluted in MilliQ water − 1:8 for 1 µm and 300 nm PS and, 1:2 for 100 nm and 60 nm PS. A small aliquot (5 µL) of the diluted stock suspension was deposited on the silica glass slide (Soda-lime silica microscope slide, 75 × 25 × 1 mm, VWR, Mississauga, Ontario). The suspensions were spread to a thin and uniform layer, covered with a cover slip and sealed (silica, 75 × 25 × 0.2 mm, VWR, Mississauga, Ontario). Three samples of each reference MP type were analyzed by both Raman and EDF-HSI.
Since commercially available reference MP does not represent what is present in the air, in addition to reference materials, MP was prepared from UV weathering of the commonly used plastic materials. Polyethylene grocery bags, soft flexible and hard clear food packaging plastics and synthetic plastic rope were used. Plastic materials were thoroughly washed with 70% ethanol followed by MilliQ water (filtered through filter membrane with 0.22 µm pore size). Three 0.25 cm2 pieces of each cleaned plastic material were placed in 20 mL scintillation glass bottles and 200 µL of sterile water (filtered through the 0.22 µm pore size membrane) was added. The samples were irradiated with UV light for 1 h in a biosafety cabinet and sonicated at 40 Hz in a Branson Water Bath. Using Raman, 5 µl of the sonicated mix deposited on the CaF2 slide was characterized.
For the analysis of reference MP deposited on filters, clean filters were deposited with 5 µl of undiluted or diluted stock suspensions of PS of different sizes and air-dried. A small piece (1/8th) from each Teflon and silver membrane filter deposited with PS beads or blank Teflon and silver membrane filters were used. This fraction of a filter represented the optimal balance between analysis time per sample and analysis of the largest amount of filter material in that time. In a parallel analysis, ambient air samples collected on Teflon and silver membrane filters were spiked with 5 µl of a mixture of individual reference MP investigated in the study. One-eighth of the unexposed side of the spiked filters were also directly mounted on the soda-lime-silica glass slide and imaged by Raman microscope. It is important to note that for the direct analysis of samples on the filters, the background of slides or substrate on which the filters are mounted has little influence as the objectives are focused on filters. The microscope was first focused on the soda-lime-silica glass and then focused on the filter for the analysis. Filters mounted on slides were analyzed only by the Raman method.
2.3.2. Characterization of MP collected on air sampling filters
2.3.2.1. Visualization and characterization of MP in air samples using Raman
For characterizing MP using Raman spectroscopy, the conditions for optimization included: the type of substrate for sample mounting (soda-lime-silica glass slide or CaF2 slide); laser wavelength (532 nm and 785 nm); grating (300, 600, 1200 lines mm−1); laser intensity (1mW, 10mW and 25mW); duration of laser exposure (2 s–20 s); and the number of spectra accumulations (2–10). It is a routine practice to increase the number of spectra accumulation for the same particle to increase the Raman intensity to obtain meaningful information without increasing the laser intensity, which could damage the particle. For each sample, 4–10 particles were analyzed. Since it was not possible to distinguish micron size particles visually, shape (fibers) and non-shiny particulates were targeted for the Raman analysis.
Slides were visualized under 10x, 50x and 100x magnification using brightfield illumination. For the Raman analysis of MP smaller than 300 nm, 100x magnification was used and for MP larger than 300 nm, 10x and 50x magnifications were used. Samples were first screened using the 10x microscope objective followed by specific assessment using higher magnifications. The diameters of particles or the length/width of fibers were measured using the brightfield images in ImageJ software (National Institute of Health, Bethesda, MD).
When 100x objective was used, before visualization, a CaF2 coverslip with a 13 mm diameter and 0.2 mm thickness (Crystran, UK) was placed over the sample without sealing to avoid contamination of the lenses. Raman spectra with high resolutions were characterized for chemical composition and size. The ocular micrometer in the Raman imaging system was calibrated for each objective lens once during instrument setup to confirm the visual resolution. The Raman system was auto-calibrated each day for system validation using a patented Raman objective (Standard PRO), prior to spectral acquisition. The calibration standard used was a NIST-certified PS material.
2.3.2.2. MP detection using EDF-HSI
The EDF-HSI system (CytoViva, Inc. Auburn, AL, USA) and its principles for the detection of nanoscale materials have been described previously (Boyadzhiev et al. Citation2020; Husain et al. 2013; Roth et al. 2015). In brief, EDF-HSI profiles the light scattered by a given particle at a single-pixel level, which is used to construct a spectral library for that particle (Boyadzhiev et al. Citation2020) or in this case, MP. The resulting reference library is then used to detect the presence of that particular MP in a complex matrix (e.g. air sample) by correlational spectral angle mapping using a spectral classification algorithm. Particles are considered hits when the spectral angles between the reference spectral library and sample spectra are ≤0.1 radians. In the current study, EDF-HSI was used to create spectral libraries of standard MP for the purpose of identifying those MP in spiked air samples.
Blank soda-lime-silica glass slides were deposited with each reference MP and imaged at 100x magnification. HSIs were captured from at least one field of view from three samples for each reference MP. Exposure parameters, i.e. duration of exposure and gain were determined by the MP luminosity. These factors were calibrated for each MP sample to avoid pixel saturation and spectral distortion. The imaging system allows imaging of one line at a time in the field of view, and the collection of spatial and spectral information of each pixel in a line simultaneously. A particle filter algorithm was used to select pixel clusters in the HSI and to collect the corresponding spectral information from each pixel. Background spectra arising from negative controls, in this case from water, were subtracted from MP-specific spectral libraries using a particle filter algorithm to minimize any false positives. Thus, spectral information of the reference MP was obtained in a consistent and reproducible manner. The particle filter algorithm is a set of Monte Carlo algorithm which can efficiently determine the probability of location and orientation of a particle in a field of an image similar to particle filtering in ImageJ (Arulampalam et al. Citation2002). Spectral libraries were also created for each MP type generated from UV-irradiated plastic items collected from the environment – polyethylene bag, flexible food packaging plastic, synthetic rope and hard clear food packaging plastic. For the purpose of creating spectral libraries, 5 µL of each generated MP type was deposited on a soda-lime-silica glass slide. Spectral libraries were established according to the method described above.
2.4. Extraction of MP from air sampling filters
Clean filters (Teflon and silver membrane filters) or filters deposited with diluted PS beads of different sizes and air dried as well as filters containing air samples, were used for extraction experiments. Methanol (Omnisolve, 99.9%, Sigma Aldrich, Oakville, Ontario) was used as a solvent to extract particles from the filters. To avoid MP contamination with plastics arising from experimental procedures, the use of labware made of plastic materials was minimized and instead, cotton lab coats, glass tubes and Hamilton syringes were used. A laminar flow hood was used during sample preparation, adequate procedural blanks (blank PM2.5 samples) were analyzed to confirm that MP detected in environmental samples are not introduced during sample collection or analysis procedures.
One-eighth of a filter was cut and submerged in 1 mL of methanol in a 10 mL conical bottom borosilicate glass tube and sonicated for 5, 8 or 10 min in a Bransonic digital ultrasonic water bath at 40 kHz at room temperature. Since MP can be contaminated with biological and organic matter in environmental samples, removal of this contamination is crucial as such particulates can impede MP identification. Three Teflon filters containing air samples were treated with 30% Hydrogen peroxide (H2O2) (Sigma Aldrich, Mississauga, ON) for 48 h prior to extraction to see if it facilitates characterization of MP contaminated with other organic materials (e.g. dyes).
The filter was removed from the glass tube after sonication and methanol from the extracted sample was evaporated with a gentle stream of nitrogen gas blown on the surface of the solvent at room temperature from a N2 gas cylinder using a PVC tubing and gas flow regulator. The extracted material potentially consisting of reference MP, particles and fibers was resuspended in 40 µL of MilliQ water (Invitrogen, Life Technology, Burlington, Ontario, Canada). The samples were sonicated for an additional 2 min in a water bath sonicator at 40 kHz at room temperature before depositing on CaF2 slides for the analysis.
2.4.1. Analysis of extracted samples by Raman spectroscopy
Raman spectra of the extracted materials deposited on CaF2 slides as stated above were collected at 532 nm laser excitation with 1 or 10 mW laser intensity, depending on the size of the particles. The extracted samples were resuspended in 40 µl of water. This ensured enough volume for efficient dispersion of the extracted material. From this 5 µl was used for deposition on the slides for the analysis. Thus, one-eighth of the material (5 µL) extracted from 1/8th of the filter was analyzed.
A Raman shifts spectral range from 500 to 3400 cm−1 was used for the analysis. The spectra were collected in a dark environment to minimize noise arising from the room light. Acquisition time and a number of accumulations were set to 2 s and 4 s, respectively. The acquisition time and the number of accumulations were increased to up to 10 s and 6 s, respectively for particles with diameters less than 500 nm to obtain spectra with functional groups of heightened signal to noise ratios. The grating was set at 1200 lines mm−1 blazed for 700 nm. A slit size of 100 µm obtained the best resolution with the above settings. The FLAT correction was applied in order to remove background interference due to fluorescence. The spectra were identified by comparing them to a large number of fully verified spectra using the KnowItAll software. In the presence of high background in real samples, operators’ judgments were used during identification.
Particles mapped as MP using BioRad's KnowItAll software with HQI values of 0.70–0.98 were reported in this study. An HQI value of 0.70 or greater has been accepted as true math in previous studies (Lusher et al. Citation2015; Magni et al. Citation2019). The HQI value for homogeneous and unweathered samples will always be high. However, MP and NP in environmental samples are expected to undergo weathering and/or may be complexed with other contaminants, which may result in lower HQI. A threshold value of 95% and a correlation algorithm were applied for positive MP classification. Besides FLAT correction, baseline correction was applied prior to mapping. Spectral smoothing and normalization were avoided. Only cosmic rays were removed for noise correction in the pre-processing step. Polymer and monomer (Basic 1 and 2, Bio Stadtler) and Polymer and processing chemicals classifications were used in BioRad's KnowItAll software.
Manually identifying MP in each sample is a time-consuming task (hours). To increase the speed and efficiency of the analysis, the ‘Particle Finder’ plug-in available with the LabSpec 6 software was used. The field of view in Raman’s video mode was exported to the ‘Particle Finder’ plug-in. The particles of interest were marked using a threshold method and the Raman spectra of the marked locations were acquired (Oßmann et al. Citation2017). The likelihood of false positive is much less for substrates with a flat background such as Raman grade calcium fluoride slide and uniform particle sizes.
2.5. Detection of MP and NP in human adenocarcinoma lung epithelial (A549) cells
2.5.1. Cell culture
A549 cells were obtained from American Type Culture Collection (ATCC, Manassas, VA, USA). A549 cells were selected as this cell type is widely used to assess the inhalation toxicity of substances and inhaled micro/nano particulates (Goodman et al. Citation2021). Cells were cultured in F-12K Medium (Kaighn's modification of Ham's F-12 medium containing 2 mM L-glutamine and 1500 mg/l sodium bicarbonate, ATCC, Cedarlane, Ontario, Canada) supplemented with 10% fetal bovine serum (FBS) and 45 IU/mL penicillin, and 45 IU/mL streptomycin at 37 °C and 5% CO2 humidified environment. FBS and penicillin, and streptomycin were purchased from Invitrogen Life Technologies, Canada.
Cells (200 000) were seeded on coverslips in each well of a 6-well plate (VWR, Canada) and cultured overnight as described above. Cells were exposed to 50 μg/mL of individual 60 nm, 100 nm, 300 nm, 1 μm PS or mixture of the four PS types, for 24 h. To detect MP from environmental samples, cells were cultured and seeded in the same way as described above and were exposed to an aliquot of 10 µL of air filter extracted sample (extracted from 2 filters) for 24 h. Post-exposure, the supernatant was removed, cells were rinsed with 1X phosphate buffer saline (PBS, Invitrogen Life Technologies, Canada) and fixed with 4% paraformaldehyde (Thermo Fisher Scientific Inc., Wilmington, DE, USA).
2.5.2. Hyperspectral microscopy for detecting MP in cells
Coverslips with fixed cells were mounted on glass slides (VWR, Canada) for analyzing with the EDF-HSI system. MPs were located in cells by comparing the spectral signatures obtained from the particle exposed A549 cells to the spectral signatures of the known MP in the reference libraries using the Spectral Angle Mapping, a spectral classification algorithm in Environment for Visualization (ENVI 4.8, CytoViva, Inc. Auburn, AL, USA) software. A spectral angle of ≤0.1 radians between a spectrum in the reference spectral library and sample spectrum is considered a match of a particle to the known MP as mentioned earlier.
2.5.3. Cell viability assay
Cell viability after exposure to reference standard PS was determined by using a Trypan blue exclusion assay. Cells (200 000) were seeded in each well of a 6-well plate (VWR, Canada) and cultured overnight as described above. Cells were exposed to media, 25 μg/mL or 50 μg/mL of individual 60 nm, 100 nm, 300 nm, 1 μm PS for 24 h. After exposure, the supernatant was removed, cells were rinsed with 1X PBS and phase-contrast images were acquired. Cells were then trypsinized and suspended in fresh media without FBS. The Trypan blue exclusion assay was conducted as described before (Decan et al. Citation2016). In brief, 10 µL of the cell suspension was added to 10 µL of Trypan blue and incubated for 5 min at RT after mixing. By using a hemocytometer, the numbers of living (white) and dead (blue) cells were counted. Cell viability was presented as the percentage of total live cells in a total number of cells. Three biological replicates were used.
3. Results
3.1. Raman analysis of air sampling filters, substrates, and extracted MP
Soda-lime silica glass slides are routinely used for microscopy imaging, and are compatible with EDF-HSI; however, they are not recommended for Raman analysis (Mikoliunaite et al. Citation2015). Thus, as a first task, we evaluated a conventional soda-lime-silica glass slide and a CaF2 slide (recommended for Raman (Grimbergen et al. Citation2009; Kerr, Byrne, and Hennelly Citation2015; Stone et al. Citation2007) but not necessary for analysis with EDF-HSI) for potential spectral interference with Raman analysis, particularly in the MP spectral zone. The brightfield images of both soda-lime-silica glass (top) and CaF2 slides (bottom) are presented in Supplementary Figure 1A (left panel). Both have smooth flat surfaces, spectra of which are presented in Supplementary Figure 1A (right panel). The blank soda-lime-silica glass slide yielded strong Raman peaks at 579 cm−1 and 1100–1350 cm−1, which poses interference concerns for MP analysis. The CaF2 slide showed a sharp band at 319 cm−1 (Supplementary Figure 1A bottom right panel), but no background signal in the region of interest for MP analysis (500–3400 cm−1) (Supplementary Figure 1A bottom right panel insert). Thus, only CaF2 slides were used for the rest of the Raman analysis.
The results from the characterization of reference MP are summarized in Supplementary Table 1. Known spectral characteristics of the standard MP from the published literature (Käppler et al. Citation2016; Asensio et al. Citation2009; Noda et al. Citation2007; Jung et al. Citation2018; Calleja et al. 2011; Menchaca et al. Citation2003) presented in Supplementary Table 1 have been used to validate the characterization of reference MP and used to detect MP in the present study. The spectral regions between 400 and 2000 cm−1 are usually used to characterize MP in aquatic environments (Lv et al. Citation2020; Shan et al. Citation2020; Frére et al. Citation2016). However, in this study, we found the C-H stretching region was most pertinent for MP classification, as the fingerprint regions (800–1800 cm−1) of the collected Raman spectra were impacted by Carbon Black present in airborne particulates.
Since the spectra of MP obtained at 785 nm were weak and of low resolution even with 10 accumulations, 25 mW laser intensity (Supplementary Figure 2) the spectra of all samples were acquired at 532 nm. As ambient light produced a sharp band at 2400 cm−1 (Supplementary Figure 3), Raman analyses were conducted in the absence of ambient light.
Ideally, the air sample filter (on which air sample is collected) should be directly mounted on the slides for visualization under the microscope to maintain the sample integrity and keep sample manipulation to a minimum. In this study, we tested silver membrane and Teflon filters, both of which are commercially available and have been used in MP research. Supplementary Figure 1B (left panel) shows the brightfield images and Supplementary Figure 1B (right panel) shows the spectra of blank silver membrane and Teflon filters. The silver membrane filter showed a band at ∼235 cm−1 (Supplementary Figure 1B top right panel) but no other significant peaks in the region of 250 cm−1 to 3250 cm−1 (the region in which MP signature is expected). The Teflon filter showed bands in the backbone fingerprint region (a strong band at ∼733 cm−1 and small bands at 1200–1350 cm−1) but no bands in the fingerprint C-H stretching region 2900–3300 cm−1 ( bottom right panel).
Figure 1. Optimization of Raman parameters for plastic detection in ambient and indoor air samples. (A) brightfield images of silver membrane filters and Teflon filters deposited with 1 um, 300 nm and 100 nm PS at 50x magnification; (B) Raman spectra of PS deposited on silver membrane filter; (C) Raman spectra of PS deposited on Teflon filter; (D) Raman spectra of PS on CaF2 slide. The bands at ∼990 (1), ∼1200 (2), ∼1600 (3), ∼2900 (4), and ∼3050 (5) cm−1 were used to identify PS. The spectral signal from the silver itself is not shown in this figure. Raman spectra were acquired at 532 nm laser excitation wavelength using 10mW laser intensity, 1200 line mm−1 grating, 100 µm slit and 300 µm hole. CaF2: Calcium fluoride.
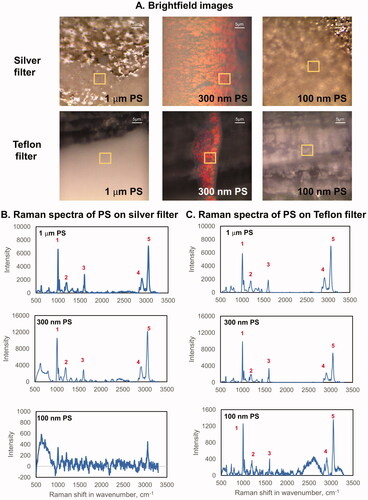
Next, reference PS beads of different sizes were deposited onto the filters and analyzed using Raman spectroscopy at various laser intensities and gratings. Brightfield images of the silver membrane filter, Teflon filter and CaF2 slide deposited with 1 µm, 300 nm and 100 nm PS were acquired within 2 h of deposition (). The areas marked with yellow boxes in represent the areas from where Raman spectra were collected. For 1 µm and 300 nm PS deposited on a silver membrane or on Teflon filters, each of the Raman spectra presented () shows two high-frequency bands, one at 2900 cm−1 due to the aliphatic C-H stretching and one at 3100 cm−1 due to the aromatic C-H stretching, using a 50x objective and 600 line mm−1 grating at 10 mW laser intensity. A strong band is also observed at ∼990 cm−1, which is due to the aromatic ring. The region from 200 to 1000 cm−1 and 2900 to 3150 cm −1 corresponded to the fingerprint regions of PS. Raman signals for 100 nm PS deposited on silver membrane filter or on Teflon filter were very noisy (). However, the band for an aromatic ring at ∼990 cm−1, bands at 2900 cm−1 due to the aliphatic C-H stretching and at 3100 cm−1 due to the aromatic C-H stretching could be distinguished. Raman characterization of single PS particles deposited on silver membrane filter or on Teflon filter was not attainable.
Figure 2. Optimization of Raman parameters for plastic detection in ambient and indoor air samples. (A) Brightfield images of CaF2 slide deposited with 1 µm, 300 nm and 100 nm polystyrene (PS) at 50x magnification and at 100x magnification; (B) Raman spectra of PS deposited on CaF2 slide. The bands at ∼990 (1), ∼1200 (2), ∼1600 (3), ∼2900 (4), and ∼3050 (5) cm−1 were used to identify PS. Raman spectra were acquired at 532 nm laser excitation wavelength using 10mW laser intensity, 600 (inset) or 1200 (the main graph) line mm−1 grating, 100 µm slit and 300 µm hole. CaF2: Calcium fluoride.
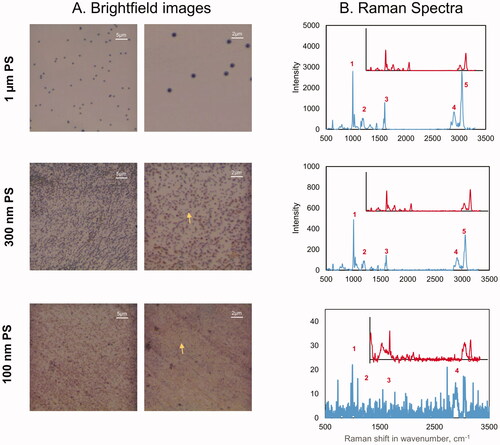
The PS particles of different sizes deposited directly on the CaF2 slide were also analyzed. Brightfield images of 1 µm, 300 nm and 100 nm PS deposited on CaF2 slide at 50x and 100x magnification are presented in . Similar spectral profiles were obtained for single 1 µm and 300 nm PS particles deposited on CaF2 slides () using 600 and 1200 line mm−1 grating at 10 mW. Spectra were successfully identified as PS using the KnowItAll software. Particles could be mapped to PS with ‘KnowItAll’ with higher accuracy (HQI > 0.95) when 1200 line mm−1 grating was applied. However, for 100 nm PS 1200 line mm−1 grating could not be applied for Raman characterization. Although, higher spectral resolution can be achieved with larger grating, for particles with weaker Raman features, the Raman feature of the particles cannot be distinguished from the artifacts of the background. The bands at ∼990, ∼1200, ∼1600, ∼2900 and ∼3050 cm−1 were used to characterize PS. Detection of individual 60 nm PS was not achievable.
Even though PS particles of all sizes could be identified by directly analyzing the silver membrane or Teflon filters, it was difficult to distinguish the single PS particles. The spectra obtained for 100 nm PS from both filters were much noisier than those obtained for 1 µm and 300 nm PS () due to the sensitivity limitations of the instrument. The mottled appearance of the filters at high magnification hindered effective visualization. In addition, the whiteness of the Teflon filter made it difficult to visualize the deposited MP which was also white. Silver membrane filters were found more suitable to Teflon for direct mounting and enabled analysis of large single or aggregated MP of 5 µm or larger, deposited on the filter. However, direct mounting of filters posed issues for the analysis of any MP smaller than 5 µm, which were the focus of this study. Thus, it was deemed difficult to characterize MP while they remained deposited on the filters (Wright, Levermore, and Kelly Citation2019) and it was decided to extract materials from filters for further analysis by Raman.
3.2. Extracting PS from the Teflon and silver membrane filters
A mixture of PS beads was externally deposited onto Teflon filters and then extracted from the filters in order to develop a methodology for isolation and characterization of airborne MP collected on filters. Different types of sonicators and solvents were tested for optimum extraction. Sonication powers, duration of sonication as well as temperatures were optimized for best results. Sonication using a probe sonicator for any duration damaged the filters and contaminated the samples with filter debris (data not shown). Water bath sonication for 10 min did not cause any sample degradation in water or in methanol. Although both water and methanol were effective in extracting the samples from filters, methanol solvent extraction was preferred because of the easy removal of methanol. Sonication for more than 10 min caused degradation of the filters and contamination of the extracted samples with filter debris. Therefore, samples extracted for more than 10 min were not analyzed by Raman. Supplementary 4A shows the brightfield images of methanol extracted PS mixture containing different sizes of MP on CaF2 slide, reflecting the mixture of sizes that were deposited on Teflon filter. Raman spectra of PS beads extracted by sonicating the Teflon filters in water or methanol for 5, and 10 min and silver membrane filters in methanol for 10 min were acquired with laser excitation at 532 nm and 10mW laser intensity. Sonication of filters in water (Supplementary Figure 4B) or methanol (data not shown) for 5 min resulted in insufficient material and weak and noisy Raman spectra. An adequate sample was extracted by sonicating filters for 10 min both in water (Supplementary Figure 4C) or methanol (Supplementary Figure 4D–E) and spectra were readily identified as PS with high accuracy (greater than 90%) with KnowItAll software. Both micron (1 µm) size and nano-size (300 nm) PS particles could be accurately identified by the Raman technique (Supplementary Figure 4C–D). Treatment with 30% H2O2 was found to damage MP (data not shown). Although such treatment may not have a significantly detectable effect on the size of larger MP, a small loss of surface material could significantly affect the size of the sub-micron particle (Hurley et al. Citation2018). Thus, the rest of the samples were not treated with H2O2.”
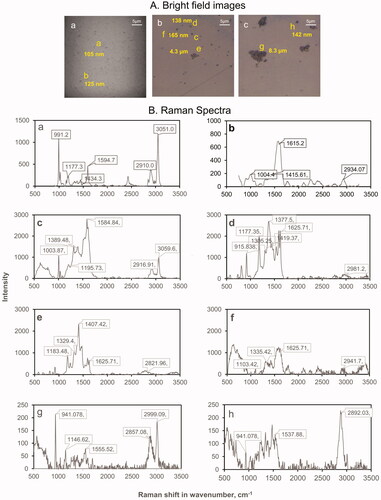
The suitability of silver membrane filters for MP extraction was also tested. In order to assess if silver from the membrane is interacting with particles resulting in modified Raman signatures, silver membrane filters were spiked with reference 300 nm PS particles. Spiked material was extracted from the filters at 2 h and 2 days post-exposure. Brightfield images of areas of PS particles extracted were assessed () and Raman analysis () was conducted. The Raman spectra of some particles extracted at 2 h post-deposition showed typical signatures known for PS () and for other particles, the band representing the aromatic C-H stretch at ∼3050 cm−1, typical of PS was no longer observed (). In the latter, the band arising from the C-C bending was significantly enhanced at ∼1615 cm−1. Changes in the Raman spectra reflecting potential interaction of particles with silver on the membrane were more pronounced for the PS particles extracted 2 days post-deposition (). The intensities of the bands in the 1200–1625 cm−1 region were markedly enhanced potentially due to interaction between the CH2 chains of the PS particles and silver in the filters. We next spiked the silver membranes with LDPE particles (unknown size), extracted the particles on day 2 after deposition and conducted the analysis. Similar to what was observed for PS particles, the Raman spectra of some extracted LDPE particles showed typical signatures () and some showed enhanced band activities in the 1200–1625 cm−1 region ().
Figure 3. Optimization of conditions for plastic particle extraction. (A) Brightfield images of reference MP extracted from silver membrane filter within (a) 300 nm PS within 2 h post-deposition, (b) 300 nm PS within 2 days post-deposition; (c) LDPE within 2 days post-deposition (B) The Raman spectra of reference MP extracted from silver membrane filter within (a-b) 300 nm PS within 2 h post-deposition, (c-f) 300 nm PS within 2 days post-deposition; (g-h) LDPE within 2 days post-deposition. The Raman spectra of PS particles extracted within 2 h post-deposition and 2 days post-deposition show modifications in spectral signatures potentially due to interaction between PS and silver in the filters. The Raman spectra of LDPE particles extracted within 2 days post-deposition also show some modifications in spectral signatures. Raman spectra were acquired at 532 nm laser excitation wavelength using 10 mW laser intensity, 1200 line mm−1 grating, 100 µm slit and 300 µm hole.
It has been shown by Lovera et al. that PS may form nano arrays when in contact with silver or gold (Lovera et al. Citation2014). It was observed that Raman spectral signatures of the nano arrays varied depending on the structures of nano arrays formed between the MPs and silver particles from the membrane. The structures of nano arrays are governed by the ratio of molar volumes of the MPs and silver particles and the duration of interactions (Lv et al. Citation2020). Thus, the mottled appearance of silver membrane filters interferes with the direct visualization of particles deposited on the membrane and nanoarrays formed during the process of extraction interfere with Raman spectral mapping. Because of these challenges, more studies are required to confirm the suitability of silver membrane filters for collecting air samples for the purposes of MPs detection. However, MP collection on silver membrane filters for use in toxicological studies should be avoided due to the well-known toxicity of silver ions in cells and bacteria. Thus, for the rest of the study, air samples collected on Teflon filters were analyzed, which did not alter MP’s chemical signatures during the process of extraction.
3.2.1. EDF-HSI detection of reference MP in cells post-exposure
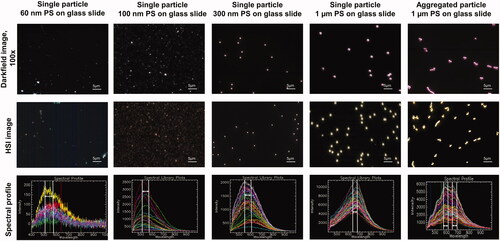
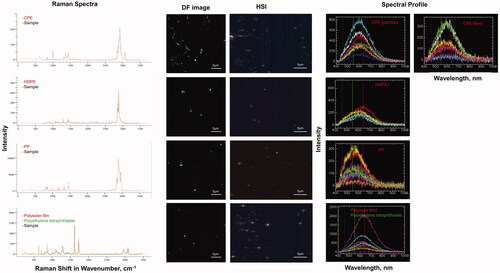
Spectral libraries for 60 nm, 100 nm, 300 nm and 1 µm PS particles were created using the PS standards. Darkfield images (100x magnification) with corresponding HSI and spectral profiles for different sizes of PS particles are represented in . The peaks shifted to the red region as particle size increased. Broad skewed peaks were obtained at 515–575 nm, 525–550 nm, 560–610 nm and 665–675 nm for 60 nm, 100 nm, 300 nm and 1 µm PS particles, respectively (). Aggregated 1 µm PS particles showed a bimodal broad peak with the first peak at 600 nm and the second peak at 675 nm. EDF-HSI spectral signatures changed due to the aggregation of particles. Unique spectral profiles were observed for each particle size including the aggregated PS particles. Thus, the EDF-HSI was found to be efficient in discriminating size and aggregation specific characteristics of reference MP. This technique is also useful in distinguishing MPs of different chemical compositions. The spectral signature for the 300 nm ETFE could be differentiated from the 300 nm PS. The peak for the 300 nm ETFE was less skewed than those for the 300 nm PS and was observed at 575–605 nm (Supplementary Figure 5).
Figure 4. Detection and hyperspectral analysis of PS using a CytoViva hyperspectral microscope. HSI (hyperspectral image).
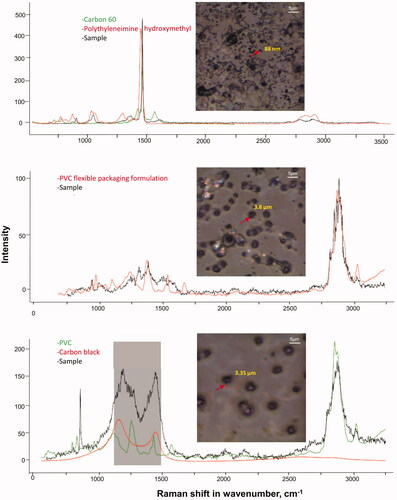
Unique spectral profiles were observed for MP generated from UV-irradiated commonly found plastic items in the environment – polyethylene bag, flexible food packaging plastic, synthetic rope and hard clear food packaging plastic. These MP were identified by Raman analysis as – chlorinated polyethylene (CPE) and polyethylene (PE), PP and Polyester film/Polyethylene tetraphthalate respectively ().
Figure 5. Detection and hyperspectral analysis of MP generated from UV-irradiated commonly found plastic items in the environment using a CytoViva hyperspectral microscope. The items were polyethylene bag, flexible food packaging plastic, synthetic rope and hard clear food packaging plastic which were identified by Raman analysis as – CPE, PE, PP and Polyester film/Polyethylene tetraphthalate respectively. HSI (hyperspectral image).
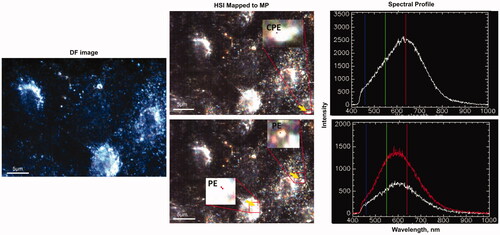
Control and MP exposed A549 cells were visualized using EDF-HSI to detect MP uptake. As shown in , micro and nano-sized PS were detected in cells 24 h post-exposures. The HSI obtained from the field of view of the darkfield images were mapped to 60 nm, 100 nm, 300 nm and 1 µm PS. In cells exposed to individual MPs, a large number of MPs were detected and mapped. However, in cells exposed to the mixture of all four reference MPs, spectral hits were found only for 300 nm and 1 μm PS. This could be because of the colloidal instability of nano PS in the presence of larger particles in cells. In cells exposed to air extracts, the HSI obtained from the field of view of the darkfield images were mapped to all available spectral libraries. This included the spectral libraries of the reference PS particles and spectral libraries of MP derived from UV-irradiated plastic items. None of the spectra derived from reference MP matched the spectra of particles in cells exposed to air samples. However, spectra derived from two of the MP types generated from UV-irradiated plastic items, i.e. – CPE and PE successfully matched the spectra of a few particles in cells exposed to air samples (), suggesting that the reference MP types routinely used in toxicology studies do not represent what is present in the air. The results also suggested that in the absence of representative MP types, the methodology used in the present study to collect spectral libraries of random plastic materials might be the way forward to track unknown MP in the air using EDF-HSI. Further optimization of the extraction techniques is required to isolate enough quantity of MP from such samples to build specific spectral libraries for the MP in the environmental samples. Moreover, it is important to note that spectral signatures of environmental MP may be influenced by the significant weathering of plastics. Thus, the building of a large collection of spectral libraries of pristine MP and their modified forms representative of real-world exposures will be required for the successful application of EDF-HSI in toxicological studies. Exposure to reference MP to 25 or 50 μg/mL of reference MP types did not result in appreciable loss of viability (Supplementary Figure 6).
Figure 6. EDF-HSI analysis of A549 cells exposed to individual or mixture of reference MPs. (A) darkfield images of A549 cells exposed for 24 h to media only, 50 µg/mL of individual PS types or 50 µg/mL of a mixture of all PS, (B) the corresponding mapped HSI images and (C) representative spectra of the mapped PS. Arrows show mapped PS.
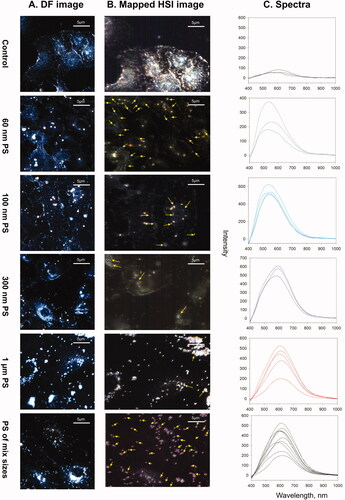
Figure 7. EDF-HSI analysis of A549 cells exposed to environmental air samples. Left panel – darkfield images of A549 cells exposed for 24 h to MP extracted from environmental air samples; middle panel – corresponding mapped HSI images and right panel – representative spectra of the mapped MP. Arrows show mapped MP. CPE – Chlorinated polyethylene; PE – polyethylene.
3.3. Detection and characterization of MP from air samples
Personal, outdoor and indoor air samples collected on Teflon filters were extracted and prepared for MP detection by Raman as described above. A large variety of MP polymers <2.5 μm, including MP <1 μm were observed in one personal air sample and several ambient outdoor samples. These polymers include, Nylon fibers, particles of PP, PE, CPE, styrene copolymer, polyvinyl chloride (PVC) packaging formulation, and polyurethane (PUR) contaminated with Flex blue (especially rubber containing blue dye). Nylon was present in almost all samples (, Supplementary Figure 7). The presence of carbonaceous materials was low in these samples, which facilitated the easy identification of plastic polymers.
Figure 8. Plastic particles extracted from air samples collected on Teflon filters. Filters were extracted in methanol by 10 min sonication at 40 kHz. Brightfield images of filter extracted material from Teflon filters from the Montreal Asthma Study (50x magnification) and Raman spectra of the extracted particles on a CaF2 slide identified with ‘KnowItAll’. Arrows show the particles for which corresponding Raman spectra are presented. In the topmost brightfield image, arrows highlight multiple nylon fibers highlighted. Raman spectra were acquired at 532 nm laser excitation wavelength using 10 mW laser intensity, 1200 line mm−1 grating, 100 µm slit and 300 µm hole.
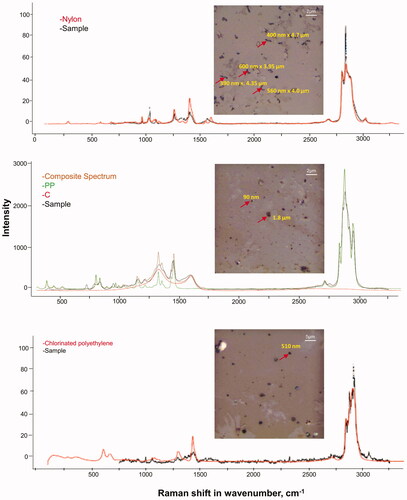
In the MCHF ambient air samples collected on 47 mm Teflon filters, the identified plastic polymers were mostly associated with packaging materials. Relatively, these samples contained higher amounts of Carbon Black (, Supplementary Figure 7) than the MAS samples, likely from sources unrelated to the MP. As the presence of Carbon Black was not very high, masking of the characteristic regions (peaks) of Carbon Black (1050–1500 cm−1) allowed for the detection of plastic polymers. The abundance of Carbon Black was much higher in the samples collected on the 37 mm filters compared to the samples collected on 47 mm filters for the MCHF study and hence it was very difficult to distinguish MP from other particles present on the 37 mm filters (). The MP compositions discovered in personal, indoor and outdoor air samples and their number in individual samples analyzed are listed in . No MP was detected in blank PM2.5 samples (Supplementary Figure 8).
Figure 9. Plastic particles extracted from air samples collected on Teflon filters. Filters were extracted in methanol by 10 min sonication at 40 kHz. Brightfield images of filter extracted material from Teflon filters from the Montreal Congestive Heart Failure study (50x magnification) and Raman spectra of the extracted particles on a CaF2 slide mapped with ‘KnowItAll’. Arrows show the particles for which corresponding Raman spectra are presented. The shaded areas in the Raman spectra (bottom most) show the spectral region of Carbon Black masked to enable detection of PVC particles in this sample. Raman spectra were acquired at 532 nm laser excitation wavelength using 10 mW laser intensity, 1200 line mm−1 grating, 100 µm slit and 300 µm hole.
3.4. Automating the detection of MP using particle finder
The plug-in ‘Particle Finder’ within the Labspec6 was utilized to increase the speed of particle analysis. A small fraction of air samples (5%) were analyzed using the automated method in order to evaluate its feasibility for rapid screening of samples. The results obtained from these analyses showed a high degree of accuracy in identifying MP from a field of view if (a) it was not crowded or consisted of less than 20 particles (Supplementary Figure 9) and (b) particles were of uniform size. The Raman spectra represented in Supplementary Figure 4 show mapping to Carbon Black and polyethylene glycol (PEG). The diameters of the particles ranged from 0.2 to 3 µm. In the case where the field of view was dense and consisted of a wide range of particle distribution, a significant number of spectra showed low resolution and were not useful for identification purposes. The time required to analyze a field of view with 20 particles was 15 to 30 min. Identification of these particles manually would take ∼1.5 h. The MP identification success rates in spiked samples were 99%. However, the success rate was much lower (30%) for environmental samples as these were crowded with chemical and other contaminants.
Particle Finder is applicable to detecting both single and aggregated states of materials. As the Raman intensity is dependent on the particle size, the “Multivariate” software can be used to distinguish between the single and aggregated state of the material after building a reference library. Though the current technology did not allow us to identify all the particles, the fact that we were able to detect a significant number of MP ≤2.5 µm, demonstrates that appreciable levels of MP are present in the air.
3.5. Hyperspectral imaging for MP in air samples
The caveat of EDF-HSI is that it requires a priori knowledge of the MP being investigated. However, because of its sensitivity and the principles on which it is based, it can be used to detect known MP regardless of their abundance in any complex matrices. In the current study, 1 µm, 300 nm and 100 nm PS particles from a mixture of PS particles of different sizes, were identified. Supplementary Figure 10 (top left panel) shows the darkfield images of the PS mixture. The HSI and mapped HSI images of 1 µm, 300 nm and 100 nm PS particles in the mixture are shown in Supplementary Figure 10, top right panel. The bottom panel shows the spectral profile of the mapped PS particles.
The amount of MP in extracted air samples was too low and complexed with other contaminants, because of which spectra libraries for the individual MP types could not be established. However, the spectral libraries built for the reference PS particles and MP generated from commonly used plastic materials in our daily life were used to detect MP in cells after exposure to MP from the environmental samples. Two out of four spectral libraries built successfully matched the spectra of a few particles in cells exposed to air samples (). These results suggest that the reference MP types routinely used in toxicology studies do not represent the MP present in the air. Hence, an inventory of spectral libraries for the MP types found in the air samples is required and further optimization of extraction procedures is a must to acquire high quality and quantity of MP for toxicological testing.
4. Discussion
MP is ubiquitous in the environment. The form or shape (particles, fiber) of MP, their size (macro, nano), chemical composition and the surface content (adsorbed chemicals & microbes) contribute to their toxicity (Toussaint et al. Citation2019). Thus, the knowledge of the Physico-chemical properties of airborne, respirable MP is critical. This paper outlines a method for the collection and analysis of air samples for the presence of MP in particles ˂2.5 µm, laying the basis for future toxicological studies.
This study applied the confocal Raman spectroscope integrated EDF-HSI imaging system for the identification and characterization of MP from complex air samples. Theoretically, it would not be possible to get a Raman signature of a single MP particle with a diameter smaller than 1 µm using the current setup. According to Abbe’s Law, the resolution of a laser spot is dependent on the wavelength of incident light λ and the numerical aperture NA of the objective used as limited by the diffraction effect (Abbe Citation1873). The spot size of a focused laser beam is commonly expressed by the Rayleigh Criterion based on Abbe’s Law of limiting diffraction presented below (Weisenburger and Sandoghdar Citation2015).
(1)
(1)
According to Rayleigh Criterion, using a 100x objective in the air (NA= 0.90) at 532 nm laser excitation the smallest diameter of a laser spot would be 791 nm and using a 50x objective in the air (NA= 0.55) at 532 nm the smallest diameter of a laser spot would be 1180 nm. Therefore, Raman signatures of MP below 1 μm, refer to concentrated MP aggregates and not to singular MPs deposited onto Teflon and Silver membrane filters.
However, it was possible to obtain a clear Raman signature of an MP with a diameter smaller than 1 µm (spatial lateral resolution or ∼360 nm) on CaF2 slide at 532 nm even though the diameter of the laser spot was larger by aligning the center of nano plastic (NP) and the center of the laser spot. It is known that the strongest signal from NP is obtained when NP is centered in the laser spot (Holle et al. Citation2006). The fact that the background signal from the slide did not interfere with the Raman signal for MP also enabled confirmation of the presence of airborne MP. The morphology of particles smaller than 360 nm could not be determined from the Raman image. However, with darkfield illumination using a 100x oil objective (NA = 1.4) the spatial resolution can be increased up to 232 nm and much greater contrast can be achieved (Bodermann et al. Citation2003). Therefore, the morphology of PS particles could be visualized with higher clarity in the darkfield images than in the brightfield images. It was even possible to distinguish single 100 nm and 300 nm PS particles with darkfield illumination (). More recently, it was shown that it is possible to characterize MP as small as 100 nm using a 100x objective by Raman spectroscopy by reducing the pixel size to 100 × 100 (Fang et al. Citation2020; Sobhani et al. Citation2019; Sobhani et al. Citation2020). Though the 785 nm laser wavelength is preferred for Raman analysis of biological substances (Creely et al. Citation2005; Draux et al. Citation2009; Zoladek et al. Citation2011), a smaller wavelength is needed for Raman analysis of MP smaller than 1.1 µm according to the Abbes law.
The results showed that it was possible to detect the presence of multiple types of MP in outdoor, indoor and personal air samples, although the overabundance of Carbon Black impeded their detection in the outdoor air samples. The results of the outdoor air sample analysis suggested that further processing may be required to separate Carbon Black and other contaminants from MP in air samples. Many different types of MP compositions were discovered () in the MAS samples and consisted mainly of nylon fibers, and particles of PP, PE, CPE, styrene copolymer, PVC packaging formulation, and PUR. Poly(2-vinylpyridine)/poly(styrene) and poly(vinyl butyrate) particles were also detected in a sample. These MP were not included in as their HQI values (HQI: 0.6) were below the cut-off value of 0.7, nevertheless, it is important to mention their presence. Nylon was present in almost all samples investigated being 72% of total MP identified. In the outdoor MCHF air samples collected on a 37 mm Teflon filter, the MP detected was found to be mostly associated with packaging materials. These samples contained significant levels of Carbon Black potentially from outdoor traffic and combustion-related sources or associated with MP as it is used as a dye or reinforcing material in plastics. However, levels of Carbon Black concentrations were low enough to allow detection of MP in these samples. The other outdoor and indoor samples collected on 47 mm Teflon filter were highly dominated by the presence of Carbon Black, which totally masked the MP signature areas in Raman. Analysis of blank PM2.5 samples confirmed that the MP found in the air extracts did not originate during the sample storage or as a consequence of experimental procedures (Supplementary Figure 8). Identification validation experiments were performed for clean filters deposited with PS spheres but not for real air samples. However, it is important to note that the number of particles identified as MP in air samples with an HQI score over 0.9 was significant.
Table 1. List of identified MP in air samples.
Most MP found were nylon with ∼30% of them being fibers (), which is a cause for concern. The types of MP found, i.e. nylon varieties have been associated with human respiratory diseases, including granulomatous lesions in lungs of workers exposed occupationally to nylon, polyester and acrylic fiber dusts (Pimentel, Avila, and Lourenco Citation1975); and chronic lung diseases including a rare lung interstitial disease (Flock worker’s lung) is observed in nylon textile workers (Kern et al. Citation1998). However, general population exposures are expected to be much lower than those found around the occupational area. Thus, it is unknown if levels of exposure to MP present outside of occupational settings can initiate adverse health effects. Further toxicological testing targeting the polymers identified in this study may be needed to understand potential health hazards associated with low levels of MP exposure in the air.
Owing to the issues related to sample collection, e.g. insufficient amount of filter extracted material, high levels of background chemical constituents with competing spectral signatures and time onerous protocols, the study was not able to conduct a comprehensive analysis of all potential MP present in air matrices and thus, the list of MP identified is not complete. Also, the identified MP were not characterized for their surface organic/inorganic composition. Therefore, studies in the future should focus on: (1) optimization of sample extraction methods that will yield high levels of MP with minimum nuisance contaminants; (2) selective isolation of MP following filter extraction for MP surface characterization; (3) optimization of methods for automated detection of MP and (4) establishment of an inventory of MP potentially present in complex air samples and their property variants, which will allow effective training of automated algorithms to detect heterogeneous MP population from a complex chemical mixture. Although the automation of the Raman analysis using ‘particle finder’ is promising, the sample preparation methods should be further modified to enable uniform suspension of single particles for visualization.
The study used EDF-HSI to demonstrate its applicability to detect MP. However, the technique requires a priori knowledge of the MP in the samples. As the type of MP in air samples are diverse, and reference spectral libraries for plastic particles are not publicly available, this technique might not be suitable for the identification of new MP in air samples. However, in the absence of MP representing environmental exposure, most studies use reference MP for toxicological assessment. In the present study, the applicability of EDF-HSI to detect MP in cells post-exposure was evaluated. The results demonstrated that EDF/HSI can be effectively applied to track the presence of MP in cells post-exposure, for which spectral libraries are available. As stated previously, the commercially available reference MP does not represent what is present in the environment. Also, spectral libraries for the MP present in the air are not available, making it very difficult to apply EDF-HSI to real exposure scenarios. However, the present study results showed that the spectral libraries can be built using the commonly found plastic items in the environment. Of the four individual spectral libraries established for MP from a polyethylene bag, flexible food packaging plastic, synthetic rope and hard clear food packaging plastic, which were identified by Raman analysis as CPE, PE, PP and Polyester film/Polyethylene tetraphthalate (), CPE and PE were specifically mapped in air extract exposed cells. These results suggest that some MP in the air may be originating from the commonly used polyethylene bags and flexible food packaging plastic. Efforts are on the way to expand the spectral library inventory for various types of plastic materials that are in routine use and have the potential to enter the environment, using the methodology established in the present study.
Cells exposed to reference MP did not show any loss of viability (Supplementary Figure 6). Since it was not possible to quantify the MP extracted from air samples, it is premature to conclude on the potential or lack of toxicity of environmentally relevant MP. Categorical isolation of MP from air samples is required to understand their toxicity.
Raman is suitable for detecting and characterizing MP in personal, indoor and outdoor air samples, while here we suggest EDF-HSI is most suitable for detecting MP in biological matrices. Recently, Fournier et al. Citation2020 have used EDF-HSI to detect MP of 20 nm size fractions in biological matrices after pulmonary instillation and track their translocation in organisms (Fournier et al. Citation2020).
The study also highlighted various experimental artifacts that can be introduced during the study due to the high sensitivity of the Raman spectroscope and ubiquitous presence of MP in the environment. The choice of proper substrate proved to be very important. Soda-lime silica glass slides are inexpensive, easily available and hence, commonly used for analyzing samples by Raman spectroscopy. However, when analyzing MP, the signal arising from the soda-lime-silica glass at 850–1150 cm−1 masked the signals from MP, which typically appear at 500–3250 cm−1. The Teflon filters, when directly mounted for MP visualization, contributed interfering peaks in the spectral regions of 734 cm−1 and 1200–1400 cm−1. Though these interfering peaks become less dominating in the case of large MP ≥ 5 µm allowing characterization (Wright, Levermore, and Kelly Citation2019), they hinder the characterization of MP≤ 2.5 µm. The silver membrane filters were spectrally clean; however, their mottled appearance made it difficult to identify MP visually. Moreover, silver on the membrane interacted with MP and chemically transformed them during the extraction process, resulting in the loss of MP signature spectral signals. Thus, various aspects of sample collection, sample processing, detection and characterization methodologies must be thoroughly optimized before the results are used for making decisions. Some factors include placement of the instrument (Raman) on an anti-vibration table and in a clean, uncarpeted room with low lights; use of CaF2 slides; and avoidance of silver membrane filter used in air sample collection, must be emphasized. Specific to air or environmental samples, the current study found the region between 400 and 2000 cm−1 is overwhelmed with contaminants (Carbon Black) possible arising from tire wear and thus, the less crowded regions from 2700–3300 cm−1 are required to characterize MP.
5. Conclusions
This was the first study to confirm the presence of respirable, airborne MP in indoor, personal, and outdoor samples, and to subsequently characterize the composition of MP ˂2.5 µm. The results show that a variety of airborne MP is present in indoor and outdoor air, substantiating concerns of human exposure to respirable MP. Further research is needed to quantify and characterize exposures to respirable MP, supplemented by toxicological experiments to understand human health hazards. A brief description of recommended methods for the collection and analysis of MP in fine particulates is presented in Supplementary Table 2. MP was not detectable in many samples due to the high loading of Carbon Black. Thus, when collecting MP samples for characterization, it is useful to collect lower sample masses, to avoid abundant interference with other co-pollutants that can mask MP detection. MAS samples were collected on filters for 24 h whereas, the MCHF samples were collected for 7 days. Hence, the sample volume in the MAS group was comparatively lower than the sample volume in the MCHF group. MP was more easily detected in personal and ambient samples from the MAS study due to the lower sample volumes and corresponding lower mass of loading per filter.
Silver membrane filters have been previously identified as suitable for MP research (Wright et al. Citation2020). However, the results of the present study demonstrated that they may not be suitable for extracting MP from filters as silver on filters may react with MP and transform them, which precludes their use from collecting samples for toxicological studies as that requires extraction of MP from filters. Teflon filters were suitable for extraction procedures. Since Teflon filters are routinely used in air pollution research and regulatory monitoring, this optimized method will enable the ability for researchers to retrospectively investigate collected MP samples. Lastly, the results showed that EDF-HSI can be applied to detect reference MP and air sample extracted MP in cells post-exposure.
The results of the study also highlighted the possible sources of a discrepancy, artifacts and inconsistencies in results, and thus, provided preliminary recommendations for minimizing such issues. Finally, the study, by identifying the specific types of MP in air samples, lays the foundation for future MP toxicological studies.
Author contributions
Luna Rahman conducted the experiments, analyzed data and wrote the manuscript. Gary Mallach acquired funding, reviewed and edited the manuscript. Ryan Kulka collected air samples and reviewed the manuscript. Sabina Halappanavar acquired funding, planned/supervised the experimental work, and co-wrote the manuscript.
Supplemental Material
Download MS Word (5.8 MB)Acknowledgements
The project was supported by Health Canada’s Addressing Air Pollution Horizontal Initiative (AAPHI). Authors acknowledge Andrey Boyadzhiev for his help in setting up the Cytoviva/Raman instrument, optimisation of protocols and for conducting the manuscript review and also Phil Blagden for reviewing the manuscript.
Disclosure statement
There is no competing interest to declare by the authors.
References
- Abbasi, Sajjad, Behnam Keshavarzi, Farid Moore, Andrew Turner, Frank J. Kelly, Ana Oliete Dominguez, and Neemat Jaafarzadeh. 2019. “Distribution and Potential Health Impacts of Microplastics and Microrubbers in Air and Street Dusts from Asaluyeh County, Iran.” Environmental Pollution 244: 153–164. doi:https://doi.org/10.1016/j.envpol.2018.10.039.
- Abbe, E. 1873. “Beiträge Zur Theorie Des Mikroskops Und Der Mikroskopischen Wahrnehmung.” Archiv Für Mikroskopische Anatomie 9 (1): 413–468. doi:https://doi.org/10.1007/BF02956173.
- Allen, Steve, Deonie Allen, Vernon R. Phoenix, Gaël Le Roux, Pilar Durántez Jiménez, Anaëlle Simonneau, Stéphane Binet, and Didier Galop. 2019. “Atmospheric Transport and Deposition of Microplastics in a Remote Mountain Catchment.” Nature Geoscience 12 (5): 339–344. doi:https://doi.org/10.1038/s41561-019-0335-5.
- Amato-Lourenço, Luís Fernando, Regiani Carvalho-Oliveira, Gabriel Ribeiro Júnior, Luciana dos Santos Galvão, Rômulo Augusto Ando, and Thais Mauad. 2021. “Presence of Airborne Microplastics in Human Lung Tissue.” Journal of Hazardous Materials 416: 126124. doi:https://doi.org/10.1016/j.jhazmat.2021.126124.
- Araujo, Catarina F., Mariela M. Nolasco, Antonio M. P. Ribeiro, and Paulo J. A. Ribeiro-Claro. 2018. “Identification of Microplastics Using Raman Spectroscopy: Latest Developments and Future Prospects.” Water Research 142: 426–440. doi:https://doi.org/10.1016/j.watres.2018.05.060.
- Arulampalam, M. S., S. Maskell, N. Gordon, and T. Clapp. 2002. “A Tutorial on Particle Filters for Online Nonlinear/Non-Gaussian Bayesian Tracking.” IEEE Transactions on Signal Processing 50 (2): 174–188. doi:https://doi.org/10.1109/78.978374.
- Asensio, Ruth Chércoles, Margarita San Andrés Moya, José Manuel de la Roja, and Marisa Gómez. 2009. “Analytical Characterization of Polymers Used in Conservation and Restoration by ATR-FTIR Spectroscopy.” Analytical and Bioanalytical Chemistry 395 (7): 2081–2096. doi:https://doi.org/10.1007/s00216-009-3201-2.
- Ballent, Anika, Patricia L. Corcoran, Odile Madden, Paul A. Helm, and Fred J. Longstaffe. 2016. “Sources and Sinks of Microplastics in Canadian Lake Ontario Nearshore, Tributary and Beach Sediments.” Marine Pollution Bulletin 110 (1): 383–395. doi:https://doi.org/10.1016/j.marpolbul.2016.06.037.
- Bergmann, Melanie, Sophia Mützel, Sebastian Primpke, Mine B. Tekman, Jürg Trachsel, and Gunnar Gerdts. 8-1 2019. “White and Wonderful? Microplastics Prevail in Snow from the Alps to the Arctic.” Science Advances 5 (8)eaax1157. doi:https://doi.org/10.1126/sciadv.aax1157.
- Bodermann, Bernd, Winfried Michaelis, Alexander Diener, and Werner Mirande. 2003. New Methods for CD Measurements on Photomasks Using Dark Field Optical Microscopy International Society for Optics and Photonics.
- Boyadzhiev, Andrey, Colleen Trevithick-Sutton, Dongmei Wu, Nathalie Decan, Marc Bazin, Girish M. Shah, and Sabina Halappanavar. 5-18 2020. “Enhanced Dark-Field Hyperspectral Imaging and Spectral Angle Mapping for Nanomaterial Detection in Consumer Care Products and in Skin following Dermal Exposure.” Chemical Research in Toxicology 33 (5): 1266–1278. doi:https://doi.org/10.1021/acs.chemrestox.0c00090.
- Cai, Liqi, Jundong Wang, Jinping Peng, Zhi Tan, Zhiwei Zhan, Xiangling Tan, and Qiuqiang Chen. 2017. “Characteristic of Microplastics in the Atmospheric Fallout from Dongguan City, China: Preliminary Research and First Evidence.” Environmental Science and Pollution Research International 24 (32): 24928–24935. doi:https://doi.org/10.1007/s11356-017-0116-x.
- Calleja, Gérard, Axel Houdayer, Sylvie Etienne-Calas, David Bourgogne, Valérie Flaud, Gilles Silly, Sota Shibahara, et al. 4-1 2011. “Conversion of Poly(Ethylene-Alt-Tetrafluoroethylene) Copolymers into Polytetrafluoroethylene by Direct Fluorination: A Convenient Approach to Access New Properties at the ETFE Surface.” Journal of Polymer Science Part A: Polymer Chemistry 49 (7): 1517–1527. doi:https://doi.org/10.1002/pola.24588.
- Chen, Qiqing, Jiani Gao, Hairui Yu, Hang Su, Yan Yang, Yajuan Cao, Qun Zhang, et al. 2021. “An Emerging Role of Microplastics in the Etiology of Lung Ground Glass Nodules.” MedRxiv 2021.
- Creely, Caitriona M., Giovanni Volpe, Gajendra P. Singh, Marta Soler, and Dmitri V. Petrov. 2005. “Raman Imaging of Floating Cells.” Optics Express 13 (16): 6105–6110. doi:https://doi.org/10.1364/OPEX.13.006105.
- Decan, Nathalie, Dongmei Wu, Andrew Williams, Stéphane Bernatchez, Michael Johnston, Myriam Hill, and Sabina Halappanavar. 2016. “Characterization of in Vitro Genotoxic, Cytotoxic and Transcriptomic Responses following Exposures to Amorphous Silica of Different Sizes.” Mutation Research. Genetic Toxicology and Environmental Mutagenesis 796: 8–22. doi:https://doi.org/10.1016/j.mrgentox.2015.11.011.
- Draux, Florence, Pierre Jeannesson, Abdelilah Beljebbar, Ali Tfayli, Nicolas Fourre, Michel Manfait, Josep Sulé-Suso, and Ganesh D. Sockalingum. 2009. “Raman Spectral Imaging of Single Living Cancer Cells: A Preliminary Study.” The Analyst 134 (3): 542–548. doi:https://doi.org/10.1039/B812610K.
- Dris, Rachid, Johnny Gasperi, Cécile Mirande, Corinne Mandin, Mohamed Guerrouache, Valérie Langlois, and Bruno Tassin. 2017. “A First Overview of Textile Fibers, Including Microplastics, in Indoor and Outdoor Environments.” Environmental Pollution 221: 453–458. doi:https://doi.org/10.1016/j.envpol.2016.12.013.
- Dris, Rachid, Johnny Gasperi, Vincent Rocher, Mohamed Saad, Nicolas Renault, and Bruno Tassin. 2015. “Microplastic Contamination in an Urban Area: A Case Study in Greater Paris.” Environmental Chemistry 12 (5): 592–599. doi:https://doi.org/10.1071/EN14167.
- Duemichen, E., U. Braun, R. Senz, G. Fabian, and H. Sturm. 2014. “Assessment of a New Method for the Analysis of Decomposition Gases of Polymers by a Combining Thermogravimetric Solid-Phase Extraction and Thermal Desorption Gas Chromatography Mass Spectrometry.” Journal of Chromatography. A 1354: 117–128. doi:https://doi.org/10.1016/j.chroma.2014.05.057.
- Dümichen, Erik, Anne Kathrin Barthel, Ulrike Braun, Claus G. Bannick, Kathrin Brand, Martin Jekel, and Rainer Senz. 2015. “Analysis of Polyethylene Microplastics in Environmental Samples, Using a Thermal Decomposition Method.” Water Research 85: 451–457. doi:https://doi.org/10.1016/j.watres.2015.09.002.
- Dümichen, Erik, Paul Eisentraut, Claus Gerhard Bannick, Anne Kathrin Barthel, Rainer Senz, and Ulrike Braun. 2017. “Fast Identification of Microplastics in Complex Environmental Samples by a Thermal Degradation Method.” Chemosphere 174: 572–584. doi:https://doi.org/10.1016/j.chemosphere.2017.02.010.
- Eisentraut, Paul, Dümichen, Erik Aki Sebastian Ruhl, Martin Jekel, Mirko Albrecht, Michael Gehde, and Ulrike Braun. and 10-9. 2018. “Two Birds with One Stone-Fast and Simultaneous Analysis of Microplastics: Microparticles Derived from Thermoplastics and Tire Wear.” Environmental Science & Technology Letters 5 (10): 608–613. doi:https://doi.org/10.1021/acs.estlett.8b00446.
- Enders, Kristina, Robin Lenz, Colin A. Stedmon, and Torkel G. Nielsen. 2015. “Abundance, Size and Polymer Composition of Marine Microplastics ≥10µm in the Atlantic Ocean and Their Modelled Vertical Distribution.” Marine Pollution Bulletin 100 (1): 70–81. doi:https://doi.org/10.1016/j.marpolbul.2015.09.027.
- Fang, Cheng, Zahra Sobhani, Xian Zhang, Christopher T. Gibson, Youhong Tang, and Ravi Naidu. 2020. “Identification and Visualisation of Microplastics/Nanoplastics by Raman Imaging (Ii): Smaller than the Diffraction Limit of Laser?” Water Research 183: 116046. doi:https://doi.org/10.1016/j.watres.2020.116046.
- Fischer, Marten, and Scholz-Böttcher Barbara M. 2017. “Simultaneous Trace Identification and Quantification of Common Types of Microplastics in Environmental Samples by Pyrolysis-Gas Chromatography − Mass Spectrometry.” Environmental Science & Technology 51 (9): 5052–5060. doi:https://doi.org/10.1021/acs.est.6b06362.
- Fournier, Sara B., Jeanine N. D'Errico, Derek S. Adler, Stamatina Kollontzi, Michael J. Goedken, Laura Fabris, Edward J. Yurkow, and Phoebe A. Stapleton. 2020. “Nanopolystyrene Translocation and Fetal Deposition after Acute Lung Exposure during Late-Stage Pregnancy.” Particle and Fibre Toxicology 17 (1): 55. doi:https://doi.org/10.1186/s12989-020-00385-9.
- Frère, L, Paul-Pont I, Moreau J, Soudant P, Lambert C, Huvet A, and Rinnert E. 2016. “A Semi-Automated Raman Micro-Spectroscopy Method for Morphological and Chemical Characterizations of Microplastic Litter.” Marine Pollution Bulletin 113 (1-2): 461–468. doi:https://doi.org/10.1016/j.marpolbul.2016.10.051.
- Gallo, Frederic, Cristina Fossi, Roland Weber, David Santillo, Joao Sousa, Imogen Ingram, Angel Nadal, and Dolores Romano. 2018. “Marine Litter Plastics and Microplastics and Their Toxic Chemicals Components: The Need for Urgent Preventive Measures.” Environmental Sciences Europe 2018/04/30 (1): 13. doi:https://doi.org/10.1186/s12302-018-0139-z.
- Gewert, Berit, Merle M. Plassmann, and Matthew MacLeod. 2015. “Pathways for Degradation of Plastic Polymers Floating in the Marine Environment.” Environmental Science. Processes & Impacts 17 (9): 1513–1521. doi:https://doi.org/10.1039/C5EM00207A.
- Goodman, Kerestin E., Joan T. Hare, Zahraa I. Khamis, Timothy Hua, and Xiang Qing, and 4-19. Amy Sang. 2021. “Exposure of Human Lung Cells to Polystyrene Microplastics Significantly Retards Cell Proliferation and Triggers Morphological Changes.” Chemical Research in Toxicology 34 (4): 1069–1081. doi:https://doi.org/10.1021/acs.chemrestox.0c00486.
- Gregory, Murray R. 1996. “Plastic 'Scrubbers' in Hand Cleansers: A Further (and Minor) Source for Marine Pollution Identified.” Marine Pollution Bulletin 32 (12): 867–871. doi:https://doi.org/10.1016/S0025-326X(96)00047-1.
- Grimbergen, M. C. M., C. F. P. van Swol, R. J. A. van Moorselaar, J. Uff, A. Mahadevan-Jansen, and N. Stone. 2009. “Raman Spectroscopy of Bladder Tissue in the Presence of 5-Aminolevulinic Acid.” Journal of Photochemistry and Photobiology B: Biology 95 (3): 170–176. doi:https://doi.org/10.1016/j.jphotobiol.2009.03.002.
- Haegerbaeumer, Arne, Marie Theres Mueller, Hendrik Fueser, and Walter Traunspurger. 2019. “Impacts of Micro- and Nano-Sized Plastic Particles on Benthic Invertebrates: A Literature Review and Gap Analysis.” Frontiers in Environmental Science 7 (17): 1–33. doi:https://doi.org/10.3389/fenvs.2019.00017.
- Holle, Armin, Haase, Andreas Markus Kayser, and Jens Höhndorf. and 6-1. 2006. “Optimizing UV Laser Focus Profiles for Improved MALDI Performance.” Journal of Mass Spectrometry 41 (6): 705–716. doi:https://doi.org/10.1002/jms.1041.
- Huppertsberg, Sven, and Thomas P. Knepper. 2018. “Instrumental Analysis of Microplastics − Benefits and Challenges.” Analytical and Bioanalytical Chemistry 410 (25): 6343–6352. doi:https://doi.org/10.1007/s00216-018-1210-8.
- Hurley, Rachel R., Lusher, Amy L. Marianne Olsen, and Luca Nizzetto. and 7-3. 2018. “Validation of a Method for Extracting Microplastics from Complex, Organic-Rich, Environmental Matrices.” Environmental Science & Technology 52 (13): 7409–7417. doi:https://doi.org/10.1021/acs.est.8b01517.
- Ivleva, Natalia P., Alexandra C. Wiesheu, and Reinhard Niessner. 2017. “Mikroplastik in Aquatischen Ökosystemen.” Angewandte Chemie 129 (7): 1744–1764. doi:https://doi.org/10.1002/ange.201606957.
- Joachim, Lõder, Martin Günter, Kuczera, Mirco Svenja Mintenig, Claudia Lorenz, and Gunnar Gerdts. 2015. “Focal Plane Array Detector-Based Micro-Fourier-Transform Infrared Imaging for the Analysis of Microplastics in Environmental Samples.” Environmental Chemistry 12 (5): 563. doi:https://doi.org/10.1071/EN14205.
- Jung, Melissa R., F. David Horgen, Sara V. Orski, Viviana Rodriguez C, Kathryn L. Beers, George H. Balazs, T. Todd Jones, et al. 2018. “Validation of ATR FT-IR to Identify Polymers of Plastic Marine Debris, Including Those Ingested by Marine Organisms.” Marine Pollution Bulletin 127: 704–716. doi:https://doi.org/10.1016/j.marpolbul.2017.12.061.
- Käppler, Andrea, Dieter Fischer, Sonja Oberbeckmann, Gerald Schernewski, Matthias Labrenz, Klaus Jochen Eichhorn, and Brigitte Voit. 2016. “Analysis of Environmental Microplastics by Vibrational Microspectroscopy: FTIR, Raman or Both?” Analytical and Bioanalytical Chemistry 408 (29): 8377–8391. doi:https://doi.org/10.1007/s00216-016-9956-3.
- Kern, David G., Robert, S. Crausman, Kate, T. H. Durand, Ali Nayer, and Charles Kuhn. III. 8-15 1998. “Flock Worker's Lung: Chronic Interstitial Lung Disease in the Nylon Flocking Industry.” Annals of Internal Medicine 129 (4): 261–272. doi:https://doi.org/10.7326/0003-4819-129-4-199808150-00001.
- Kerr, Laura T., Hugh J. Byrne, and Bryan M. Hennelly. 2015. “Optimal Choice of Sample Substrate and Laser Wavelength for Raman Spectroscopic Analysis of Biological Specimen.” Analytical Methods 7 (12): 5041–5052. doi:https://doi.org/10.1039/C5AY00327J.
- Klein, Malin, and Elke K. Fischer. 2019. “Microplastic Abundance in Atmospheric Deposition within the Metropolitan Area of Hamburg, Germany.” Science of the Total Environment 685: 96–103. doi:https://doi.org/10.1016/j.scitotenv.2019.05.405.
- Lenz, Robin, Kristina Enders, Colin A. Stedmon, David M. A. Mackenzie, and Torkel Gissel Nielsen. 2015. “A Critical Assessment of Visual Identification of Marine Microplastic Using Raman Spectroscopy for Analysis Improvement.” Marine Pollution Bulletin 100 (1): 82–91. doi:https://doi.org/10.1016/j.marpolbul.2015.09.026.
- Levermore, Joseph M., Thomas E. L. Smith, Frank J. Kelly, and Stephanie L. Wright. 2020. “Detection of Microplastics in Ambient Particulate Matter Using Raman Spectral Imaging and Chemometric Analysis.” Analytical Chemistry 92 (13): 8732–8740. doi:https://doi.org/10.1021/acs.analchem.9b05445.
- Lim, Hyee Shynn, Alex Fraser, and Antony M. Knights. 2020. “Spatial Arrangement of Biogenic Reefs Alters Boundary Layer Characteristics to Increase Risk of Microplastic Bioaccumulation.” Environmental Research Letters 15 (6): 064024. doi:https://doi.org/10.1088/1748-9326/ab83ae.
- Liu, Chunguang, Jia Li, Yilei Zhang, Lei Wang, Jie Deng, Yuan Gao, Lu Yu, Junjie Zhang, and Hongwen Sun. 2019. “Widespread Distribution of PET and PC Microplastics in Dust in Urban China and Their Estimated Human Exposure.” Environment International 128: 116–124. doi:https://doi.org/10.1016/j.envint.2019.04.024.
- Lovera, Pierre, Niamh Creedon, Hanan Alatawi, Micki Mitchell, Micheal Burke, Aidan J. Quinn, and Alan O’Riordan. 2014. “Low-Cost Silver Capped Polystyrene Nanotube Arrays as Super-Hydrophobic Substrates for SERS Applications.” Nanotechnology 25 (17): 175502. doi:https://doi.org/10.1088/0957-4484/25/17/175502.
- Lusher, Amy L., Gema Hernandez-Milian, Joanne O'Brien, Simon Berrow, Ian O'Connor, and Rick Officer. 2015. “Microplastic and Macroplastic Ingestion by a Deep Diving, Oceanic Cetacean: The True's Beaked Whale Mesoplodon Mirus.” Environmental Pollution 199: 185–191. doi:https://doi.org/10.1016/j.envpol.2015.01.023.
- Lv, Lulu, Lei He, Shiqi Jiang, Jinjun Chen, Chunxia Zhou, Junhao Qu, Yuqin Lu, Pengzhi Hong, Shengli Sun, and Chengyong Li. 2020. “In Situ Surface-Enhanced Raman Spectroscopy for Detecting Microplastics and Nanoplastics in Aquatic Environments.” The Science of the Total Environment 728: 138449. doi:https://doi.org/10.1016/j.scitotenv.2020.138449.
- Magni, Stefano, Andrea Binelli, Lucia Pittura, Carlo Giacomo Avio, Camilla Della Torre, Camilla Carla Parenti, Stefania Gorbi, and Francesco Regoli. 2019. “The Fate of Microplastics in an Italian Wastewater Treatment Plant.” Science of the Total Environment 652: 602–610. doi:https://doi.org/10.1016/j.scitotenv.2018.10.269.
- Menchaca, C., Alvarez-Castillo, A., G. Martinez-Barrera, H. L. Pez-Valdivia, H. Carrasco, and V. M. Casta. 2003. “Mechanisms for the Modification of Nylon 6, 12 by Gamma Irradiation.” International Journal of Materials and Product Technology 19 (6): 521–529. doi:https://doi.org/10.1504/IJMPT.2003.003468.
- Mikoliunaite, Lina, Raul D. Rodriguez, Evgeniya Sheremet, Vladimir Kolchuzhin, Jan Mehner, Arunas Ramanavicius, and Dietrich R. T. Zahn. 2015. “The Substrate Matters in the Raman Spectroscopy Analysis of Cells.” Scientific Reports 5 (1): 13150. doi:https://doi.org/10.1038/srep13150.
- Mintenig, S. M., P. S. Bäuerlein, A. A. Koelmans, S. C. Dekker, and A. P. van Wezel. 2018. “Closing the Gap between Small and Smaller: Towards a Framework to Analyse Nano- and Microplastics in Aqueous Environmental Samples.” Environmental Science: Nano 5 (7): 1640–1649. doi:https://doi.org/10.1039/C8EN00186C.
- Nethery, Elizabeth, Mallach, Gary Daniel Rainham, Mark S. Goldberg, and Amanda J. Wheeler. and 5-8. 2014. “Using Global Positioning Systems (GPS) and Temperature Data to Generate Time-Activity Classifications for Estimating Personal Exposure in Air Monitoring Studies: An Automated Method.” Environmental Health: A Global Access Science Source 13 (1): 33–44. doi:https://doi.org/10.1186/1476-069X-13-33.
- Noda, I., A. E. Dowrey, J. L. Haynes, and C. Marcott. 2007. “Physical Properties of Polymers Handbook.” In Group Frequency Assignments for Major Infrared Bands Observed in Common Synthetic Polymers, 395–406. New York, NY: Springer.
- Oßmann, Barbara E., George Sarau, Sebastian W. Schmitt, Heinrich Holtmannspötter, Silke H. Christiansen, and Wilhelm Dicke. 2017. “Development of an Optimal Filter Substrate for the Identification of Small Microplastic Particles in Food by Micro-Raman Spectroscopy.” Analytical and Bioanalytical Chemistry 409 (16): 4099–4109. doi:https://doi.org/10.1007/s00216-017-0358-y.
- Pauly, John L., Sharon, J. Stegmeier, Heather A. Allaart, Richard T. Cheney, Paul J. Zhang, Andrew G. Mayer, and Richard J. Streck. 1998. “Inhaled Cellulosic and Plastic Fibers Found in Human Lung Tissue.” Cancer Epidemiology and Prevention Biomarkers 7 (5): 419–428.
- Pimentel, J. C., R. Avila, and A. G. Lourenco. 1975. “Respiratory Disease Caused by Synthetic Fibres: A New Occupational Disease.” Thorax 30 (2): 204–219. doi:https://doi.org/10.1136/thx.30.2.204.
- Prata, Joana C., Joana L. Castro, João P. da Costa, Armando C. Duarte, Teresa Rocha-Santos, and Mário Cerqueira. 2020. “The Importance of Contamination Control in Airborne Fibers and Microplastic Sampling: Experiences from Indoor and Outdoor Air Sampling in Aveiro, Portugal.” Marine Pollution Bulletin 159: 111522. doi:https://doi.org/10.1016/j.marpolbul.2020.111522.
- Primpke, S., C. Lorenz, R. Rascher-Friesenhausen, and G. Gerdts. 2017. “An Automated Approach for Microplastics Analysis Using Focal Plane Array (FPA) FTIR Microscopy and Image Analysis.” Anal Methods 9 (9): 1499–1511.
- Ragusa, Antonio, Alessandro Svelato, Criselda Santacroce, Piera Catalano, Valentina Notarstefano, Oliana Carnevali, Fabrizio Papa, et al. 2021. “Plasticenta: First Evidence of Microplastics in Human Placenta.” Environment International 146: 106274. doi:https://doi.org/10.1016/j.envint.2020.106274.
- Shan, Jiajia, Yituo Zhang, Jian Wang, Tao Ren, Mengke Jin, and Xue Wang. 2020. “Microextraction Based on Microplastic Followed by SERS for on-Site Detection of Hydrophobic Organic Contaminants, an Indicator of Seawater Pollution.” Journal of Hazardous Materials 400: 123202. doi:https://doi.org/10.1016/j.jhazmat.2020.123202.
- Simon, M., N. van Alst, and J. Vollertsen. 2018. “Quantification of Microplastic Mass and Removal Rates at Wastewater Treatment Plants Applying Focal Plane Array (FPA)-Based Fourier Transform Infrared (FT-IR) Imaging.” Water Research 142: 1–9.
- Sobhani, Zahra, Md Al Amin, Ravi Naidu, Mallavarapu Megharaj, and Cheng Fang. 2019. “Identification and Visualisation of Microplastics by Raman Mapping.” Analytica Chimica Acta 1077: 191–199. doi:https://doi.org/10.1016/j.aca.2019.05.021.
- Sobhani, Zahra, Xian Zhang, Christopher Gibson, Ravi Naidu, Mallavarapu Megharaj, and Cheng Fang. 2020. “Identification and Visualisation of Microplastics/Nanoplastics by Raman Imaging (i): down to 100 Nm.” Water Research 174: 115658. doi:https://doi.org/10.1016/j.watres.2020.115658.
- Stone, Nicholas, Maria Consuelo Hart Prieto, Paul Crow, Jeremy Uff, and Alistair William Ritchie. 2007. “The Use of Raman Spectroscopy to Provide an Estimation of the Gross Biochemistry Associated with Urological Pathologies.” Analytical and Bioanalytical Chemistry 387 (5): 1657–1668. doi:https://doi.org/10.1007/s00216-006-0937-9.
- Toussaint, Brigitte, Raffael, Barbara, Alexandre Angers-Loustau, Douglas Gilliland, Vikram Kestens, Mauro Petrillo, Iria M. Rio-Echevarria, and Guy Van den Eede. 2019. “Review of Micro- and Nanoplastic Contamination in the Food Chain.” Food Additives & Contaminants: Part A 36 (5): 639–673. doi:https://doi.org/10.1080/19440049.2019.1583381.
- Vianello, Alvise, Rasmus Lund Jensen, Li Liu, and Jes Vollertsen. 2019. “Simulating Human Exposure to Indoor Airborne Microplastics Using a Breathing Thermal Manikin.” Scientific Reports 9 (1): 8670. doi:https://doi.org/10.1038/s41598-019-45054-w.
- Weinstein, John E., Brittany K. Crocker, and Austin D. Gray. 2016. “From Macroplastic to Microplastic: Degradation of High-Density Polyethylene, Polypropylene, and Polystyrene in a Salt Marsh Habitat.” Environmental Toxicology and Chemistry 35 (7): 1632–1640. doi:https://doi.org/10.1002/etc.3432.
- Weisenburger, Siegfried, and Vahid Sandoghdar. 2015. “Light Microscopy: An Ongoing Contemporary Revolution.” Contemporary Physics 56 (2): 123–143. doi:https://doi.org/10.1080/00107514.2015.1026557.
- Wright, S. L., J. Ulke, A. Font, K. L. A. Chan, and F. J. Kelly. 2020. “Atmospheric Microplastic Deposition in an Urban Environment and an Evaluation of Transport.” Environment International 136: 105411. doi:https://doi.org/10.1016/j.envint.2019.105411.
- Wright, Stephanie L., Joseph M. Levermore, and Frank J. Kelly. 2019. “Raman Spectral Imaging for the Detection of Inhalable Microplastics in Ambient Particulate Matter Samples.” Environmental Science & Technology 53 (15): 8947–8956. doi:https://doi.org/10.1021/acs.est.8b06663.
- Zada, Liron, Heather A. Leslie, A. Dick Vethaak, Gerjen H. Tinnevelt, Jeroen J. Jansen, Johannes F. de Boer, and Freek Ariese. 2018. “Fast Microplastics Identification with Stimulated Raman Scattering Microscopy.” Journal of Raman Spectroscopy 49 (7): 1136–1144. doi:https://doi.org/10.1002/jrs.5367.
- Zhao, Shiye, Meghan Danley, J. Evan Ward, Daoji Li, and Tracy J. Mincer. 2017. “An Approach for Extraction, Characterization and Quantitation of Microplastic in Natural Marine Snow Using Raman Microscopy.” Analytical Methods 9 (9): 1470–1478. doi:https://doi.org/10.1039/C6AY02302A.
- Zoladek, Alina, Flavius C. Pascut, Poulam Patel, and Ioan Notingher. 2011. “Non − Invasive Time − Course Imaging of Apoptotic Cells by Confocal Raman Micro − Spectroscopy.” Journal of Raman Spectroscopy 42 (3): 251–258. doi:https://doi.org/10.1002/jrs.2707.