
Abstract
Exposure to engineered nanomaterials (ENM) poses a potential health risk to humans through long-term, repetitive low-dose exposures. Currently, this is not commonplace within in vitro lung cell cultures. Therefore, the purpose of this study was to consider the optimal exposure approach toward determining the stability, sensitivity and validity of using in vitro lung cell mono- and co-cultures to determine ENM hazard. A range of exposure scenarios were conducted with DQ12 (previously established as a positive particle control) (historic and re-activated), TiO2 (JRC NM–105) and BaSO4 (JRC NM–220) on both monocultures of A549 cells as well as co-cultures of A549 cells and differentiated THP-1 cells. Cell cultures were exposed to either a single, or a repeated exposure over 24, 48- or 72-hours at in vivo extrapolated concentrations of 0–5.2 µg/cm2, 0-6 µg/cm2 and 0-1µg/cm2. The focus of this study was the pro-inflammatory, cytotoxic and genotoxic response elicited by these ENMs. Exposure to DQ12 caused pro-inflammatory responses after 48 hours repeat exposures, as well as increases in micronucleus frequency. Neither TiO2 nor BaSO4 elicited a pro-inflammatory response at this time point. However, there was induction of IL-6 after 24 hours TiO2 exposure. In conclusion, it is important to consider the appropriateness of the positive control implemented, the cell culture model, the time of exposure as well as the type of exposure (bolus or fractionated) before establishing if an in vitro model is appropriate to determine the level of response to the specific ENM of interest.
Introduction
The lung is one of the major exposure pathways for engineered nanomaterials (ENMs) to the human body (Oberdorster, Oberdorster, and Oberdorster Citation2005; Yokel and Macphail Citation2011). A nanomaterial has been defined via the European Commission as a “natural, incidental or manufactured material containing either unbound or aggregated or agglomerated and where 50% or more of the particles in the number size distribution, one or more external dimensions is in the size range 1 nm–100 nm “(CELEX Citation2011). They have a higher surface (area) to volume ratio when compared to their bulk-sized (i.e. >100nm) counterparts (Hackenberg et al. Citation2011). Both surface area and reactivity have the potential to cause an inflammatory response, as they are interconnected (Duffin et al. Citation2007). A further consideration of the ENM of interest is their solubility, and the potential for them to be soluble within the cell culture exposure medium (Warheit and Brown Citation2019). Within these contexts, there is a substantial amount of literature previously published investigating the effects on ENMs and the airways, since this is considered the primary form of human exposure, particularly within the occupational environment (Stone et al. Citation2017). This has been achieved using a variety of different exposure systems, including both in vivo and in vitro models. With increasing advancements in in vitro, and the intention to move away from in vivo models for ENM toxicology testing, it is important to utilize advanced in vitro models and for them to be as predictive of in vivo as possible. However, there is a wealth of information in historic in vivo data which should not be discarded. An optimal (advanced) in vitro model would be one that could becompared to in vivo responses, as well being used to predict in vivo responses. To establish the pulmonary effects of ENM, the region of the lung needs to be considered. The characteristic size of ENMs indicates that the area of exposure that should be focused on is the alveolar region (Smith Citation1998). To represent a specific region within the lung, such as the alveoli, various cell types must be used within a culture, replicating both the barrier and the immune cells present (Crapo et al. Citation1982). Both cell lines and primary cells have their pros and cons (Kaur and Dufour Citation2012), and all of these must be considered (as well as the region of the lung aiming to be mimicked) when choosing the cells for the model (Hiemstra et al. Citation2018; Lacroix et al. Citation2018; Upadhyay and Palmberg Citation2018). As well as ensuring the correct cells, via both Good In Vitro Method Practices (GIVIMP) (OECD 2018) and confirming what cells are present within the area of interest in the lung (OECD Citation2018; Lujan et al. Citation2019), it is also important to select the correct scaffold and relevant membrane to grow cells on (Bérubé et al. Citation2010; Bhowmick and Gappa-Fahlenkamp Citation2016; Dorrello et al. Citation2017).
Additionally, it is important to consider the length, the route and the type of exposure to lung cell cultures relative to the stability of the in vitro model. This includes the potential for repeat and single exposures over the optimal culture time of the in vitro model. Previously the usefulness of implementing in vitro models to predict the potential long-term effects of nanomaterials has not been fully investigated. Instead, due to a number of experimental reasons, short-term exposures and biological impact has been predominantly focused upon (Clift et al. Citation2020). Therefore, to deduce truly the long-term impact of ENMs upon human health, further work needs to be conducted. For in vitro models to be considered as a valid replacement of in vivo models there needs to be an analysis of their capability to replicate, and/or predict the in vivo response (Kumar et al. Citation2017; Clippinger et al. Citation2016). Thus, long-term impacts need to be elucidated in vitro, either through stable long-term cell cultures, or via manipulation of the experimental design and variables.
Past studies using ENM (and specifically the lung exposures) are performed under submerged conditions and the ENM are added directly into the cell culture medium (Clippinger et al. Citation2016; Vuong et al. Citation2017; Zhang et al. Citation2018). This is the most accessible model, but it does not represent the lung and is unrealistic in terms of physiology and exposure environment(s). Cells within the lung do not exist in submerged conditions and are covered by a layer of surfactant which is exposed to air (Griese Citation1999) and also has the potential to change the effects of ENM exposed to the cells (Lesniak et al. Citation2012; Mahmoudi et al. Citation2013; Wan et al. Citation2015). Therefore, it is important to use cell systems that mimic this scenario (Blank et al. Citation2006; Bruce et al. Citation2009) and increase the predictability of the in vitro model compared to the in vivo. This is something that could potentially be used to replace or reduce animal testing of these materials, as outlined in the “Three Rs” directive from the European Union (Directive 2010/63/EU) and Burden et al. (Citation2017). To replicate the physiology, in vitro models must also be exposed to the air. Multiple studies have compared submerged cultures and those at an air-liquid interface (ALI) (Hiemstra et al. Citation2018; Lacroix et al. Citation2018; Upadhyay and Palmberg Citation2018). Various studies were performed in order to investigate if the enhanced complexity of the ALI exposures compared to submerged exposures is required (Lenz et al. Citation2013; Hilton et al. Citation2019), as it has been identified that cellular properties are changed upon switching to an ALI (Öhlinger et al. Citation2019). Therefore, it is important to complete studies at an ALI, and not at the commonly used submerged conditions.
As well as the exposure method, it is also important to consider how these models are exposed to ENMs. Occupational and environmental exposures consist of repeated exposures of low concentrations, and this combination has been previously identified to cause lower toxicity than high concentrations on vascular endothelium (Wang and Tang Citation2021). However, this repeated exposure to various ENMs or larger particles does have the potential to lead to the sensitization of the airways and the development of allergic inflammatory diseases (Joubert et al. Citation2020; Ma Citation2020). The majority of the literature agrees on one component of this repeated low concentration exposures of ENMs (through various exposure routes), and that is that more work is required to fully determine the potential health consequences of these exposures (Jiang et al. Citation2020; Liu and Liu Citation2020; Bessa et al. Citation2020).
The aim of this study therefore, was to identify the optimal exposure approach toward determining the stability, sensitivity and validity of using in vitro lung cells for ENM hazard assessment. Initially the sensitivity of the model was assessed with a known positive particle control (DQ12), before further establishing the biological impact of DQ12 after both single and repeated exposures. Additionally, testing of the optimal model and exposure approach was conducted with ENMs (i.e. TiO2 and BaSO4) to determine if these responses are consistent regardless of particle type used. It is hypothesized that the specific period of exposure of the ENMs/particles will be directly related to the sensitivity of the lung in vitro cell system response.
Materials and methods
All chemicals and reagents were purchased from Sigma Aldrich (UK) unless otherwise stated.
Cell cultures
A549 (ATCC® CCL-185™) and NCI-H441 (ATCC® HTB-174™) cells were obtained from American Tissue Culture Collection (ATCC, USA) and were cultured at 37 °C, 5% CO2. A549 were cultivated in RPMI-1640 medium (Gibco, USA) supplemented with 10% heat inactivated fetal bovine serum (FBS, Gibco, USA), 2 mM L-Glutamine (Gibco, USA), 100 U/mL penicillin and 100 µg/mL streptomycin (Gibco, USA). NCI-H441 were cultivated in RPMI-1640 ATCC Modified medium (Gibco, USA) (Herzog et al. Citation2014), supplemented with 10% heat inactivated fetal bovine serum (FBS, Gibco, USA), and 100 U/mL penicillin and 100 µg/mL streptomycin (Gibco, USA). A549 supplemented RPMI-1640 is cited as A549 complete cell medium (A549-CCM), while NCI-H441 supplemented RPMI-1640 is further cited as H441-CCM. Both cell types were passaged when ∼80% confluent and used between passages 5-15 (A549) and 4-10 (NCI-H441), for all experimentation. Note that the difference in passage numbers used between each epithelial cell type examined was due to the differences in cell doubling time, 22 (A549) and 58 (NCI-H441) hours respectively.
THP-1 (ATCC® TIB-202™) cells were obtained from American Tissue Culture Collection (ATCC, USA) and were cultured at 37 °C, 5% CO2. THP-1 cells were cultivated in RPMI-1640 medium (Gibco, USA) supplemented with 10% heat inactivated fetal bovine serum (FBS, Gibco, USA), 2 mM L-Glutamine (Gibco, USA), 100 U/mL penicillin and 100 µg/mL streptomycin (Gibco, USA). Cells were maintained at ca. 1 × 10⁶ cells/ml.
Epithelial cell monocultures
Either A549 or NCI-H441 cells were seeded on the apical side of a 6-well (4.2cm2 growth surface area) Falcon cell culture insert (transparent PET membrane with 3 µm pores; Corning, UK) at a density of 2.78 × 10⁵ cells/cm2 in 1.5 mL of either A549-CCM or H441-CCM, with 3 mL A549-CCM or H441-CCM in the basal compartment. On the 4th (A549) or 3rd (NCI-H441) day respectively after cell seeding, the medium was changed and cells were switched to the air-liquid interface (ALI) with 3 mL of A549-CCM or H441-CCM in the basal compartment and apical compartment exposed to air (i.e. no medium on the apical layer). The optimal time for exposure and ALI switching has been previously determined (SI ). After switching to the ALI, epithelial cells were provided 24 hours to equilibrate prior to exposures (Herzog et al. Citation2013; Klein et al. Citation2013; Herzog et al. Citation2014).
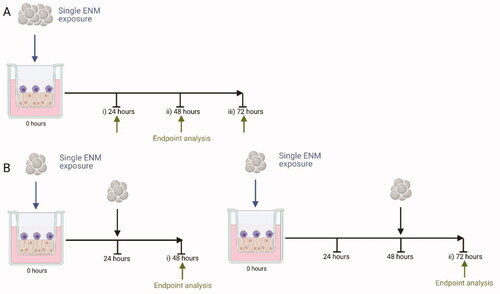
Figure 1. Exposure Scenarios used. An exposure of an ENM (blue arrow) is completed and analyzed at specific time points (green arrow), either after a single exposure (A.) of 24 hours (A. i), 48 hours (A. ii), or 72 hours (A. iii), or repeat exposures (B) of 48 hours (B. i) or 72 hours (B. ii). All exposures equate to the same deposited exposure concentration regardless of the exposure scenario chosen (for scenario B this is a fractionated dose which is equal to the same final concentration as A). Created with BioRender.com.
Epithelial-Macrophage cell Co-cultures
Both epithelial cell types were grown as previously outlined. THP-1 cells were differentiated into a macrophage-like phenotype (dTHP-1) via exposure to 20 nM phorbol 12-myristate-13-acetate (PMA) for 48 hours with a further 48 hours of recovery in complete medium (Risby et al. In Preparation). dTHP-1 cells were subsequently seeded onto the apical layer of the epithelial cell cultures for 2 hours (i.e. to allow adherence) prior the culture being switched to the ALI.
ENMs and particle exposures
After characterizing the A549 monoculture daily for 14 days at both submerged and ALI conditions (implementing viability, membrane integrity and pro-inflammatory mediator release) to determine the stability over time, we were able to establish the life of the culture and therefore the length of exposures used herein (SI ). From this information the exposure set-up described in was established. TiO2 (JRCNM01005a) and BaSO4 (JRCNM50001a) were supplied by the European Commission Joint Research Center Nanomaterial Repository (https://ec.europa.eu/jrc/en/scientific-tool/jrc-nanomaterials-repository). The specific physical and chemical characteristics have previously been reported (Keller et al. Citation2020).
When determining the effects of any ENM it is important to also have a positive particle control that has the potential to illicit a heightened response for the endpoint of interest. Two different DQ12 particles were implemented within this work. Historic-DQ12 particles (Clouter et al. Citation2001) – particles that have not had their surface manipulated since collection - were kindly donated by the Institute of Occupational Medicine (IOM), Edinburgh, and re-activated-DQ12 particles – re-activated via grinding - were kindly donated by the French National Research and Safety Institute (INRS). Historic-DQ12 was previously characterized as outlined in (Robock Citation1973; Clouter et al. Citation2001), while re-activated-DQ12 by grinding (10 g) for 15 min at 1400 rpm with a vibratory disk mill RS 200 (Retsch) and tungsten carbide grinding tools was characterized as outlined in Valentino et al. (in press).
Endotoxin analysis was completed in house for all particles (nano)particle types using the PyroGene Recombinant Factor C Endpoint Fluorescent Assay (Lonza, UK) kit as per manufacturers guidance. In addition, spiked positive controls were also included and no endotoxin was detected in any of the (nano)particle types tested (EU <0.05). All particles were dispersed and sonicated based on “The NANOGENOTOX dispersion protocol” (Hadrup et al. Citation2017). Particles were dispersed by sonication (Branson Sonifier 250, Ø 13 mm, 400 W output power, 20 kHz) in 0.05% bovine serum albumin. A stock solution of ENMs was prepared at a concentration of 2.56 mg/ml, which was diluted in the relevant CCM to the desired concentration. All exposure concentrations have been previously found to induce significant inflammatory effects in vivo (0–5.2 µg/cm2, 0–6 µg/cm2 and 0–1µg/cm2 respectively) after IVIVE calculations have been completed on the materials (https://www.patrols-h2020.eu/publications/sops/index.php and https://www.patrols-h2020.eu/publications/sops/SOP-library-pdfs/3105_PATROLS-Guidance-Document-for-ENMs-lung-dosing-consideration.pdf?m=1636040473&) with higher concentrations (as a comparison to the normally high concentrations found within the literature) included (10–200µg/cm2 for TiO2 and both types of DQ12 and 60–120 µg/cm2 for BaSO4).
Cells were exposed via a quasi-ALI exposure technique formally described in Endes et al. (Citation2014). This exposure method allows cells to be exposed while at the ALI, whilst coating a proportion of the cells, a closer mimic of an inhalation exposure as not all lung cells are exposed to the materials (Geiser and Kreyling Citation2010). This method entails exposing the cells apically to 100 µl of the particle suspension using a 6-well plate setup. Endpoint analysis was subsequently completed after 24, 48 and 72 hours of single or repeat exposures (at the same time points) as described in .
Biochemical analysis
Samples were either processed for viability assessment (Trypan blue exclusion assay), or membrane integrity (Blue Dextran assay), whilst supernatants were collected and stored at −80 °C for future analysis of specific pro-inflammatory mediators (Interleukin (IL)-6 and IL-8).
Trypan blue exclusion assay
Cellular viability was determined using the trypan blue exclusion assay. Briefly, 10 µL of trypan blue dye (0.4%) was added to 10 µL of the cell suspension, before being counted with a hemocytometer and percentage viability calculated (Barosova et al. Citation2021).
Pro-inflammatory response
The pro-inflammatory response of the A549 and NCI-H441 mono-, and co-cultures following exposure to both types of DQ12, TiO2 and BaSO4 at all test concentrations was measured by quantifying the amount of the pro-inflammatory mediators released into the basal medium via Enzyme-Linked Immunosorbent Assay (ELISA) of cell supernatants collected at all experimental timepoints, therefore negating the potential for the ENMs to interfere with this biochemical technique. A positive control of medium spiked with a known concentration of ENM was also included within these colourimetric assays to ensure there was no particle interference (data not shown). Levels of IL-8 (Cat no. DY208) and IL-6 (Cat no. DY206) were measured using DuoSet kits from R&D systems (Biotechne, Abingdon, UK) according to the manufacturer’s instructions. Samples were analyzed in triplicates, representing three independent biological replicates (n = 3). Extrapolation of protein concentration was carried out from a standard curve of known concentrations (IL-8 0–2000pg/ml and IL-6 0–200pg/ml).
In vitro cytokinesis blocked micronucleus (CBMN) assay (monoculture)
A549 cells only (and not NCI-H441 cells) were utilized for the CBMN assay due to the cell cycle time of the NCI-H441 (∼56 hours) being too long for the assay. Cytotoxicity was assessed alongside micronucleus scoring by relative population doubling (RPD) as described previously (Manshian et al. Citation2013). This was to ensure that cytotoxicity of the cell line remained within the OECD test guideline 487 recommendation of 55 ± 5% (this ensures any observed DNA is not a consequence of nuclear break down during cell death). A549 cells were seeded and treated with test materials as described above for 24 hours (ca. 1-cell cycle) and 48 hours. Mitomycin-C (MMC) at 0.01 μg/mL was used as a positive control. After exposure, cells were washed in phosphate buffered saline (PBS) three times and re-suspended in fresh media containing 3 μg/mL cytochalasin B for a further 24 hours. The cells were then trypsinised, pelleted by centrifugation (1200xg for 5mins) and washed twice in PBS. Slides were prepared and scored for the presence of micronuclei in binucleated cells using the automated micronucleus Metafer image analysis system (Metasystems, Carl Zeiss Ltd) as described previously by Singh et al. (Citation2012). All experiments were performed in triplicate (n = 3) and 1000 binucleuate cells per replicate were scored (3000 binucleate cells in total) for each treatment.
In vitro CBMN assay for multi-cell cultures
Based on the method previously described (Evans et al. Citation2019), co-culture treatments were undertaken for both 24 and 48 hours as completed in the monocultures. Mitomycin-C (MMC) at 0.01 μg/mL was used as a positive control. Cultures were then washed in PBS and media containing 3 µg/mL cytochalsin-B was placed in both the apical and basal transwell chambers and incubated for 24 hours. Cells were subsequently trypsinised (as above), fixed in 3% paraformaldehyde and permeabilized with Triton X100. Cells were washed with PBS prior to staining with 1 µg/ml of anti-human CD324 (e-cadherin) with a conjugated FITC fluorophore (BioLegend®, San Francisco, USA). Following washing and resuspension in 1 mL of PBS, cells were pipetted on to slides and coverslips were attached with DAPI VECTASHIELD (VECTOR Laboratories, USA). Cell imaging and micronuclei identification was undertaken using an Axioimager Z2 fluorescent microscope with a one megapixel charged coupled device camera (Carl Zeiss, UK) as previously described (Evans et al. Citation2019). Cytotoxicity was assessed alongside micronucleus scoring by the cytokinesis-blocked proliferation index (CBPI) as described previously (Manshian et al. Citation2013). All experiments were performed in triplicate (n = 3) and 1000 binucleuate cells per replicate were scored (3000 binucleate cells in total) for each treatment.
Data and statistical analysis
All data are presented as the mean ± the standard deviation (SD). All endpoints were assessed upon three independent cell cultures (n = 3). Statistical analysis was performed using GraphPad Prism 8 (GraphPad Software Inc., La Jolla, USA) software. A two-way analysis of variance (ANOVA) with subsequent Tukey’s multiple comparisons test was performed for each endpoint, except CBMN analysis which was completed with a one-way ANOVA with subsequent Dunnett’s post-hoc test. Results were considered significant if p < 0.05.
Results and discussion
The purpose of this study was to determine, using different mono- and co-culture in vitro systems, the time point and exposure approach that would incite the most sensitive response (in terms of cytotoxic, genotoxic and pro-inflammatory effects) of this specific in vitro model, relevant to in vivo extrapolated concentrations, following exposure to the tested (nano)particles (i.e. both types of DQ12, TiO2 and BaSO4).
Single exposures
24 Hours
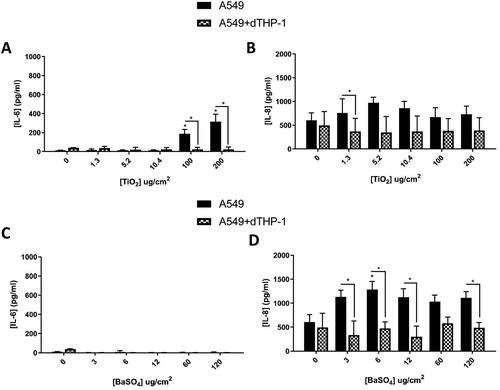
As the majority of the literature focuses on 24 hour exposures, initially in order to attain a baseline level of understanding of the different cultures and ENM types, 24 hour exposures were completed using both the monocultures and the co-cultures of both A549 and NCI-H441 cells (+dTHP-1) using both historic-DQ12 (previously identified as a positive control) and TiO2 (known to be an insoluble and active material (as it can induce inflammation, genotoxicity, and metabolic changes) (Grande and Tucci Citation2016)). After the analysis of these results, the A549 monoculture had a significantly (p < 0.01) increased IL-6 concentration when compared to the co-culture 24 hours after exposure to historic DQ12 (100 and 200 µg/cm2) (). This was replicated 24 hours after exposure to TiO2 (). Both of these concentrations (100 and 200 µg/cm2) are higher than the IVIVE extrapolated concentrations and this high concentration could cause an in vitro cellular overload effect and therefore induce IL-6 production (Bevan et al. Citation2018). IL-6 can be produced by both macrophages and lung epithelial cells, and where the epithelial layer is damaged there can be a substantial increase in the concentration of IL-6 produced (Rincon and Irvin Citation2012). This decrease in IL-6 concentration in the co-cultures when compared to the monocultures can be explained by the presence of IL-6 receptors (IL-6R) on THP-1 cells and the binding of IL-6 via “classical signaling” (Rincon and Irvin Citation2012; Wolf, Rose-John, and Garbers Citation2014), removing it from the basal medium. There were also significant increases in IL-8 concentration when compared to the co-culture 24 hours after exposure to DQ12 (0.5, 1 and 10 µg/cm2) (). This is the opposite to what would be expected from the literature (Klein et al. Citation2013), however, this pattern has been previously identified after exposure to “poultry dust” in submerged conditions and significant increases in gene expression of IL-8 in the A549 cells, but not monocyte THP-1 cells (Boggaram et al. Citation2016).
Figure 2. 24 hour single exposure of DQ12 (A and B) and TiO2 (C and D) on both A549 monocultures, A549 + dTHP-1 co-cultures, NCI-H441 mono cultures and NCI-H441 + dTHP-1 co-cultures. Cells were exposed to DQ12 for 24 hours at the ALI, before analyzing various endpoints. IL-6 (A, and C) and IL-8 (B and D) concentrations were measured in the basal compartment of the ALI culture after a single particle exposure (onto the apical side). N = 3 with all assays performed in triplicate. The data is presented as the mean ± Standard deviation. Significance is denoted as the following: compared to the medium control p < 0.01(*).
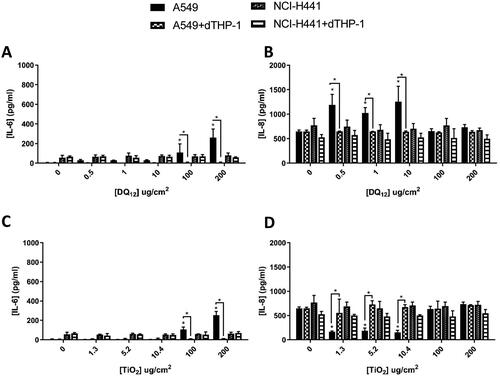
There was a significant (p < 0.01) decrease in IL-8 production after exposure to 1.3, 5.2 and 10.4 µg/cm2 TiO2 in the A549 monoculture when compared to the co-culture (). This is consistent with previous studies where the co-culture produces IL-8 post-exposure to TiO2, but the monoculture is non-responsive (Loret et al. Citation2016). This study used an aerosol exposure system, but with similar exposure concentrations (1 and 3 µg/cm2). Within the work of Loret et al. (Citation2016) it was also identified that these exposures increased the IL-6 concentrations (Loret et al. Citation2016), which was not seen in this study.
No pro-inflammatory changes were identified after exposure to either the NCI-H441 mono- or co-culture 24 hours after DQ12 or TiO2 exposures (). TiO2 is known to cause toxicity and induce a pro-inflammatory response in only some cell types (HepG2, A549 and RAW264.7) and with only certain surface characteristics, such as plain particles and some coated with PVP in submerged conditions (Hansjosten et al. Citation2018). This suggests that the NCI-H441 cell line is not highly sensitive to the effects of particle exposure (either DQ12 or TiO2 – ). It has also been previously suggested that NCI-H441 cells do not have the same potential for pro-inflammatory responses as the A549 cells when cultured alone and with dTHP-1 cells (Kasper et al. Citation2017). However, NCI-H441 were chosen for this study as a valid alternative Type-II epithelial cell to the A549 cell cultures, due to their known genetic instability (Alidousty et al. Citation2018). Nonetheless, as seen previously, A549 cells were identified to be sensitive to the ENM exposures used herein.
Thus, based on these findings, the decision to only use A549 co-cultures over NCI-H441 co-culture was made. Additional factors for this reason also include; limitations that have been put on the cell line (NCI-H441) that does not allow them to be used within an industrial setting (ATCC) (https://www.atcc.org/products/htb-174#product-permits) and therefore their inability to be used in a regulatory setting; their longer cell cycle time meaning they could not be used for all end point analysis; and the variation in medium requirements compared to the THP-1 cells.
No cytotoxicity was observed in A549 cells cultured at the mono- or dTHP-1 co-culture scenario and treated with historic DQ12 samples (10 µg/cm2) or TiO2 (10.4 µg/cm2) following a 24 hour single exposure (). The CBMN assay demonstrated no significant (p > 0.05) increase in micronucleus frequency in monocultured A549 treated with the same concentrations of historic DQ12, however there was a significant increase (1%) when treated with TiO2. This is opposite to what has been previously identified within the literature (Ohshima, Xu, and Takahama Citation1998) in submerged conditions at a concentration of 100 µg/cm2 of both particle types. Previous works within the literature has evidenced internalization of TiO2 NPs in A549 cells (Stringer and Kobzik Citation1996; Scherbart et al. Citation2011), which may be related to the increased Mn frequency identified within this study ().
Figure 3. Micronucleus frequency (%) 24 hour post a single exposure of TiO2 or DQ12 on both A549 monocultures, and A549 + dTHP-1 co-cultures. Cells were exposed to either TiO2 or DQ12 for 24 hours at an ALI, before analyzing various endpoints. Both the monoculture (A) and the co-culture (B) were analyzed. For all CBMN assays, MMC (0.01 mg/ml) was used as a positive control. N = 3 with all assays performed in triplicate. The data is presented as the mean ± Standard deviation. Significance is denoted as the following: compared to the medium control p < 0.05(*) and p < 0.01(**).
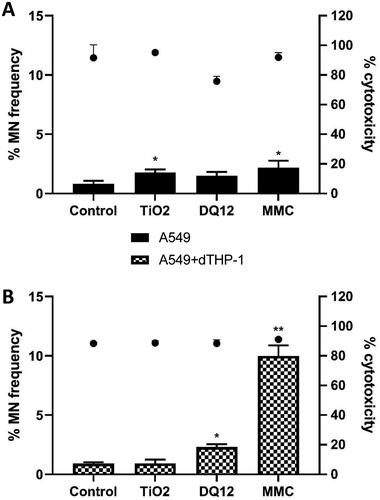
It has been reported that A549 cells are more resistant to the effects of DQ12 when compared to other cell lines (Schins et al. Citation2002a) in submerged conditions. In the co-culture scenario DQ12 significantly (p < 0.05) promoted an increase in micronucleus frequency (1.393%) compared to the untreated control, conversely there was no significant response following TiO2 exposure (p < 0.05) (). With the addition of macrophages to the A549 epithelial layer, the sensitivity of the in vitro model to the genotoxic effects of DQ12 was increased and the micronucleus frequency was increased. This suggests that secondary genotoxicity is an important mechanism of DNA damage for this particle type whereby nanomaterial stimulation of an immune cell type promotes downstream DNA damage (Doak et al. Citation2012; Evans et al. Citation2017). A previous study exposing a bronchial cell line (16HBE14o-) to iron oxide (Fe3O4) ENM (10 nm) has demonstrated these mechanisms of secondary genotoxicity in a co-culture scenario after nanomaterial exposure in submerged conditions (Evans et al. Citation2019). Moreover, a recent study (Burgum et al. Citation2021) implementing type I lung epithelial cells and dTHP-1 cells grown in a co-culture identified a similar pattern of increased genotoxicity in the co-culture compared to the monoculture in submerged conditions.
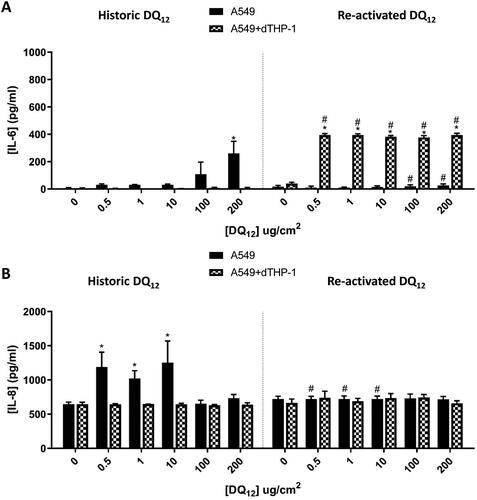
From we have identified that DQ12 does not induce the pro-inflammatory response to be expected from this positive particle control. As this response is thought to be due to the surface characteristics of DQ12 and therefore the activation status (Albrecht et al. Citation2002; Duffin et al. Citation2002; Albrecht et al. Citation2005), a comparison between historic DQ12 and re-activated (via grinding) DQ12 was conducted, since such a re-activation of DQ12 surface has been previously shown to be important in the cytotoxic and genotoxic response seen (Schins et al. Citation2002b). Following 24 hours exposure to both DQ12 types (0.5-200µg/cm2) to mono- (A549 cells) and co-cultures (A549 + dTHP-1 cells) the pro-inflammatory responses were investigated (). There was a significant (p < 0.01) increase in the concentration of IL-6 () after historic DQ12 exposure at the highest concentration (200 µg/cm2) in the monoculture only. No changes were observed in the co-culture (). Interestingly however, with the re-activated DQ12, after 24 hours exposure significant (p < 0.01) increases in IL-6 were noted for all tested particle concentrations in the co-culture when compared to the medium control and the equivalent historic DQ12 exposures (). This difference could be down to the responses of the macrophages to the grinded silica alone, as it has been identified that this exposure has the potential to generate reactive oxygen species (ROS) and induce pro-inflammatory effects (including the production of IL-6 and IL-8) (Ghio et al. Citation2019). No changes were observed with the monoculture system following exposure to the re-activated DQ12 (). Analysis of the IL-8 response indicated no effects following exposure to the re-activated DQ12 sample at all tested concentrations after 24 hours (). Only a significant (p < 0.01) increase in IL-8 was noted with historical DQ12 exposure to A549 monocultures at 0.5, 1 and 10 µg/cm2 when compared to the medium control and the re-activated DQ12 at the same concentrations tested. The opposite response has been identified when triple cultures (A549 + THP-1+ Ea.hy 926) are exposed to two different types of quartz under submerged conditions, with the smaller particle (Si10) eliciting a higher response than the larger (Min-U-Sil) at a concentration slightly higher than the IVIVE concentration used within this study (24 µg/cm2) (Skuland et al. Citation2020). As the historic DQ12 is slightly smaller (BET of 3.5 ± 0.9 vs 10.3 ± 2.6m2/g) than the re-activated DQ12 it indicates that the size of the particle is not the only factor in this increase. Another triple-culture (A549, monocyte-derived macrophages and dendritic cells) using an aerosol exposure of a similar concentration (0.14–1.57 µg/cm2) also identified an increase in the IL-8 concentration measured 24 hours post-DQ12 exposure (historic-DQ12) (Endes et al. Citation2014), suggesting that it may be the addition of cells and the advancement of the model that is inducing this effect. Previous studies (using a similar dose range) under submerged conditions have identified that different types of quartz do have the potential to cause varying effects in both genotoxicity (1.6-200 µg/cm2) (Cakmak et al. Citation2004) and inflammatory responses (Clouter et al. Citation2001), with this thought to be explained via the variations in the surface modulations and reactivity of the particulate matter itself (and not the exposure time).
Figure 4. 24 hour single exposure of both Historic and Re-activated DQ12 on both A549 monocultures and A549 + dTHP-1 co-cultures. Cells were exposed to DQ12 for 24 hours at an ALI, before analyzing various endpoints. IL-6 (A) and IL-8 (B) concentrations were measured in the basal compartment of the ALI culture after a single particle exposure (onto the apical side). N = 3 with all assays performed in triplicate. The data is presented as the mean ± Standard deviation. Significance is denoted as the following: compared to the medium control p < 0.01(*); and compared to the Historic DQ12 p < 0.01(#).
In vivo exposures have conflicting results regarding DQ12 exposures, depending on the animal used. Intratracheal instillation into mice lead to a significant increase of IL-6 at 24 hours when compared to 3 months at the highest exposure concentration (500 µg/animal) (Roursgaard et al. Citation2011). Intratracheal instillation into rats (15.2 mg/kg) showed that there was an increase in lung weight, and neutrophils in the BAL fluid 90 days post exposure when compared to both the negative control and 3, as well as 28 days post exposure (Creutzenberg et al. Citation2008). DQ12 has also been identified to behave in the same way as cristobalite silica and cause an enhanced inflammatory response in vivo (Housley et al. Citation2002).
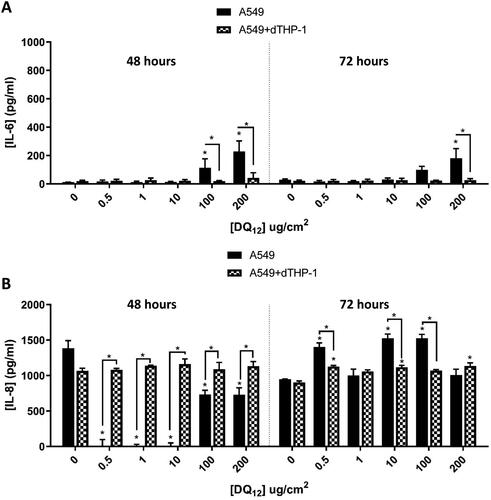
From characterizing the cell systems used herein, it is known that our A549 mono- and A549+dTHP-1 co-culture models are stable for up to 96 hours at ALI (24 hours acclimation, and 72 hours exposure (). Thus, subsequent experimentation focused upon using single exposures with longer exposure periods; either 48 hours or 72 hours; to historic DQ12 to confirm the pro-inflammatory response to this positive control did not require a longer incubation (than 24 hours). Following this approach, it was observed that there was a significant (p < 0.01) increase in the concentration of IL-6 () after 48 hours in the A549 monocultures, at the two highest concentrations tested. These findings concur with the response as seen previously at 24 hours (). IL-8 concentration was significantly (p < 0.01) increased in the co-culture when compared to the monoculture () after 48 hours at all concentrations (0.5–200µg/cm2). This is the opposite of what was identified at 24 hours at 0.5, 1 and 10 µg/cm2, but it is consistent with the previously identified literature that investigated pro-inflammatory responses via ELISA and gene analysis (Endes et al. Citation2014; Skuland et al. Citation2020). At 72 hours post-exposure () this response mimics the 24 hour response (), with the IL-8 concentration higher, but the differences between the mono- and the co-culture reduced. The method of differentiation of THP-1 cells is known to up-regulate certain genes that have the potential to mask certain responses (Chanput, Mes, and Wichers Citation2014; Hetzel, Ackermann, and Lachmann Citation2021). The type of macrophage the THP-1 cells are differentiated to (M0, M1, and M2) also has the potential to enhance the various functional responses (Chanput, Mes, and Wichers Citation2014; Hetzel, Ackermann, and Lachmann Citation2021), and the macrophage type the THP-1s have been differentiated to (dependent on the PMA concentration used) and how sensitive they are to potential stimulation (Park et al. Citation2007). IL-8 is an important chemokine in macrophage and epithelial cell inflammatory responses. It has been previously established that IL-6 and the STAT3 pathway is required for the polarization of M0 to M2 type macrophages. When this pathway is inhibited, the polarization is toward M1 type macrophages (Yin et al. Citation2018). M2 macrophages are known to secrete a variety of different inflammatory mediators (including (but not limited to) TNF, IL-6 (creating a feedback loop), IL-1 and IL-10), while the M1 macrophage secretion profile is different (IL-12, IL-6, IL-8, G-CSF and IL-1β) (Martinez and Gordon Citation2014). It has also been identified that smaller nanotubes promote polarization to M2 when compared to the larger particles (Yunna et al. Citation2020) – again reducing the potential for IL-8 production. When a co-culture of A549 + THP-1 cells were exposed to cigarette smoke there were increases in the IL-6 secretion, but changes in the IL-8 secretion were undetectable (Holownia et al. Citation2016). Secretion of IL-8 by A549s is modulated by IFN-γ under the influence of IL-1β, however, IL-6 secretion is not affected by this modulation (Boost et al. Citation2008). Taken together, this would suggest that the secretion of IL-8 of the A549 cells could be being modulated by the polarization of the macrophage, and the secretion of inhibitory inflammatory mediators by both the A549 and the THP-1 cells.
Figure 5. 48 hours (left) and 72 hours (right) single exposure of DQ12 on both A549 monocultures, and A549 + dTHP-1 co-cultures. Cells were exposed to DQ12 for either 48 or 72 hours at an ALI, before analyzing various endpoints. IL-6 (A) and IL-8 (B) concentrations were measured in the basal compartment of the ALI culture after a single particle exposure (onto the apical side). N = 3 with all assays performed in triplicate. The data is presented as the mean ± Standard deviation. Significance is denoted as the following: compared to the medium control p < 0.01(*).
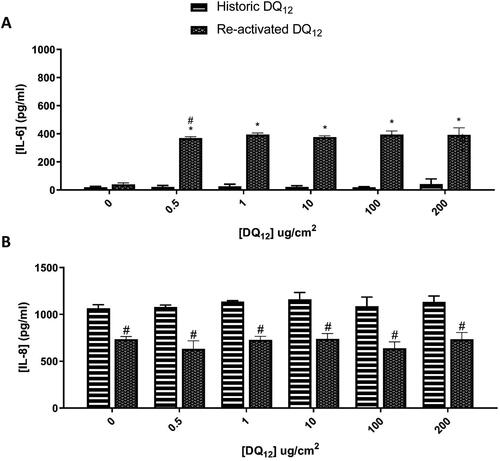
Due to the significant increase in IL-8 in the co-culture when compared to the monoculture 48 hours after historic DQ12, we went on to compare this to the re-activated DQ12 (). There was a significant (p < 0.01) increase in the IL-6 concentration at all re-activated DQ12 concentrations when compared to the medium control, which was not reflected after the historic DQ12 exposure. IL-8 basal concentration () was unchanged in either the historic or re-activated DQ12 exposures when compared to the medium control 48 hours post exposure. Both the IL-6 and IL-8 responses are consistent at both 24 hours () and 48 hours (). IL-8 is a specific neutrophil chemoattractant (Bickel Citation1993), whereas IL-6 is a much more diverse cytokine and its continual synthesis is known to play a role in chronic inflammation as well as tissue damage (Tanaka, Narazaki, and Kishimoto Citation2014). Both pro-inflammatory mediators are produced by both epithelial cells as well as macrophages (Smith et al. Citation2000; Rincon and Irvin Citation2012).
Figure 6. 48 hours single exposure of both Historic and Re-activated DQ12 on A549 + dTHP-1 co-cultures. Cells were exposed to DQ12 for 48 hours at an ALI, before analyzing various endpoints. IL-6 (A) and IL-8 (B) concentrations were measured in the basal compartment of the ALI culture after a single particle exposure (onto the apical side). N = 3 with all assays performed in triplicate. The data is presented as the mean ± Standard deviation. Significance is denoted as the following: compared to the medium control p < 0.01(*); compared to the Historic DQ12 p < 0.01(#).
Repeated exposures
The majority of literature on ENM exposures focuses on a single bolus dose, however in order to try and replicate a more “real-life” exposure situation, a fractionated exposure was also implemented with this model. Repeat exposures (fractionated exposures equating to the same concentration as the single exposures previously presented) of historic DQ12 over 48 and 72 hours (outlined in ), lead to significant increases in the concentration of IL-6 () and IL-8 () in the co-cultures when compared to the monoculture. There were however no significant differences when compared to the medium controls (except at the highest concentrations tested of 100 and 200 µg/cm2).
Figure 7. 48 hours (left) and 72 hours (right) repeat exposure of DQ12 on both A549 monocultures, and A549 + dTHP-1 co-cultures. Cells were exposed to DQ12 twice either over 48 or 72 hours at an ALI, before analyzing various endpoints. IL-6 (A) and IL-8 (B) concentrations were measured in the basal compartment of the ALI culture after the repeat particle exposure (onto the apical side). N = 3 with all assays performed in triplicate. The data is presented as the mean ± Standard deviation. Significance is denoted as the following: compared to the medium control p < 0.01(*).
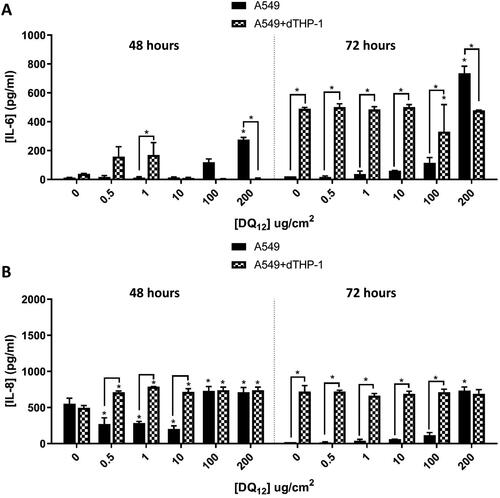
After 48 hours, the exposure produced the same pattern of IL-8 production regardless of the exposure approach (i.e. single vs. repeated) ( and ). However, there is a significant increase in IL-6 concentration after 1 µg/cm2 in the co-culture when compared to the monoculture (). This would coincide with the hypothesis above that IL-6 is the more appropriate marker of inflammation to continue to measure. The 72 hour single exposure does not illicit these responses and there are no changes in the IL-6 concentration at 72 hours (). This suggests that the fractionated exposure has the potential to continue to induce an IL-6 response (which is also not seen at 24 hours ()). This could be due to the fact the fractionated exposures are made up fresh every day of exposure, and although it is a 50% or 60% lower concentration per exposure (depending on the end time – either 48 (50%) or 72 hours (60%)) than the single exposure it is still capable of inducing a response. When a particle is suspended in medium its protein corona changes and therefore its potential toxicity may change (Liu, Tang, and Ding Citation2020). By “refreshing” the particles in the fractionated exposure, the protein corona has the potential to play a bigger role in the production of these pro-inflammatory mediators (Park et al. Citation2021), due to the surface reactivity of the ENM being refreshed every day. This difference has been identified in vivo using organic dust via intranasal instillation where the repeated exposure over 3 weeks induced the CD11b macrophages as well as the production of IL-6 when compared to the single exposure measured 3 weeks post exposure (Poole et al. Citation2012). These responses were not seen post-exposure to the re-activated DQ12 (), where there were no significant differences when compared to the control at either 48 or 72 hours.
No cytotoxicity was observed in A549 cells cultured in mono- or co-culture scenarios treated with historic DQ12 (10 µg/cm2) and TiO2 (10.4 µg/cm2) following 48 hour fractionated exposure (). There was an increase in the % of cytotoxicity seen after 48 hours when compared to the 24 hour exposure () which has also been identified previously in the literature (Gurr et al. Citation2005; Bhattacharya et al. Citation2009; Jugan et al. Citation2012). In the A549 monoculture treatments the CBMN assay demonstrated a significant (p < 0.05) 2.083% increase in micronucleus frequency in cells treated with TiO2 compared to the untreated control. A549 monocultures treated with DQ12 for 48 hours repeatedly did not demonstrate a significant increase in micronucleus frequency (p > 0.05). Comparatively within the co-culture scenario following 48 hour repeated exposure of TiO2, no significant increase in micronucleus frequency was observed. However, co-culture repeated treatment with DQ12 over 48 hours promoted a significant (p < 0.05) 2.04% increase in micronucleus frequency compared to the untreated control. There was an increase in chromosomal damage at the highest concentration of historic DQ12 (). This increase in an inflammatory response could be attributed to the theory of secondary genotoxicity and this response is consistent with the expected effect DQ12 would have on an immune cell type (Scherbart et al. Citation2011; Wiemann et al. Citation2016). This response has been replicated throughout the literature and it is commonly known that co-cultures are more sensitive, or their responses are enhanced by the addition of macrophages to a lung epithelial cell line (Sueki et al. Citation2014). Co-cultures were identified as being more sensitive to the pro-inflammatory responses elicited by TiO2 than the monocultures of A549 cells (Loret et al. Citation2016). This was however using a different exposure method (VitroCell instead of the quasi-ALI approach used herein). This was mimicked in our models – as we saw a significant increase in the IL-8 concentration in the co-cultures when compared to the monocultures (), but this was not replicated at the repeated 48 hour time point ().
Figure 8. Micronucleus frequency (%) 48 hour post a repeat exposure of TiO2 or DQ12 on both A549 monocultures, and A549 + dTHP-1 co-cultures. Cells were exposed to either TiO2 or DQ12 repeated for 48 hours at an ALI, before analyzing various endpoints. Both the monoculture (A) and the co-culture (B) were analyzed. For all CBMN assays, MMC (0.01 mg/ml) was used as a positive control. N = 3 with all assays performed in triplicate. The data is presented as the mean ± Standard deviation. Significance is denoted as the following: compared to the medium control p < 0.01(*).
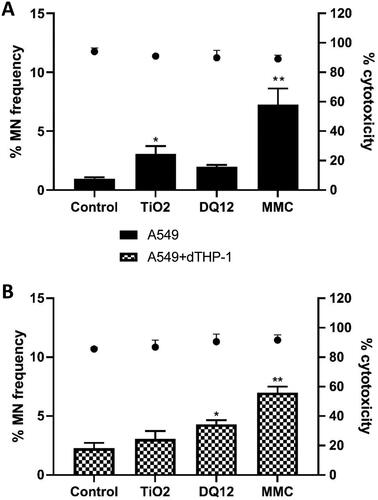
Figure 9. 48 hours repeat exposure of TiO2 (A and B) and BaSO4 (C and D) on both A549 monocultures, and A549 + dTHP-1 co-cultures. Cells were exposed to TiO2 and BaSO4 twice over 48 hours at an ALI, before analyzing various endpoints. IL-6 (A and C) and IL-8 (B and D) concentrations were measured in the basal compartment of the ALI culture after the repeat particle exposure (onto the apical side). N = 3 with all assays performed in triplicate. The data is presented as the mean ± Standard deviation. Significance is denoted as the following: compared to the medium control p < 0.01(*).
Monocultures vs co-cultures
Taken together () this indicates that the 24 hour single exposure and the 48 hour repeat exposure elicited the highest response in pro-inflammatory release for the more “advanced” co-culture (A549 + dTHP-1 model) using re-activated positive control particles. Subsequent to the previously described data sets, it was important to determine if such responses could be identified after exposure to engineered nanomaterials (ENMs), and if this model would therefore be suitable for ENM hazard assessment for a variety of materials. TiO2 and BaSO4 was investigated at these time points in the A549 mono- and co-cultures, since these particles are widely investigated, and further represent a key physico-chemical characteristic of ENMs; both are a non-soluble and soluble ENM.
Table 1. Table Summarizing responses of each particle 24, 48 and 72 hours post exposure to a single bolus dose and 48 and 72 hours post exposure to a fractionated exposure. Arrow indicates increase (↑), no change (↔) and the significance (p < 0.01) is indicated by *.
There was a significant increase in the IL-6 concentration () after exposure to TiO2 (100 and 200 µg/cm2) of the A549 monoculture when compared to the medium control and the co-culture. After 24 hours it has been identified that these particles have been internalized by A549 cells (Stearns, Paulauskis, and Godleski Citation2001), this could lead to this significant increase in IL-6 production. There were no changes in the concentration of IL-6 () after exposure to BaSO4 at any concentrations. IL-8 concentrations after both TiO2 and BaSO4 were increased in the monoculture when compared to the co-culture, however they were not significant (p > 0.05) when compared to the medium control.
BaSO4 has been shown in vivo to not induce as many inflammatory and oxidative stress related genes as other ENMs (specifically CeO2) (Schwotzer et al. Citation2018), as well as found to be non-toxic in vitro, especially when compared to various TiO2 ENMs under submerged conditions (Louro et al. Citation2019). This would suggest that this reduced concentration of IL-6 in this study is consistent with the literature. Where there is also no significant change (p > 0.05) in the IL-8 when compared to the medium control (), suggesting the background concentration for the monocultures may just be higher than the co-culture. Neither TiO2 nor BaSO4 induced significant increases in the inflammatory responses when compared to the DQ12 exposures. However, there was an increase in chromosomal damage in the A549 monoculture after TiO2 exposure which was not identified in the co-culture. There is a significant increase in IL-8 production between the co-culture and the monoculture () 24 hours post exposure. This could indicate that the macrophages are internalizing the TiO2 (Stringer and Kobzik Citation1996; Scherbart et al. Citation2011) within the co-culture, causing an increase in IL-8 production (compared to the monoculture, but not compared to the medium control) and therefore there is no increase in chromosomal damage in the co-culture after TiO2 exposure.
Conclusion
To conclude, implementation of a positive control needs to be carefully considered as exposure to DQ12 (historic and re-activated) suggests that the surface area changes are identified between the two particle types. Exposure method must also be considered when investigating the toxicity of any particulates, with a consideration of ALI exposures over submerged exposures being made (due to increased sensitivity and physiological relevance for in vitro lung cell cultures). The pro-inflammatory and genotoxic response of this (A549 + dTHP-1) alveolar model is particulate dependent. This is an important consideration when implementing these models as an early screening method of ENM toxicity (before or instead of in vivo exposures). This model could be used to compare and contrast to historic in vivo data completed with the same particulate exposure to determine their predictive capability further (Danielsen et al. Citation2020; Cosnier et al. Citation2021). For the positive control particles, we have identified the use of an A549 + dTHP-1 model using repeated exposures over 48 hours as the optimal model when establishing the potential pro-inflammatory responses in vitro due to the increase in the IL-6 concentrations identified. This model could be further advanced (using the addition of other immune and structural cells (such as dendritic and endothelial cells) and comparisons to in vivo exposures) to determine the predictive capacity of the in vivo response following ENM exposure.
Author contributions
KM participated in the study design, produced and analyzed the data for all ENM exposures as well as generating the figures for all data and drafted the manuscript itself. SJE generated the data for the Mn analysis and wrote that section of the manuscript. UV and LT provided particles, characterization and dosimetry data for the various particle types. SHD participated in the study design and data analysis. MC was the project leader; he was involved in planning the design of the study, has intellectually accompanied all experimental work, contributing to the analysis and interpretation of the data and has been involved in critically revising the manuscript. All authors read and approved the final manuscript.
Acknowledgments
The authors thank Carole Seidel, Laurent Gaté and Frédéric Cosnier from the French National Research and Safety Institute (INRS) for the gift of re-activated DQ12.
Disclosure statement
The authors declare no competing financial interests.
Additional information
Funding
References
- Albrecht, C., A. Becker, R. Schins, D. Höhr, K. Unfried, A. Knaapen, and P. Borm. 2002. “Importance of Surface Characteristics of Quartz DQ12 for Acute Inflammation.” Annals of Occupational Hygiene 46: 22–26.
- Albrecht, C., A. M. Knaapen, A. Becker, D. Höhr, P. Haberzettl, F. J. van Schooten, P. J. Borm, and R. P. Schins. 2005. “The Crucial Role of Particle Surface Reactivity in Respirable Quartz-Induced Reactive Oxygen/Nitrogen Species Formation and APE/Ref-1 Induction in Rat Lung.” Respiratory Research 6 (1): 129. doi:https://doi.org/10.1186/1465-9921-6-129.
- Alidousty, C., T. Baar, L. G. Martelotto, C. Heydt, S. Wagener, J. Fassunke, N. Duerbaum, et al. 2018. “Genetic Instability and Recurrent MYC Amplification in ALK-Translocated NSCLC: A Central Role of TP53 Mutations.” The Journal of Pathology 246 (1): 67–76. doi:https://doi.org/10.1002/path.5110.
- Barosova, H., K. Meldrum, B. B. Karakocak, S. Balog, S. H. Doak, A. Petri-Fink, M. J. D. Clift, and B. Rothen-Rutishauser. 2021. “Inter-Laboratory Variability of A549 Epithelial Cells Grown under Submerged and Air-Liquid Interface Conditions.” Toxicology in Vitro : An International Journal Published in Association with BIBRA 75: 105178. doi:https://doi.org/10.1016/j.tiv.2021.105178.
- Bérubé, K., Z. Prytherch, C. Job, and T. Hughes. 2010. “Human Primary Bronchial Lung Cell Constructs: The New Respiratory Models.” Toxicology 278 (3): 311–318. doi:https://doi.org/10.1016/j.tox.2010.04.004.
- Bessa, M. J., F. Brandão, M. Viana, J. F. Gomes, E. Monfort, F. R. Cassee, S. Fraga, and J. P. Teixeira. 2020. “Nanoparticle Exposure and Hazard in the Ceramic Industry: An Overview of Potential Sources, Toxicity and Health Effects.” Environmental Research 184: 109297. doi:https://doi.org/10.1016/j.envres.2020.109297.
- Bevan, R. J., R. Kreiling, L. S. Levy, and D. B. Warheit. 2018. “Toxicity Testing of Poorly Soluble Particles, Lung Overload and Lung Cancer.” Regulatory Toxicology and Pharmacology : RTP 100: 80–91. doi:https://doi.org/10.1016/j.yrtph.2018.10.006.
- Bhattacharya, K., M. Davoren, J. Boertz, R. P. Schins, E. Hoffmann, and E. Dopp. 2009. “Titanium Dioxide Nanoparticles Induce Oxidative Stress and DNA-Adduct Formation but Not DNA-Breakage in Human Lung Cells.” Particle and Fibre Toxicology 6 (1): 17. doi:https://doi.org/10.1186/1743-8977-6-17.
- Bhowmick, R., and H. Gappa-Fahlenkamp. 2016. “Cells and Culture Systems Used to Model the Small Airway Epithelium.” Lung 194 (3): 419–428. doi:https://doi.org/10.1007/s00408-016-9875-2.
- Bickel, M. 1993. “The Role of Interleukin-8 in Inflammation and Mechanisms of Regulation.” Journal of Periodontology 64 (5 Suppl): 456–460.
- Blank, F., B. M. Rothen-Rutishauser, S. Schurch, and P. Gehr. 2006. “An Optimized in Vitro Model of the Respiratory Tract Wall to Study Particle Cell Interactions.” Journal of Aerosol Medicine : The Official Journal of the International Society for Aerosols in Medicine 19 (3): 392–405. doi:https://doi.org/10.1089/jam.2006.19.392.
- Boggaram, V., D. S. Loose, K. R. Gottipati, K. Natarajan, and C. T. Mitchell. 2016. “Gene Expression Profiling of the Effects of Organic Dust in Lung Epithelial and THP-1 Cells Reveals Inductive Effects on Inflammatory and Immune Response Genes.” Physiological Genomics 48 (4): 281–289. doi:https://doi.org/10.1152/physiolgenomics.00096.2015.
- Boost, K. A., C. D. Sadik, M. Bachmann, B. Zwissler, J. Pfeilschifter, and H. Mühl. 2008. “IFN-Gamma Impairs Release of IL-8 by IL-1beta-Stimulated A549 Lung Carcinoma Cells.” BMC Cancer 8: 265. doi:https://doi.org/10.1186/1471-2407-8-265.
- Bruce, S. R., C. L. Atkins, G. N. Colasurdo, and J. L. Alcorn. 2009. “Respiratory Syncytial Virus Infection Alters Surfactant Protein a Expression in Human Pulmonary Epithelial Cells by Reducing Translation Efficiency.” American Journal of Physiology. Lung Cellular and Molecular Physiology 297 (4): L559–567. doi:https://doi.org/10.1152/ajplung.90507.2008.
- Burden, N., K. Aschberger, Q. Chaudhry, M. J. D. Clift, S. H. Doak, P. Fowler, H. Johnston, R. Landsiedel, J. Rowland, and V. Stone. 2017. “The 3Rs as a Framework to Support a 21st Century Approach for Nanosafety Assessment.” Nano Today. 12: 10–13. doi:https://doi.org/10.1016/j.nantod.2016.06.007.
- Burgum, M. J., M. J. D. Clift, S. J. Evans, N. Hondow, A. Tarat, G. J. Jenkins, and S. H. Doak. 2021. “Few-Layer Graphene Induces Both Primary and Secondary Genotoxicity in Epithelial Barrier Models in Vitro.” Journal of Nanobiotechnology 19 (1): 24. doi:https://doi.org/10.1186/s12951-021-00769-9.
- Cakmak, G. D., R. P. Schins, T. Shi, I. Fenoglio, B. Fubini, and P. J. Borm. 2004. “In Vitro Genotoxicity Assessment of Commercial Quartz Flours in Comparison to Standard DQ12 Quartz.” International Journal of Hygiene and Environmental Health 207 (2): 105–113. doi:https://doi.org/10.1078/1438-4639-00276.
- Chanput, W., J. J. Mes, and H. J. Wichers. 2014. “THP-1 Cell Line: An in Vitro Cell Model for Immune Modulation Approach.” International Immunopharmacology 23 (1): 37–45. doi:https://doi.org/10.1016/j.intimp.2014.08.002.
- Clift, M. J. D., G. J. S. Jenkins, and S. H. Doak. 2020. “An Alternative Perspective towards Reducing the Risk of Engineered Nanomaterials to Human Health.” Small 16 (36): 2002002. doi:https://doi.org/10.1002/smll.202002002.
- Clippinger, A. J., A. Ahluwalia, D. Allen, J. C. Bonner, W. Casey, V. Castranova, R. M. David, et al. 2016. “Expert Consensus on an in Vitro Approach to Assess Pulmonary Fibrogenic Potential of Aerosolized Nanomaterials.” Archives of Toxicology 90 (7): 1769–1783. doi:https://doi.org/10.1007/s00204-016-1717-8.
- Clouter, A., D. Brown, D. Höhr, P. Borm, and K. Donaldson. 2001. “Inflammatory Effects of Respirable Quartz Collected in Workplaces versus Standard DQ12 Quartz: Particle Surface Correlates.” Toxicological Sciences : An Official Journal of the Society of Toxicology 63 (1): 90–98. doi:https://doi.org/10.1093/toxsci/63.1.90.
- CELEX 2011. Commission Recommendation of 18 October on the definition of nanomaterial Text with EEA relevance. p. 38. https://eur-lex.europa.eu/legal-content/EN/TXT/?uri=CELEX:32011H0696
- Cosnier, F., C. Seidel, S. Valentino, O. Schmid, S. Bau, U. Vogel, J. Devoy, and L. Gaté. 2021. “Retained Particle Surface Area Dose Drives Inflammation in Rat Lungs following Acute, Subacute, and Subchronic Inhalation of Nanomaterials.” Particle and Fibre Toxicology 18 (1): 29. doi:https://doi.org/10.1186/s12989-021-00419-w.
- Crapo, J. D., B. E. Barry, P. Gehr, M. Bachofen, and E. R. Weibel. 1982. “Cell Number and Cell Characteristics of the Normal Human Lung.” The American Review of Respiratory Disease 126 (2): 332–337.
- Creutzenberg, O., T. Hansen, H. Ernst, H. Muhle, G. Oberdörster, and R. Hamilton. 2008. “Toxicity of a Quartz with Occluded Surfaces in a 90-Day Intratracheal Instillation Study in Rats.” Inhalation Toxicology 20 (11): 995–1008. doi:https://doi.org/10.1080/08958370802123903.
- Danielsen, P. H., K. B. Knudsen, J. Štrancar, P. Umek, T. Koklič, M. Garvas, E. Vanhala, et al. 2020. “Effects of Physicochemical Properties of TiO2 nanomaterials for pulmonary inflammation, acute phase response and alveolar proteinosis in intratracheally exposed mice.” Toxicology and Applied Pharmacology 386: 114830. doi:https://doi.org/10.1016/j.taap.2019.114830.
- Doak, S. H., B. Manshian, G. J. Jenkins, and N. Singh. 2012. “In Vitro Genotoxicity Testing Strategy for Nanomaterials and the Adaptation of Current OECD Guidelines.” Mutation Research 745 (1-2): 104–111. doi:https://doi.org/10.1016/j.mrgentox.2011.09.013.
- Dorrello, N. V., B. A. Guenthart, J. D. O'Neill, J. Kim, K. Cunningham, Y. W. Chen, M. Biscotti, et al. 2017. “Functional Vascularized Lung Grafts for Lung Bioengineering.” Science Advances 3 (8): e1700521.
- Duffin, R., L. Tran, A. Clouter, D. Brown, W. MacNee, V. Stone, and K. Donaldson. 2002. “The Importance of Surface Area and Specific Reactivity in the Acute Pulmonary Inflammatory Response to Particles.” Annals of Occupational Hygiene. 46: 242–245.
- Duffin, R., L. Tran, D. Brown, V. Stone, and K. Donaldson. 2007. “Proinflammogenic Effects of Low-Toxicity and Metal Nanoparticles in Vivo and in Vitro: highlighting the Role of Particle Surface Area and Surface Reactivity.” Inhalation Toxicology 19 (10): 849–856. doi:https://doi.org/10.1080/08958370701479323.
- Endes, C., O. Schmid, C. Kinnear, S. Mueller, S. Camarero-Espinosa, D. Vanhecke, E. J. Foster, et al. 2014. “An in Vitro Testing Strategy towards Mimicking the Inhalation of High Aspect Ratio Nanoparticles.” Particle and Fibre Toxicology 11 (1): 40. doi:https://doi.org/10.1186/s12989-014-0040-x.
- Evans, S. J., M. J. D. Clift, N. Singh, J. de Oliveira Mallia, M. Burgum, J. W. Wills, T. S. Wilkinson, G. J. S. Jenkins, and S. H. Doak. 2017. “Critical Review of the Current and Future Challenges Associated with Advanced in Vitro Systems towards the Study of Nanoparticle (Secondary) Genotoxicity.” Mutagenesis 32 (1): 233–241. doi:https://doi.org/10.1093/mutage/gew054.
- Evans, S. J., M. J. D. Clift, N. Singh, J. W. Wills, N. Hondow, T. S. Wilkinson, M. J. Burgum, A. P. Brown, G. J. Jenkins, and S. H. Doak. 2019. “In Vitro Detection of in Vitro Secondary Mechanisms of Genotoxicity Induced by Engineered Nanomaterials.” Particle and Fibre Toxicology 16 (1): 8. doi:https://doi.org/10.1186/s12989-019-0291-7.
- Geiser, M., and W. G. Kreyling. 2010. “Deposition and Biokinetics of Inhaled Nanoparticles.” Particle and Fibre Toxicology 7: 2. doi:https://doi.org/10.1186/1743-8977-7-2.
- Ghio, A. J., J. M. Soukup, J. Stonehuerner, H. Tong, J. Richards, M. I. Gilmour, M. C. Madden, Z. Shen, and S. P. Kantrow. 2019. “Quartz Disrupts Iron Homeostasis in Alveolar Macrophages to Impact a Pro-Inflammatory Effect.” Chemical Research in Toxicology 32 (9): 1737–1747. doi:https://doi.org/10.1021/acs.chemrestox.8b00301.
- Grande, F., and P. Tucci. 2016. “Titanium Dioxide Nanoparticles: A Risk for Human Health?” Mini Reviews in Medicinal Chemistry 16 (9): 762–769. doi:https://doi.org/10.2174/1389557516666160321114341.
- Griese, M. 1999. “Pulmonary Surfactant in Health and Human Lung Diseases: State of the Art.” The European Respiratory Journal 13 (6): 1455–1476. doi:https://doi.org/10.1183/09031936.99.13614779.
- Gurr, J. R., A. S. Wang, C. H. Chen, and K. Y. Jan. 2005. “Ultrafine Titanium Dioxide Particles in the Absence of Photoactivation Can Induce Oxidative Damage to Human Bronchial Epithelial Cells.” Toxicology 213 (1-2): 66–73. doi:https://doi.org/10.1016/j.tox.2005.05.007.
- Hackenberg, S., A. Scherzed, A. Technau, M. Kessler, K. Froelich, C. Ginzkey, C. Koehler, M. Burghartz, R. Hagen, and N. Kleinsasser. 2011. “Cytotoxic, Genotoxic and Pro-Inflammatory Effects of Zinc Oxide Nanoparticles in Human Nasal Mucosa Cells in Vitro.” Toxicology in Vitro 25 (3): 657–663. doi:https://doi.org/10.1016/j.tiv.2011.01.003.
- Hadrup, N., S. Bengtson, N. R. Jacobsen, P. Jackson, M. Nocun, A. T. Saber, K. A. Jensen, H. Wallin, and U. Vogel. 2017. “Influence of Dispersion Medium on Nanomaterial-Induced Pulmonary Inflammation and DNA Strand Breaks: investigation of Carbon Black, Carbon Nanotubes and Three Titanium Dioxide Nanoparticles.” Mutagenesis 32 (6): 581–597. doi:https://doi.org/10.1093/mutage/gex042.
- Hansjosten, I., J. Rapp, L. Reiner, R. Vatter, S. Fritsch-Decker, R. Peravali, T. Palosaari, et al. 2018. “Microscopy-Based High-Throughput Assays Enable Multi-Parametric Analysis to Assess Adverse Effects of Nanomaterials in Various Cell Lines.” Archives of Toxicology 92 (2): 633–649. doi:https://doi.org/10.1007/s00204-017-2106-7.
- Herzog, F., K. Loza, S. Balog, M. J. Clift, M. Epple, P. Gehr, A. Petri-Fink, and B. Rothen-Rutishauser. 2014. “Mimicking Exposures to Acute and Lifetime Concentrations of Inhaled Silver Nanoparticles by Two Different in Vitro Approaches.” Beilstein Journal of Nanotechnology 5: 1357–1370. doi:https://doi.org/10.3762/bjnano.5.149.
- Herzog, F., M. J. D. Clift, F. Piccapietra, R. Behra, O. Schmid, A. Petri-Fink, and B. Rothen-Rutishauser. 2013. “Exposure of Silver-Nanoparticles and Silver-Ions to Lung Cells in Vitro at the Air-Liquid Interface.” Particle and Fibre Toxicology 10: 11–11. doi:https://doi.org/10.1186/1743-8977-10-11.
- Hetzel, M., M. Ackermann, and N. Lachmann. 2021. “Beyond "Big Eaters": the Versatile Role of Alveolar Macrophages in Health and Disease.” International Journal of Molecular Sciences 22 (7): 3308.
- Hiemstra, P. S., G. Grootaers, A. M. van der Does, C. A. M. Krul, and I. M. Kooter. 2018. “Human Lung Epithelial Cell Cultures for Analysis of Inhaled Toxicants: Lessons Learned and Future Directions.” Toxicology in Vitro 47: 137–146. doi:https://doi.org/10.1016/j.tiv.2017.11.005.
- Hilton, G., H. Barosova, A. Petri-Fink, B. Rothen-Rutishauser, and M. Bereman. 2019. “Toxicology in Vitro Leveraging Proteomics to Compare Submerged versus Air-Liquid Interface Carbon Nanotube Exposure to a 3d Lung Cell Model.” Toxicology in Vitro : An International Journal Published in Association with BIBRA 54 (August 2018): 58–66. doi:https://doi.org/10.1016/j.tiv.2018.09.010.
- Holownia, A., P. Wielgat, E. Rysiak, and J. J. Braszko. 2016. “Intracellular and Extracellular Cytokines in A549 Cells and THP1 Cells Exposed to Cigarette Smoke.” Advances in Experimental Medicine and Biology 910: 39–45.
- Housley, D. G., K. A. Bérubé, T. P. Jones, S. Anderson, F. D. Pooley, and R. J. Richards. 2002. “Pulmonary Epithelial Response in the Rat Lung to Instilled Montserrat Respirable Dusts and Their Major Mineral Components.” Occupational and Environmental Medicine 59 (7): 466–472. doi:https://doi.org/10.1136/oem.59.7.466.
- Jiang, B., A. E. Kauffman, L. Li, W. McFee, B. Cai, J. Weinstein, J. R. Lead, S. Chatterjee, G. I. Scott, and S. Xiao. 2020. “Health Impacts of Environmental Contamination of Micro- and Nanoplastics: A Review.” Environmental Health and Preventive Medicine 25 (1): 29. doi:https://doi.org/10.1186/s12199-020-00870-9.
- Joubert, A. I., M. Geppert, L. Johnson, R. Mills-Goodlet, S. Michelini, E. Korotchenko, A. Duschl, R. Weiss, J. Horejs-Höck, and M. Himly. 2020. “Mechanisms of Particles in Sensitization, Effector Function and Therapy of Allergic Disease.” Frontiers in Immunology 11: 1334. doi:https://doi.org/10.3389/fimmu.2020.01334.
- Jugan, M. L., S. Barillet, A. Simon-Deckers, N. Herlin-Boime, S. Sauvaigo, T. Douki, and M. Carriere. 2012. “Titanium Dioxide Nanoparticles Exhibit Genotoxicity and Impair DNA Repair Activity in A549 Cells.” Nanotoxicology 6 (5): 501–513. doi:https://doi.org/10.3109/17435390.2011.587903.
- Kasper, J. Y., M. I. Hermanns, R. E. Unger, and C. J. Kirkpatrick. 2017. “A Responsive Human Triple-Culture Model of the Air-Blood Barrier: incorporation of Different Macrophage Phenotypes.” Journal of Tissue Engineering and Regenerative Medicine 11 (4): 1285–1297. doi:https://doi.org/10.1002/term.2032.
- Kaur, G., and J. M. Dufour. 2012. “Cell Lines: Valuable Tools or Useless Artifacts.” Spermatogenesis 2 (1): 1–5. doi:https://doi.org/10.4161/spmg.19885.
- Keller, J. G., U. M. Graham, J. Koltermann-Jülly, R. Gelein, L. Ma-Hock, R. Landsiedel, M. Wiemann, G. Oberdörster, A. Elder, and W. Wohlleben. 2020. “Predicting Dissolution and Transformation of Inhaled Nanoparticles in the Lung Using Abiotic Flow Cells: The Case of Barium Sulfate.” Scientific Reports 10 (1): 458. doi:https://doi.org/10.1038/s41598-019-56872-3.
- Klein, S. G., T. Serchi, L. Hoffmann, B. Blömeke, and A. C. Gutleb. 2013. “An Improved 3D Tetraculture System Mimicking the Cellular Organisation at the Alveolar Barrier to Study the Potential Toxic Effects of Particles on the Lung.” Particle and Fibre Toxicology 10: 31. doi:https://doi.org/10.1186/1743-8977-10-31.
- Kumar, V., N. Sharma, and S. S. Maitra. 2017. “In Vitro and in Vivo Toxicity Assessment of Nanoparticles.” International Nano Letters 7 (4): 243–256. doi:https://doi.org/10.1007/s40089-017-0221-3.
- Lacroix, G., W. Koch, D. Ritter, A. C. Gutleb, S. T. Larsen, T. Loret, F. Zanetti, et al. 2018. “ Air-Liquid Interface In Vitro Models for Respiratory Toxicology Research: Consensus Workshop and Recommendations.” Applied in Vitro Toxicology 4 (2): 91–106. doi:https://doi.org/10.1089/aivt.2017.0034.
- Lenz, A. G., E. Karg, E. Brendel, H. Hinze-Heyn, K. L. Maier, O. Eickelberg, T. Stoeger, and O. Schmid. 2013. “Inflammatory and Oxidative Stress Responses of an Alveolar Epithelial Cell Line to Airborne Zinc Oxide Nanoparticles at the Air-Liquid Interface: A Comparison with Conventional, Submerged Cell-Culture Conditions.” BioMed Research International 2013: 1–12. doi:https://doi.org/10.1155/2013/652632.
- Lesniak, A., F. Fenaroli, M. P. Monopoli, C. Åberg, K. A. Dawson, and A. Salvati. 2012. “Effects of the Presence or Absence of a Protein Corona on Silica Nanoparticle Uptake and Impact on Cells.” ACS Nano 6 (7): 5845–5857. doi:https://doi.org/10.1021/nn300223w.
- Liu, N., M. Tang, and J. Ding. 2020. “The Interaction between Nanoparticles-Protein Corona Complex and Cells and Its Toxic Effect on Cells.” Chemosphere 245: 125624. doi:https://doi.org/10.1016/j.chemosphere.2019.125624.
- Liu, T., and S. Liu. 2020. “The Impacts of Coal Dust on Miners' Health: A Review.” Environmental Research 190: 109849. doi:https://doi.org/10.1016/j.envres.2020.109849.
- Loret, T., E. Peyret, M. Dubreuil, O. Aguerre-Chariol, C. Bressot, O. Le Bihan, T. Amodeo, et al. 2016. “Air-Liquid Interface Exposure to Aerosols of Poorly Soluble Nanomaterials Induces Different Biological Activation Levels Compared to Exposure to Suspensions.” Particle and Fibre Toxicology 13 (1): 58–58. doi:https://doi.org/10.1186/s12989-016-0171-3.
- Louro, H., A. Saruga, J. Santos, M. Pinhão, and M. J. Silva. 2019. “Biological Impact of Metal Nanomaterials in Relation to Their Physicochemical Characteristics.” Toxicology in Vitro 56: 172–183. doi:https://doi.org/10.1016/j.tiv.2019.01.018.
- Lujan, H., M. F. Criscitiello, A. S. Hering, and C. M. Sayes. 2019. “Refining in Vitro Toxicity Models: Comparing Baseline Characteristics of Lung Cell Types.” Toxicological Sciences 168 (2): 302–314. doi:https://doi.org/10.1093/toxsci/kfz001.
- Ma, Q. 2020. “Polarization of Immune Cells in the Pathologic Response to Inhaled Particulates.” Frontiers in Immunology 11: 1060. doi:https://doi.org/10.3389/fimmu.2020.01060.
- Mahmoudi, M., M. P. Monopoli, M. Rezaei, I. Lynch, F. Bertoli, J. J. McManus, and K. A. Dawson. 2013. “The Protein Corona Mediates the Impact of Nanomaterials and Slows Amyloid Beta Fibrillation.” Chembiochem : A European Journal of Chemical Biology 14 (5): 568–572. doi:https://doi.org/10.1002/cbic.201300007.
- Manshian, B. B., N. Singh, and S. H. Doak. 2013. “The in Vitro Micronucleus Assay and Kinetochore Staining: Methodology and Criteria for the Accurate Assessment of Genotoxicity and Cytotoxicity.” In Genotoxicity Assessment: Methods and Protocols, edited by A. Dhawan, M. Bajpayee, 269–289. Totowa, NJ, Humana Press.
- Martinez, F. O., and S. Gordon. 2014. “The M1 and M2 Paradigm of Macrophage Activation: time for Reassessment.” F1000prime Reports 6: 13–13. doi:https://doi.org/10.12703/P6-13.
- Oberdorster, G., E. Oberdorster, and J. Oberdorster. 2005. “Nanotoxicology: An Emerging Discipline Evolving from Studies of Ultrafine Particles.” Environmental Health Perspectives. 113 (7): 823–839.
- OECD 2018. Guidance Document on Good In Vitro Method Practices (GIVIMP).
- Öhlinger, K., T. Kolesnik, C. Meindl, B. Gallé, M. Absenger-Novak, D. Kolb-Lenz, and E. Fröhlich. 2019. “Air-Liquid Interface Culture Changes Surface Properties of A549 Cells.” Toxicology in Vitro : An International Journal Published in Association with BIBRA 60: 369–382. doi:https://doi.org/10.1016/j.tiv.2019.06.014.
- Ohshima, S., Y. Xu, and M. Takahama. 1998. “Effects of Uranium Ore Dust on Cultured Human Lung Cells.” Environmental Toxicology and Pharmacology 5 (4): 267–271. doi:https://doi.org/10.1016/S1382-6689(98)00010-6.
- Park, E. K., H. S. Jung, H. I. Yang, M. C. Yoo, C. Kim, and K. S. Kim. 2007. “Optimized THP-1 Differentiation is Required for the Detection of Responses to Weak Stimuli.” Inflammation Research 56 (1): 45–50. doi:https://doi.org/10.1007/s00011-007-6115-5.
- Park, J. Y., S. J. Park, J. Y. Park, S. H. Kim, S. Kwon, Y. Jung, and D. Khang. 2021. “Unfolded Protein Corona Surrounding Nanotubes Influence the Innate and Adaptive Immune System.” Advanced Science 8 (8): 2004979. doi:https://doi.org/10.1002/advs.202004979.
- Poole, J. A., A. M. Gleason, C. Bauer, W. W. West, N. Alexis, N. van Rooijen, S. J. Reynolds, D. J. Romberger, and T. L. Kielian. 2012. “CD11c(+)/CD11b(+) Cells Are Critical for Organic Dust-Elicited Murine Lung Inflammation.” American Journal of Respiratory Cell and Molecular Biology 47 (5): 652–659. doi:https://doi.org/10.1165/rcmb.2012-0095OC.
- Rincon, M., and C. G. Irvin. 2012. “Role of IL-6 in Asthma and Other Inflammatory Pulmonary Diseases.” International Journal of Biological Sciences 8 (9): 1281–1290. doi:https://doi.org/10.7150/ijbs.4874.
- Robock, K. 1973. “Standard Quartz dq12 Greater than 5 Micro m for Experimental Pneumoconiosis Research Projects in the Federal Republic of Germany.” The Annals of Occupational Hygiene 16 (1): 63–66.
- Roursgaard, M., K. A. Jensen, S. S. Poulsen, N. E. Jensen, L. K. Poulsen, M. Hammer, G. D. Nielsen, and S. T. Larsen. 2011. “Acute and Subchronic Airway Inflammation after Intratracheal Instillation of Quartz and Titanium Dioxide Agglomerates in Mice.” TheScientificWorldJournal 11: 801–825. doi:https://doi.org/10.1100/tsw.2011.67.
- Scherbart, A. M., J. Langer, A. Bushmelev, D. van Berlo, P. Haberzettl, F. J. van Schooten, A. M. Schmidt, C. R. Rose, R. P. Schins, and C. Albrecht. 2011. “Contrasting Macrophage Activation by Fine and Ultrafine Titanium Dioxide Particles is Associated with Different Uptake Mechanisms.” Particle and Fibre Toxicology 8: 31. doi:https://doi.org/10.1186/1743-8977-8-31.
- Schins, R. P. F., A. M. Knaapen, G. D. Cakmak, T. Shi, C. Weishaupt, and P. J. A. Borm. 2002a. “Oxidant-Induced DNA Damage by Quartz in Alveolar Epithelial Cells.” Mutation Research/Genetic Toxicology and Environmental Mutagenesis 517 (1-2): 77–86. doi:https://doi.org/10.1016/S1383-5718(02)00039-6.
- Schins, R. P. F., R. Duffin, D. Höhr, A. M. Knaapen, T. Shi, C. Weishaupt, V. Stone, K. Donaldson, and P. J. A. Borm. 2002b. “Surface Modification of Quartz Inhibits Toxicity, Particle Uptake, and Oxidative DNA Damage in Human Lung Epithelial Cells.” Chemical Research in Toxicology 15 (9): 1166–1173. doi:https://doi.org/10.1021/tx025558u.
- Schwotzer, D., M. Niehof, D. Schaudien, H. Kock, T. Hansen, C. Dasenbrock, and O. Creutzenberg. 2018. “Cerium Oxide and Barium Sulfate Nanoparticle Inhalation Affects Gene Expression in Alveolar Epithelial Cells Type II.” Journal of Nanobiotechnology 16 (1): 16. doi:https://doi.org/10.1186/s12951-018-0343-4.
- Singh, N., G. J. Jenkins, B. C. Nelson, B. J. Marquis, T. G. Maffeis, A. P. Brown, P. M. Williams, C. J. Wright, and S. H. Doak. 2012. “The Role of Iron Redox State in the Genotoxicity of Ultrafine Superparamagnetic Iron Oxide Nanoparticles.” Biomaterials 33 (1): 163–170. doi:https://doi.org/10.1016/j.biomaterials.2011.09.087.
- Skuland, T., M. Låg, A. C. Gutleb, B. C. Brinchmann, T. Serchi, J. Øvrevik, J. A. Holme, and M. Refsnes. 2020. “Pro-Inflammatory Effects of Crystalline- and Nano-Sized Non-Crystalline Silica Particles in a 3D Alveolar Model.” Particle and Fibre Toxicology 17 (1): 13–13. doi:https://doi.org/10.1186/s12989-020-00345-3.
- Smith, D. K. 1998. “Opal, Cristobalite, and Tridymite: Noncrystallinity versus Crystallinity, Nomenclature of the Silica Minerals and Bibliography.” Powder Diffraction 13 (1): 2–19. doi:https://doi.org/10.1017/S0885715600009696.
- Smith, K. R., J. M. Veranth, A. A. Hu, J. S. Lighty, and A. E. Aust. 2000. “Interleukin-8 Levels in Human Lung Epithelial Cells Are Increased in Response to Coal Fly Ash and Vary with the Bioavailability of Iron, as a Function of Particle Size and Source of Coal.” Chemical Research in Toxicology 13 (2): 118–125. doi:https://doi.org/10.1021/tx9901736.
- Stearns, R. C., J. D. Paulauskis, and J. J. Godleski. 2001. “Endocytosis of Ultrafine Particles by A549 Cells.” American Journal of Respiratory Cell and Molecular Biology 24 (2): 108–115. doi:https://doi.org/10.1165/ajrcmb.24.2.4081.
- Stone, V., M. R. Miller, M. J. D. Clift, A. Elder, N. L. Mills, P. Møller, R. P. F. Schins, et al. 2017. “Nanomaterials versus Ambient Ultrafine Particles: An Opportunity to Exchange Toxicology Knowledge.” Environmental Health Perspectives 125 (10): 106002. doi:https://doi.org/10.1289/EHP424.
- Stringer, B., and L. Kobzik. 1996. “Alveolar Macrophage Uptake of the Environmental Particulate Titanium Dioxide: role of Surfactant Components.” American Journal of Respiratory Cell and Molecular Biology 14 (2): 155–160. doi:https://doi.org/10.1165/ajrcmb.14.2.8630265.
- Sueki, A., K. Matsuda, C. Iwashita, C. Taira, N. Ishimine, S. Shigeto, K. Kawasaki, M. Sugano, H. Yamamoto, and T. Honda. 2014. “Epithelial-Mesenchymal Transition of A549 Cells is Enhanced by co-Cultured with THP-1 Macrophages under Hypoxic Conditions.” Biochemical and Biophysical Research Communications 453 (4): 804–809. doi:https://doi.org/10.1016/j.bbrc.2014.10.022.
- Tanaka, T.,. M. Narazaki, and T. Kishimoto. 2014. “IL-6 in Inflammation, Immunity, and Disease.” Cold Spring Harbor Perspectives in Biology 6 (10): a016295–a016295. doi:https://doi.org/10.1101/cshperspect.a016295.
- Upadhyay, S., and L. Palmberg. 2018. “Air-Liquid Interface: Relevant in Vitro Models for Investigating Air Pollutant-Induced Pulmonary Toxicity.” Toxicological Sciences : An Official Journal of the Society of Toxicology 164 (1): 21–30. doi:https://doi.org/10.1093/toxsci/kfy053.
- Vuong, N. Q., D. Breznan, P. Goegan, J. S. O'Brien, A. Williams, S. Karthikeyan, P. Kumarathasan, and R. Vincent. 2017. “In Vitro Toxicoproteomic Analysis of A549 Human Lung Epithelial Cells Exposed to Urban Air Particulate Matter and Its Water-Soluble and Insoluble Fractions.” Particle and Fibre Toxicology 14 (1): 39. doi:https://doi.org/10.1186/s12989-017-0220-6.
- Wan, S., P. M. Kelly, E. Mahon, H. Stöckmann, P. M. Rudd, F. Caruso, K. A. Dawson, Y. Yan, and M. P. Monopoli. 2015. “The "Sweet" Side of the Protein Corona: Effects of Glycosylation on Nanoparticle-Cell Interactions.” ACS Nano 9 (2): 2157–2166. doi:https://doi.org/10.1021/nn506060q.
- Wang, Z., and M. Tang. 2021. “Research Progress on Toxicity, Function, and Mechanism of Metal Oxide Nanoparticles on Vascular Endothelial Cells.” Journal of Applied Toxicology : JAT 41 (5): 683–700. doi:https://doi.org/10.1002/jat.4121.
- Warheit, D. B., and S. C. Brown. 2019. “What is the Impact of Surface Modifications and Particle Size on Commercial Titanium Dioxide Particle Samples? - a Review of in Vivo Pulmonary and Oral Toxicity studies - Revised 11-6-2018.” Toxicology Letters 302: 42–59. doi:https://doi.org/10.1016/j.toxlet.2018.11.008.
- Wiemann, M., A. Vennemann, U. G. Sauer, K. Wiench, L. Ma-Hock, and R. Landsiedel. 2016. “An in Vitro Alveolar Macrophage Assay for Predicting the Short-Term Inhalation Toxicity of Nanomaterials.” Journal of Nanobiotechnology 14 (1): 16. doi:https://doi.org/10.1186/s12951-016-0164-2.
- Wolf, J., S. Rose-John, and C. Garbers. 2014. “Interleukin-6 and Its Receptors: A Highly Regulated and Dynamic System.” Cytokine 70 (1): 11–20. doi:https://doi.org/10.1016/j.cyto.2014.05.024.
- Yin, Z., T. Ma, Y. Lin, X. Lu, C. Zhang, S. Chen, and Z. Jian. 2018. “IL-6/STAT3 Pathway Intermediates M1/M2 Macrophage Polarization during the Development of Hepatocellular Carcinoma.” Journal of Cellular Biochemistry 119 (11): 9419–9432. doi:https://doi.org/10.1002/jcb.27259.
- Yokel, R. A., and R. C. Macphail. 2011. “Engineered Nanomaterials: exposures, Hazards, and Risk Prevention.” Journal of Occupational Medicine and Toxicology (London, England) 6: 7–7. doi:https://doi.org/10.1186/1745-6673-6-7.
- Yunna, C., H. Mengru, W. Lei, and C. Weidong. 2020. “Macrophage M1/M2 Polarization.” European Journal of Pharmacology 877: 173090. doi:https://doi.org/10.1016/j.ejphar.2020.173090.
- Zhang, Y., D. Darland, Y. He, L. Yang, X. Dong, and Y. Chang. 2018. “Reduction of Pm2.5 Toxicity on Human Alveolar Epithelial Cells A549 by Tea Polyphenols.” Journal of Food Biochemistry 42 (3): e12496. doi:https://doi.org/10.1111/jfbc.12496.