
 ?Mathematical formulae have been encoded as MathML and are displayed in this HTML version using MathJax in order to improve their display. Uncheck the box to turn MathJax off. This feature requires Javascript. Click on a formula to zoom.
Abstract
This manuscript proposes a methodology to assess the completeness and quality of physicochemical and hazard datasets for risk assessment purposes. The approach is also specifically applicable to similarity assessment as a basis for grouping of (nanoforms of) chemical substances as well as for classification of the substances according to the Classification, Labeling and Packaging regulation. The unique goal of this approach is to assess data quality in such a way that all the steps are automatized, thus reducing reliance on expert judgment. The analysis starts from available (meta)data as provided in the data entry templates developed by the NanoSafety community and used for import into the eNanoMapper database. The methodology is implemented in the templates as a traffic light system—the providers of the data can see in real time the completeness scores calculated by the system for their datasets in green, yellow, or red. This is an interactive feedback feature that is intended to provide an incentive for anyone inserting data into the database to deliver more complete and higher quality datasets. The users of the data can also see this information both in the data entry templates and on the database interface, which enables them to select better datasets for their assessments. The proposed methodology has been partially implemented in the eNanoMapper database and in a Weight of Evidence approach for the regulatory classification of nanomaterials. It was fully implemented in a publicly available online R tool.
1. Introduction
Using high-quality data is essential for the robust and reliable risk assessment of chemical substances, including engineered nanomaterials (NMs) (Marchese Robinson et al. Citation2016). It is indeed fundamental for risk assessors to be aware of the quality of the datasets that they use and of the degree of completeness of the (meta)data in respect to the minimum regulatory requirements and the state-of-the-art scientific knowledge. The use of data with insufficient quality and/or of incomplete data may result in risk assessment outcomes, which are too uncertain to adequately support regulatory or risk management decision making. Using high-quality data is also essential for making scientifically justified decisions related to the grouping of substances as a basis for read-across of information for purposes ranging from safe-by-design to regulatory risk assessment and management (ECHA Citation2017a; Loosli et al. Citation2022). Specifically, using high-quality data for similarity assessment is as an important prerequisite for well-substantiated grouping decisions (Jeliazkova et al. Citation2022; Seleci et al. Citation2022; Tsiliki et al. Citation2022; Zabeo et al. Citation2022). Similarly, the classification of substances according to the Classification, Labeling and Packaging (CLP) regulation (European Parliament and Council Citation2008) requires robust physicochemical and (eco)toxicity datasets thoroughly assessed for their quality and completeness (ECHA Citation2017a).
The evaluation of data quality is not only required for risk assessment but also for underlying tasks such as predictive modeling of properties, (eco)toxicity (Basei et al. Citation2019; Furxhi et al. Citation2020a, Citation2020b), toxicokinetics, toxicogenomics (Saarimäki et al. Citation2021), and exposure (Furxhi et al. Citation2021). Generic definitions for data completeness and data quality, which are now agreed upon by the nanosafety community, were provided by Marchese Robinson et al. (Citation2016), namely: data completeness is a measure of the availability of the necessary, non-redundant (meta)data for a given entity, e.g. an NM or a set of NMs, while data quality is a measure of the potential usefulness, clarity and correctness of data and datasets.
Several approaches have been proposed to assess the quality (Klimisch et al. Citation1997; Card and Magnuson Citation2010; Lubinski et al. Citation2013; Hristozov et al. Citation2014; Moermond et al. Citation2016; Hartmann et al. Citation2017; Fernández-Cruz et al. Citation2018; Krug et al. Citation2018) and completeness (Comandella et al. Citation2020) of nanospecific datasets, many of which are based on the methodology proposed by Klimisch et al. in 1997 (Klimisch et al. Citation1997). However, none of those approaches is capable of automatically (i.e. programmatically) assessing data completeness/quality, as all of them almost exclusively rely on expert judgment. This makes them less suitable to be implemented into the current and emerging nanosafety databases (such as NanoSafety Data Interface https://search.data.enanomapper.net based on eNanoMapper database (Jeliazkova et al. Citation2021)) as well as into risk assessment and management software tools, such as SUNDS (Hristozov et al. Citation2018; Pizzol et al. Citation2019; Cazzagon et al. Citation2022), to enable seamless data quality and completeness analysis and communication.
To fill this gap, we propose a novel methodology to facilitate automated assessment of quality and completeness for sets of nanospecific physicochemical and (eco)toxicity (meta) data. The purpose of this approach is to support regulatory risk assessment, but it is also applicable to other related tasks such as similarity assessment and grouping, as well as to the classification of nanomaterials according to the CLP regulation (European Parliament and Council Citation2008). The goal of this approach is to define data quality and completeness scores and enable their computation in such a way that all the steps are automatized, thus reducing as much as possible the need of expert judgment. This is done starting from the GRACIOUS/NANoREG templates (Totaro et al. Citation2017; Gottardo et al. Citation2019) used to collect data in a structured way for input into the eNanoMapper database. The average of the computed scores for the templates comprising a dataset represent the overall quality and completeness scores for the particular dataset. Based on the calculated scores, a ‘traffic light’ indicator is assigned to each template/dataset: i.e. green, yellow or red. These colors can be displayed in real time both in the web browser when assessing the NanoSafety Data Interface and when downloading the results in the format of data reporting templates. This on one hand could serve as an incentive for data providers to insert more complete and higher quality data in the database, while on the other hand it can guide risk assessors in the selection of better datasets.
Our methodology has been partially implemented in the eNanoMapper database to enable real-time analysis of the completeness of each dataset that is included in it, as well as in a Weight of Evidence (WoE) approach for CLP classification of NMs (Basei et al. Citation2021). The methodology is also available as an online R tool (https://shinyapps.greendecision.eu/apps/gracious-data-quality), which was designed specifically to be interoperable with eNanoMapper as well as with other software tools, including decision support systems for risk assessment and management of NMs and other chemicals such as SUNDS (https://sunds.gd).
This article is structured as follows. In Section 2, the steps taken to develop the data completeness and quality assessment methodology are described. This includes (1) a literature review to identify other existing methods to learn from and the most relevant criteria to consider as a basis for our approach, and (2) results from a stakeholder workshop which was organized in June 2021 to discuss our methodology and collect constructive feedback from its potential users (>80 participants) on how to improve it. The results of the literature review are summarized in Section 3. The same section also describes in detail the proposed data completeness and quality assessment methodology and its implementation in the eNanoMapper database and as the online R tool. Moreover, the results of applying the methodology to a case study of silver nanoparticles (i.e., JRCNM03000a, NM-300K, Ag 16.7 nm) are presented. Finally, Section 4 discusses the strengths and limitations of the proposed approach and outlines the next steps for its further development and implementation.
2. Materials and methods
2.1. Literature review on existing data quality criteria
To develop this methodology, we first performed a literature review to identify the most suitable criteria to assess the quality and completeness of nanosafety (meta)data. Based on the review, we created an inventory of criteria as well as relevant tools and methodologies (GRACIOUS deliverable 6.1: Requirements for data quality criteria, data sources, modelling tools and terminology Citation2021) to operationalize those. This inventory was regularly updated in a period of 36 months to include any new approaches as they became available.
Then, we selected from the collected approaches the ones that address the criteria for evaluation of the quality of data to be used for safety assessment of chemicals (including nanomaterials), as defined in the European Chemical Agency’s (ECHA) guidance on Information Requirements and Chemical Safety Assessment (IR&CSA) (ECHA Citation2011).
Such criteria are as follows:
Data completeness refers to the degree to which all required (meta)data in a data set is available.
Data relevance measures if a study was conducted using agreed (standard) protocols/procedures.
Data reliability measures if a study was conducted in a reliable manner.
Data adequacy defines the usefulness of the data for risk assessment purposes.
These approaches are reported in Section 3.1, and we used them as a basis to develop our methodology in co-creation with stakeholders from industry, regulation, and academia via a dedicated workshop (cf. Section 2.2). Our approach automatically (i.e. programmatically) assigns a score related to each of the four criteria starting from the available (meta)data (cf. Section 2.3), as it is described in detail in Section 3.2.
2.2. Workshop with stakeholders
On 28 of June 2021, a ‘virtual’ workshopFootnote1 was organized in the frame of the EU H2020 Gov4Nano and GRACIOUS projects. The goal was to collect feedback from stakeholders on the robustness of the proposed approach for assessment of data quality and completeness. The discussion topics of the workshop ranged from the conceptual basis of the methodology, through its mathematical representation, to the specifics of its implementation in the GRACIOUS/NANoREG harmonized data reporting templates (cf. Section 2.3) and as part of the eNanoMapper database to enable real-time analysis of each dataset that is included in it.
The workshop was open to data experts and risk assessors from industry, regulation, and academia. More than 80 participants, mainly from Europe, attended the workshop. To collect stakeholders’ feedback, 16 questions related to each aspect of the methodology were asked to the audience by using Slido.Footnote2 These questions and the results of the workshop are reported in Section S1 of the Supplemental Information (SI). The results were used as starting point for improving and further refining our methodology.
2.3. NANoREG data reporting templates
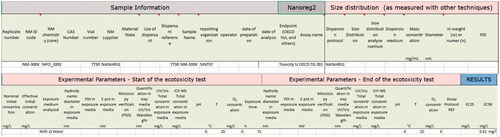
The methodology is based on the evaluation of quality and completeness of data included in the eNanoMapper database by means of the harmonized data reporting templates introduced by the NANoREG (Totaro et al. Citation2017) project and further advanced in the GRACIOUS project (Gottardo et al. Citation2019). These templates are in fact an extension of OECDFootnote3 data reporting templates. An example of such a data entry template is presented in .
Figure 1. Example of data reporting template for an ecotoxicological study, partially filled with information related to a specific study.
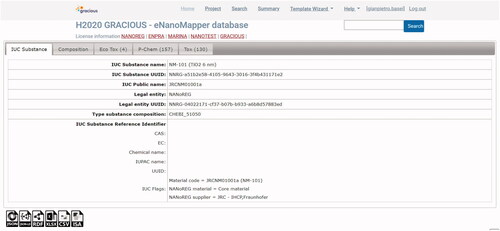
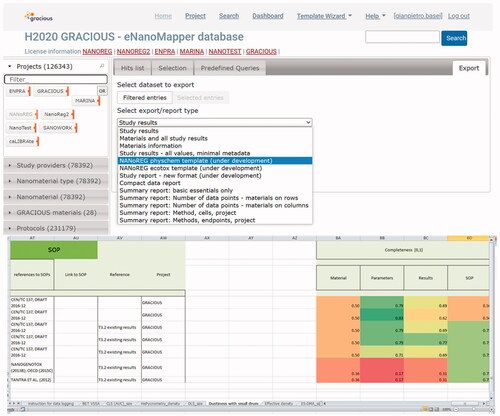
The information provided in the data entry templates is submitted to the FAIRification workflow (Jeliazkova et al. Citation2021) developed for the eNanoMapper database during the data integration activities across several nanosafety projects and recently described in Kochev et al. (Citation2020). Once in the eNanoMapper database, the data is available via an Application Programming Interface (API)Footnote4 and can be exported or visualized in the eNanoMapper user interface as illustrated in . In this example, the data on NM-101 include results from four ecotoxicity studies, 157 physicochemical experiments and 130 toxicological studies.
Figure 2. Details and studies for a particular material (here TiO2) in the eNanoMapper database. For this particular NM, data related to ecotoxicological studies (4 studies), physicochemical studies (157 studies) and toxicological studies (130 studies) are available. Data is structured according to the eNanoMapper data model (Jeliazkova et al. Citation2015; Kochev et al. Citation2020).
Specifically, the properties and (eco)toxicological results for the NMs are listed under the following tabs:
P-Chem, which includes results related to physicochemical characterization.
Eco Tox, related to the ecotoxicological characterization, including aquatic toxicity, toxicity to terrestrial and soil organisms, and toxicity to terrestrial plants.
Env Fate, which includes studies related to environmental fate.
Tox, which is related to results relevant to effects to human health, including (depending on the availability) human and animal data derived either in vivo, in vitro, or in silico.
Exposure, which includes exposure estimates in occupational or consumer scenarios.
If there is no data available for a specific tab, that tab is omitted (in the example of these are Env Fate and Exposure).
2.4. Case studies to demonstrate the data quality assessment methodology
The methodology was tested using data from the GRACIOUS instance of the eNanoMapper database (Jeliazkova et al. Citation2015). This includes data generated in the following European projects: GRACIOUS, ENPRA, MARINA, NanoGRAVUR, NANoREG, NanoTest, and SANOWORK.Footnote5 This data refers to three main categories: physicochemical endpoints, toxicological endpoints, and ecotoxicological endpoints. We extracted data from this database collecting a total of 81 860 entriesFootnote6 (17 810 of these related to physicochemical endpoints, 63 655 related to toxicological endpoints, and 395 related to ecotoxicological endpoints) on 323 nanoforms of different NMs.
To test the methodology, we selected from this collection as case study the nanoscale silver material JRCNM03000a (NM-300K, Ag 16.7 nm), and we limited the analysis to physicochemical and hazard data generated in the context of the NANoREG project (Dusinska et al. Citation2016, NANoREG Citation2016a, Citation2016b). The reason was that data coming from this project was publicly available at the time of the analysis. Furthermore, according to data availability we selected as endpoints ‘Aquatic Toxicity’ and ‘Genotoxicity,’ as described in S2 of the SI.
Duplicates were removed and partial duplicates (entries referring to the same measurement but providing complementary information about it) were combined generating one individual result per study. Erroneously reported information in the original data was corrected. Specifically, NM names were harmonized to be the same in all entries, and information inserted in wrong columns (i.e. parameters) was moved to the correct one. Empty columns, with the only exception of columns required by data reporting templates, were removed.
After this process, the dataset was narrowed down to a total of 9 aquatic toxicity and 44 genotoxicity studies available for the target material.
3. Results
3.1. Relevant approaches for assessing quality and completeness of nanosafety physicochemical and hazard datasets
The data quality assessment approach by Klimisch et al. (Klimisch et al. Citation1997) was originally developed as a response to the requirements of the EU Existing Substances Regulation (European Commission Citation1994), a predecessor of the Registration, Evaluation, Authorization and Restriction of Chemicals (REACH) (European Commission Citation2006) regulation. Specifically, as part of the reporting requirements to industry, any hazard data for the substance was expected to be entered into its IUCLID (International Uniform Chemical Information Database) record (Alessandrelli and Polci Citation2011), together with an assessment of the relevance, reliability, and adequacy of the data. This approach to quality categorization has enabled substance IUCLID records to be structured in a manner that allows primary data and metadata to be displayed in a manner that is scientifically valid, repeatable, and consistent across substances (Money et al. Citation2013). Since then, the Klimisch methodology has been widely applied to assessing the quality of human and environmental toxicity data for chemical substances, and more recently, it inspired the introduction of approaches for quality assessment of nanospecific physicochemical and hazard datasets (cf. ).
Table 1. State-of-the-art criteria for evaluating data quality and completeness.
However, most of these approaches almost exclusively rely on expert judgment, which makes them unsuitable to be implemented as part of a methodology for the automatic assessment of data quality and completeness. For automatic assessment, the criteria need to be defined in such a way that quality and completeness can be directly inferred from the available metadata.
One approach for evaluation of completeness of physicochemical (meta)data that we considered a suitable basis to achieve automatization was proposed by Comandella et al. (Citation2020). Therefore, we included this approach in our methodology and extended it to cover also human and environmental toxicology studies. This resulted in an approach that is capable of automatically assigning quality and completeness scores according to the four selected principal quality criteria (i.e. completeness, relevance, reliability, and adequacy). This methodology is described in Section 3.2.
3.2. Data quality and completeness assessment methodology
3.2.1. Data completeness assessment
Our approach evaluates data completeness for an (eco)toxicological study, with respect to the provided information related to both the physicochemical characterization and to the testing procedure and test conditions. This is an extension of the work of Comandella et al. (Comandella et alet al. 2020), who proposed the evaluation of (meta)data completeness considering 11 measured physicochemical properties: i.e. crystallinity, composition, particle size, surface chemistry, particle shape, specific surface area, surface charge, surface hydrophobicity, dustiness, water solubility and density. This data is either required by REACH for nanoform identification or are recommended by ECHA as a basis for grouping (Comandella et al. Citation2020). In addition, we propose to evaluate in the same way the completeness of reported (meta)data for human and environmental toxicology endpoints, thus covering completeness of information related to the testing procedure (e.g. reference to the Standard Operating Procedure, the tested endpoint, the assay name, etc.) and test conditions (e.g. the adopted dispersion protocol and medium, the concentration, details on the cell lines and culture conditions, etc.).
Specifically, the Completeness Score (CS) of the data in a data reporting template is defined as the number of items (parameters) reported in a data entry template (cf. Section 2.3) divided by the number of items (parameters) required by the templates related to the eleven physicochemical properties.
Mathematically, given the set of required templates for physicochemical endpoints, the Completeness Score of the ith template in the set ( is computed as follows:
(1)
(1)
EquationEquation (1)(1)
(1) may be adapted according to user’s needs, for instance associating different weights to each parameter of each template, thus obtaining a weighted CS. Furthermore, it is possible to compute the CS as an average of completeness, as defined by EquationEquation (1)
(1)
(1) , of each individual section of the templates (cf. ). The latter is indeed the default approach proposed when downloading templates from the eNanoMapper database (cf. Section 3.4.1). The user can in principle also evaluate the CS associated with the individual template sections.
After computing the CS of each physicochemical template, CSs of physicochemical templates may be averaged, obtaining an overall completeness score of the physicochemical characterization, i.e. :
(2)
(2)
This score could be further averaged with the CS related to the information about the (eco)toxicological data reported in the associated template (i.e. ), which is computed similarly to the completeness score of physicochemical templates (EquationEquation (1)
(1)
(1) ), thus obtaining an overall CS for a particular study:
(3)
(3)
Finally, the completeness of the whole dataset could be computed by averaging the overall CSs of the collected studies.
3.2.2. Data relevance assessment
Data relevance evaluates whether the NM has been tested against the appropriate species and route of exposure, and if appropriate doses/concentrations have been tested and critical parameters influencing the endpoint have been adequately considered (ECHA Citation2011). In our methodology, this is assessed in such a way to ensure that the (eco)toxicity study is conducted using experimental protocols (standards) (with respect to the endpoint of interest) that are appropriate for risk assessment purposes. Four categories were defined for data relevance:
Category 1: data derived by means of internationally recognized and agreed protocols and standard guidelines, such as the Organization for Economic Co-operation and Development Test Guidelines TGs (OECD TGs) or Good Laboratory Practices/International Organization for Standardization Test Conditions (GLP/ISO TCs).
Category 2: data derived using nanospecific validated protocols, and protocols that are candidates to become standard guidelines or ‘standard guidelines with modifications.’
Category 3: data for which the protocol is not included in categories 1 and 2, including nanospecific protocols which are not yet validated (e.g. scientific studies in general).
Category 4: data for which the adopted protocol is not reported in the original source.
Our methodology assesses relevance by automatically comparing the experimental protocol used to derive the data against a pre-defined list of protocols for each endpoint of interest, to which either Category 1 or 2 was already assigned. This list of protocols is reported in S3 of the SI and it covers all recommended protocols for each endpoint from the ECHA’s guidance on IR&CSA (ECHA Citation2017b, Citation2017c).
3.2.3. Data reliability assessment
Following the works of Card and Magnuson (Citation2010) and Fernández-Cruz et al. (Citation2018), reliability assessment of toxicological data is performed by means of the ToxRTool (Schneider et al. Citation2009), which is an excel spreadsheet with an easy user interface. ToxRTool extends the approach originally proposed by Klimisch et al. (Citation1997) by including nanospecific considerations and highlighting the importance of physicochemical characterization.
Similarly to the Klimisch et al. (Citation1997) approach, based on information provided by the user this tool assigns data to the following categories (Schneider et al. Citation2009):
Category 1: Reliable without restriction: Studies or data from the literature or reports which were carried out or generated according to generally valid and/or internationally accepted testing guidelines or in which the test parameters documented are based on a specific (national) testing guideline or in which all parameters described are closely related/comparable to a guideline method.
Category 2: Reliable with restrictions: Studies or data from the literature, reports in which the test parameters documented do not totally comply with the specific testing guideline but are sufficient to accept the data or in which investigations are described which cannot be subsumed under a testing guideline, but which are nevertheless well documented and scientifically acceptable.
Category 3: Not reliable: Studies or data from the literature/reports in which there were interferences between the measuring system and the test substance or in which organisms/test systems were used which are not relevant in relation to the exposure (e.g. non-physiological pathways of application) or which were carried out or generated according to a method which is not acceptable, the documentation of which is not sufficient for assessment and which is not convincing for an expert judgment.
It does not assign to Category 4 (‘Not assignable’), as this assignment should be made by direct consideration of the user.
Similarly, for ecotoxicological data, an adapted version of the ToxRTool is enabled by the NanoCRED tool (Moermond et al. Citation2016; Hartmann et al. Citation2017), which allows assigning data to the same categories, based on filling an excel spreadsheet similar to the ToxRTool and drawing conclusions on reliability of the data by means of expert judgment.
The main drawback of the ToxRTool and NanoCRED is the requirement of expert knowledge to decide whether a study is reliable or not. Moreover, unlike the methodology for computing the CS score, the ToxRTool and the NanoCRED tool cannot be automatically filled and thus it is not possible to automate the process of evaluating reliability directly on data reporting templates.
However, as illustrated in for in vivo endpoints and in for in vitro endpoints, we found that most of the requirements of the ToxRTool are already considered when evaluating completeness (cf. Section 3.2.1) and relevance (cf. Section 3.2.2). Similar considerations were made for NanoCRED tool (to assess reliability of ecotoxicity data), as reported in .
Table 2. Comparison of the criteria for assessing reliability of in vivo data by means of the ToxRTool (Schneider et al. Citation2009) and corresponding mapping on the criteria adopted by the methodology for data quality and completeness.
Table 3. Comparison of the criteria for assessing reliability of in vitro data by means of the ToxRTool (Schneider et al. Citation2009) and corresponding mapping on the criteria adopted by the methodology for Data Quality and Completeness.
Table 4. Comparison of the criteria for assessing reliability of ecotoxicological data by means of the NanoCRED evaluation method for reliability (Moermond et al. Citation2016; Hartmann et al. Citation2017), and corresponding mapping on the criteria adopted by the methodology for data quality and completeness.
The findings summarized in , , and suggest that if data is sufficiently complete and the adopted protocol is relevant for the task with respect to the endpoint of interest, it is also sufficiently reliable.
Consequently, to reduce the need of expert judgment and thus enable the methodology to be fully automatable, in this methodology, data reliability is considered implicitly assessed while evaluating and scoring completeness and relevance, as having a high (low) CS and high (low) relevance of the adopted protocol with respect to the endpoint of interest, also implies high (low) data reliability. This was further supported by a case study reported in Section S4 of the SI.
3.2.4. Data adequacy assessment
Adequacy defines the usefulness of data for the purposes of the analysis. Three main types of studies were selected to define this criterion, namely in vivo, in vitro and in silico.
According to the 3R principle (replacement, reduction, refinement of in vivo tests for a more ethical use of animals in testing and research), in vitro and in silico data—depending on the predictivity for effects in vivo—should be used as an alternative to test data on laboratory animals (ECHA Citation2011, Citation2017b, Citation2017c). However, especially when adopting a WoE approach (EFSA Scientific Committee et al. Citation2017), higher weight is usually associated to the most reliable test for risk assessment purposes (i.e. in vivo), while lower weights are associated to in vitro and in silico studies.
Therefore, since the adequacy criterion is tailored to assess tasks related to risk assessment purposes only, analogously to what described in Section 3.2.2 we automatized the assessment of data adequacy by associating to the adopted protocol a data adequacy score, which relates to the nature of the test (i.e. in vivo, in vitro or in silico).
This is consistent with other approaches, like for instance the one proposed by Hristozov et al. (Citation2014), where authors additionally considered the exposure route in evaluating adequacy, and the one proposed by Basei et al. (Citation2021).
3.2.5. ‘Traffic lights’ methodology for data quality assessment
The proposed, fully automatable methodology, consists in the following steps:
Computation of score for each of the criteria (i.e. completeness, relevance, and adequacy; reliability is implicitly integrated in completeness and relevance scores, cf. Section 3.2.3)
Aggregation of scores into a final data quality and completeness score for a specific dataset, by computing the arithmetic mean of the computed scores
Highlight of data quality and completeness (on the database interface, in the data reporting templates or in risk assessment software tools) based on the computed scores using either ‘traffic lights’ or continuous scales.
The computation of scores for the defined criteria is proposed in .
Table 5. Proposed setup for the selected criteria.
A good physicochemical characterization is not only essential for grouping, read-across, and similarity assessment of nanomaterials (Stone et al. Citation2020; Jeliazkova et al. Citation2022), but it is also a prerequisite for any safety assessment of nanomaterials (OECD Citation2012), and required for fulfilling regulatory obligations (EFSA Scientific Committee et al. Citation2021; ECHA Citation2022). For this reason, in addition to the scoring system presented in , this methodology requires a minimum CS of the physicochemical characterization (i.e. ) for data to be of overall ‘high quality.’ We suggest here 0.5 as minimum value for
or in other words at least half of the metadata included in physicochemical templates must be provided for data to be of overall ‘high quality.’ For certain purposes, it might be appropriate to define an even higher threshold as minimum value for
Assessors may well conclude on the need for relatively high minimum
of datasets to be useful for regulatory safety assessment, and on ‘insufficient quality’ of the entire dataset if
is below such a threshold, the value of which could be agreed on by experts.
Thus, after assessing the weights, and computing the arithmetic mean of the resulting scores, the last step involves to set-up thresholds to the quality score, in order to highlight data with a ‘traffic light.’ We propose the following default thresholds:
Overall score > 0.7 and
: ‘green light,’ data is of high quality.
0.3 < overall score < = 0.7, or
Otherwise: ‘red light,’ data is of insufficient quality.
Alternatively, it is possible to display the data quality and completeness score using a continuous scale from 0 to 1, thus resulting in a gradient from red (i.e. data of insufficient quality) to green (i.e. data of high quality), keeping in mind that a sufficient physicochemical characterization is a prerequisite for high data quality.
The proposed methodology is fully automatable, allowing to highlight data quality directly on the user interface of the eNanoMapper (or any other) database, on external tools and/or in the data reporting templates when uploading/downloading data from the database.
3.3. Demonstration in case studies
3.3.1. Aquatic toxicity
To demonstrate the robustness of the proposed data quality assessment methodology, we applied it to a publicly available dataset obtained from the eNanoMapper database. The dataset involves the nanoscale silver material JRCNM03000a (NM-300K, Ag 16.7) (cf. Section 2.4). The results of the application are reported in and are downloadable within the developed online R tool (cf. Section 3.4.2).
Table 6. Results of applying the methodology to publicly available data in eNanoMapper related to JRCNM03000a (NM-300K, Ag 16.7 nm). Overall completeness and quality scores for the studies are highlighted in bold. The traffic light indicator (last row of the table) highlights both the 'traffic light' and the corresponding meaning (i.e., 'green light' for data of high quality, 'yellow light' for data of sufficient quality, and 'red light' for data of insufficient quality).
It is worth noting that all the computed CSs of (meta)data were low. These low scores are due to the lack of reported information on many physicochemical parameters. Indeed, information on surface area, surface hydrophobicity, dustiness, and density were not available in any of the collected studies, and moreover CSs related to (meta)data associated to particle size and surface charge templates were always below 0.32, resulting in an overall CS for physicochemical templates not greater than 0.30 for all studies. Similar considerations apply concerning ecotoxicological templates: indeed, most of the (meta)data required by the templates was not available.
For this reason, the overall quality of the collected data cannot be higher than ‘sufficient for risk assessment purposes,’ because even though data was obtained from in vivo tests on either fish, algae, and cyanobacteria, and derived from tests following OECD TGs, the physicochemical characterization was not sufficiently reported.
3.3.2. Genotoxicity (in vitro)
A relatively high number of studies (44 studies) concerning genotoxicity (in vitro) of JRCNM03000a (NM-300K, Ag 16.7 nm) were available in eNanoMapper, for this reason in this section aggregate values are reported, while the full analysis is available within the developed online R tool (cf. Section 3.4.2).
In , aggregate CSs related to physicochemical characterization are reported. Scores have been classified using the thresholds defined in Section 2.3 for the traffic light system into four categories, namely: ‘no data’ if no data was available, ‘incomplete data’ if the CS was lower than 0.3, ‘sufficiently complete data’ if the CS was between 0.3 and 0.7, and ‘highly complete data’ if the CS was greater than 0.7.
Figure 3. Aggregate CSs related to physicochemical characterization of the selected data for the second case study (i.e. genotoxicity in vitro). Scores have been classified using the thresholds defined in Section 3.2.5 for the traffic light system into four categories (i.e. ‘No data,’ ‘Incomplete data,’ ‘Sufficiently complete data,’ and ‘Highly complete data’).
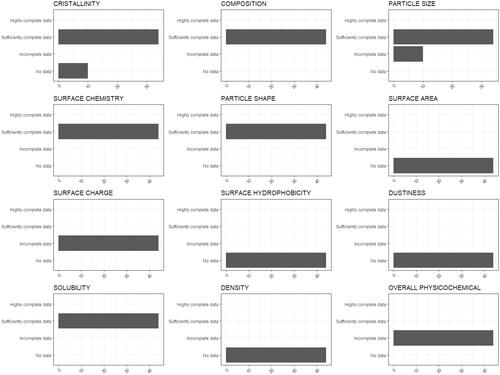
Specifically, no data were available related to the characterization of surface area, surface hydrophobicity, dustiness, and density, and for a subset of data, no data were available related to crystallinity. As a result, the final CS related to physicochemical characterization was low for all the available data (ranging from 0.24 to 0.30), and for this reason even though the CS associated to toxicological templates was relatively high (ranging from 0.61 to 0.77), the final CS resulted to be in the range [0.45, 0.50], as summarized in .
Figure 4. Aggregate CSs related to the overall physicochemical characterization, the toxicological test, and the overall CS for physicochemical data of the selected data for the second case study (i.e. genotoxicity in vitro). Scores have been classified using the thresholds defined in Section 3.2.5 for the traffic light system into three categories (i.e. ‘Incomplete data,’ ‘Sufficiently complete data,’ and ‘Highly complete data’).
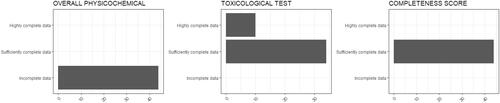
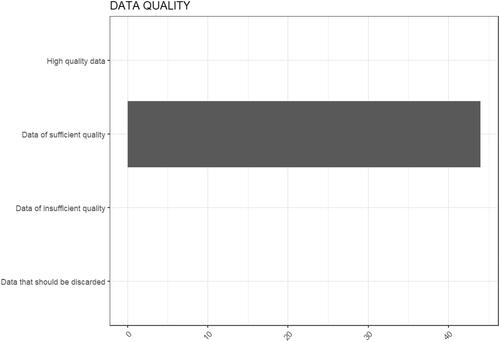
After averaging the overall CS with the scores related to relevance (all data was relevant to the task, Category 1, since it came from standard tests and procedures) and adequacy (all data was derived in vitro), the computed overall data quality and completeness scores ranged in [0.68, 0.70], but since the CS related to the physicochemical characterization was below 0.5 for all the data (i.e. it was not sufficiently characterized), all studies resulted to be of sufficient quality, as displayed in .
Figure 5. Results of the evaluation of data quality and completeness for genotoxicity. Two studies resulted to be of high quality, while 42 studies resulted to be of sufficient quality.
3.4. Implementation of the methodology in data reporting templates and software
3.4.1. Implementation in templates and the eNanoMapper database
Data completeness and reliability assessment is already implemented in the development version of eNanoMapper database, by providing the completeness score directly in the templates for inserting and retrieving data (Gottardo et al. Citation2019), as displayed in .
Figure 6. Implementation of the data completeness and reliability criteria in the development version of eNanoMapper. When downloading information selecting as format ‘NANoREG template,’ completeness is computed, and the completeness score is highlighted using an heatmap from red (0, data fully incomplete) to green (1, data fully complete). The numbers between parentheses in the left menu of eNanoMapper represent the total number of data points associated to each category, after application of filters. The number of substances, instead, is shown on the top of the main window.
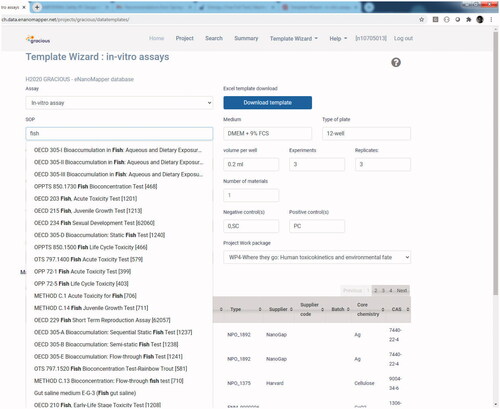
Similarly, the step of data relevance evaluation is already implemented in the database, as a pre-defined list of protocols and Standard Operating Procedures (SOPs) for each template is already available, as displayed in . Thus, it is sufficient to associate each of the SOPs to one of the four data relevance categories to automatize the computation of relevance scores. Similarly, an adequacy score can be associated to each SOP as it is of course already known if it is an in vivo or an in vitro test.
Figure 7. A list of Standard Operating Procedures is already provided in the eNanoMapper database when selecting a reporting template.
3.4.2. An online R tool implementing the methodology
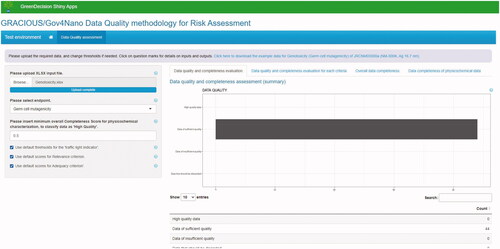
In addition to the initial implementation in the eNanoMapper database, the methodology was implemented as an online R tool (https://shinyapps.greendecision.eu/apps/gracious-data-quality), which in the current version only displays the results of the computed scores in a user friendly way and categorizes data according to (user inserted) thresholds as being ‘data is of high quality,’ ‘data of sufficient quality,’ ‘data of insufficient quality,’ and ‘data that should be discarded.’
The next version of the tool will be made interoperable with the eNanoMapper database through the eNanoMapper APIs, so that it can automatically compute completeness, relevance, and adequacy scores while querying the database. In detail, the user will be able to directly query eNanoMapper data (by means of a user interface built upon the eNanoMapper APIs), then quality and completeness scores will be automatically computed following the methodology described in Section 3.2 according to the specified weights, and finally results will be displayed in the tool as highlighted in .
Figure 8. Screenshot of the initial version of a tool implementing the data quality assessment methodology. The results of the case study related to genotoxicity in vitro (cf. Section 3.3.2) are displayed. Currently, the tool computes data quality and completeness scores starting from the selected endpoint, the CSs of physicochemical parameters, and the classification into data reliability and adequacy categories, and then displays aggregate information on data quality and completeness of the dataset. In future versions, it will be able to directly query the eNanoMapper database.
The tool can be made interoperable also with other databases (note that correspondence between the data models and the NANoREG/GRACIOUS templates and fields need to be established) as well as with relevant software tools such as the SUNDS decision support system for risk assessment and management of NMs. Screenshot of the current version of the tool is provided in . The tool and an example of its integration in a relevant decision support system (i.e. SUNDS) are described in more detail in the SI.
4. Discussion
In this article, we propose a methodology to automatically assess the quality of physicochemical and hazard data for risk assessment purposes based on established criteria (i.e. completeness, relevance, reliability, and adequacy). The assessment starts from the available (meta)data as provided in the harmonized NANoREG/GRACIOUS templates for data entry into the eNanoMapper database. The methodology was tested in a case study using publicly available physicochemical and (eco)toxicity (i.e. aquatic toxicity and genotoxicity) data on the nanoscale silver material JRCNM03000a (NM-300K, Ag 16.7 nm). To enable easy implementation of the methodology in databases and software tools, an online R tool was developed. The methodology was also partially implemented in the eNanoMapper database and was adopted as part of a WoE approach for classification of NMs according to the CLP regulatory requirements (Basei et al. Citation2021).
The main novelty of this methodology is that in addition to (meta)data completeness, the assessment of data quality can be automated, thus reducing the reliance on expert judgment. This is extremely useful for implementing the approach in data reporting templates (Totaro et al. Citation2017; Gottardo et al. Citation2019), databases, and software-based risk assessment tools.
It is important to highlight, however, that even though this methodology was developed with the aim of being automatable, expert judgment is always important in risk assessment, and although the results of our methodology are helpful to guide risk assessors in the selection of more complete and higher quality datasets, in many cases, a follow-up analysis by experts may be required.
Specifically, the assumption made in Section 3.2.3, namely, to consider reliability implicitly assessed when evaluating completeness and relevance, may trigger additional analysis by some assessors. Indeed, we made this assumption to reduce the need of expert judgment and to provide a fully automatable methodology, but some risk assessors may decide for a more in-depth assessment of data reliability, which would then require the use of expert judgment.
Moreover, while our methodology works with defined weights and thresholds, some experts may have a different idea of which criteria may be more important than others in specific cases. To address this, our methodology is flexible enough to allow these experts to change the weights and thresholds according to their opinion. For example, although our case study analysis of JRCNM03000a datasets concluded that the data is of ‘sufficient quality,’ some experts may consider the same data being of ‘insufficient quality’ because information on several physicochemical parameters was not available. In this case, these experts would still be able to use our approach by changing weights and thresholds, but this would of course require their expert judgment. Nevertheless, it is worth noting that data of low or insufficient quality may still be useful when used together with data of higher quality, e.g. in a WoE approach (ECHA Citation2011; Basei et al. Citation2021).
Involvement of a pool of domain experts is envisaged to further define aspects of the methodology such as the weighting schemes. These weights, however, can be adapted by the final users according to their needs, for instance by weighting more the parameters, which are related to data reliability assessment done by means of the ToxRTool/NanoCRED tool (i.e. the parameters highlighted in , , and ). Similarly, when evaluating endpoints for which no in vivo data is available (or are not needed as in a safe-by-design assessment scenario for example), assessors may decide to give an adequacy score of 1 to data derived in vitro or may decide to give a score greater that the one proposed in this article (i.e. 0.6) to such data, emphasizing the need to reduce animal testing in compliance with the 3R principles.
This methodology is tailored to risk assessment purposes and particularly to evaluate quality of (eco)toxicological data. Indeed, the evaluation of data quality for exposure is not covered by the approach described in this article, and further work is needed to evaluate quality for dose–response data based on additional criteria such as biological relevance and statistical significance. Moreover, this methodology does not focus on the quality of physicochemical data but considers the completeness of the available physicochemical (meta)data associated to (eco)toxicological tests. A further limitation of the approach described in this article is that Adverse Outcome Pathways (AOPs) are not considered in the current version.
The proposed methodology could also serve as a starting point for other domains (e.g. modeling) or as a reference for creating methodologies for physicochemical and exposure data, after adapting the selected evaluation criteria or adding additional criteria. For instance, in case of modeling, also the statistical significance (Hristozov et al. Citation2014) and the size of the dataset (Lubinski et al. Citation2013) could be selected as potential assessment criteria or as a basis to redefine the adequacy criterion, since publicly available data in databases for building computational models is known to be more sparse with respect to other domains (Basei et al. Citation2019; Furxhi et al. Citation2020a, Citation2020b). Similarly, for evaluating data quality related to exposure or physicochemical data, this methodology needs to be modified by redefining the assessment criteria.
Finally, it is worth noting that adopting automatic methodologies like the one proposed in this manuscript allows to perform the analysis at ‘real time.’ Hence, one can monitor the degree of completeness and quality over time for a specific query or even for the whole data in a database, which helps to ensure that the degree of quality and completeness of new (or updated) data is sufficiently addressed by data providers.
Indeed, we are confident that adopting (automatic) methodologies like the one proposed in this manuscript, will not only help the final user (e.g. the risk assessor or the modeler) to evaluate the quality and completeness of data, but their implementation in data reporting templates and databases can also serve as a strong incentive for data providers to deliver more complete datasets of higher quality.
5. Conclusions
This article describes a methodology to automatically assess quality and completeness of nanosafety data for risk assessment purposes. The methodology is tailored to physicochemical and hazard (meta)data, but with appropriate criteria it can be re-configured to support also modeling or exposure assessment. Therefore, in combination with expert knowledge, this methodology can be applied as a powerful data analytical tool in different contexts. To enable practical application of the proposed methodology, it was implemented as an online R tool, which can be attached to both databases and risk assessment software tools. The approach was also implemented in a WoE approach to classify NMs according to CLP regulatory requirements (Basei et al. Citation2021), and it was implemented as a ‘traffic lights’ system in the NANoREG/GRACIOUS data reporting templates exported from eNanoMapper database. The latter enables data providers to see in real time how their datasets perform in terms of completeness and quality. The users of the data can also see this information both in the data entry templates and on the database interface, which enables them to select better datasets for analyses ranging from similarity assessment and grouping to classification and regulatory risk assessment.
Supplemental Material
Download MS Word (931.2 KB)Acknowledgements
We are also grateful to the participants at the public workshop for the constructive feedback on the proposed methodology.
Disclosure statement
No potential conflict of interest was reported by the author(s).
Additional information
Funding
Notes
2 See https://www.slido.com.
4 See https://api.ideaconsult.net/.
5 Information on the mentioned projects may be found at the following web pages: https://www.h2020gracious.eu/ (GRACIOUS); http:// http://www.enpra.eu/ (ENPRA); https://cordis.europa.eu/project/id/263215 (MARINA); https://cordis.europa.eu/project/id/310584 (NANoREG); https://nanopartikel.info/en/research/projects/nanogravur/ (NanoGRAVUR); http:// http://www.nanotest-fp7.eu/ (NANOTEST); https://cordis.europa.eu/project/id/280716/ (SANOWORK).
6 An entry of raw data is a single data element resulting from a query, expressing information on one specific quantity (or value) determined in an experiment using a specific measurement technique. For instance, a dose–response curve of five elements resulting from a single study consists of five entries. Data was retrieved from the eNanoMapper database in August 2021.
References
- Alessandrelli, M., and M. Polci. 2011. “CLP Application to Nanomaterials: A Specific Aspect.” Annali Dell'Istituto Superiore di Sanita 47 (2): 146–152.
- Basei, G., D. Hristozov, L. Lamon, A. Zabeo, N. Jeliazkova, G. Tsiliki, A. Marcomini, and A. Torsello. 2019. “Making Use of Available and Emerging data to predict the Hazards of Engineered Nanomaterials by Means of in Silico Tools: A Critical Review.” NanoImpact 13: 76–99. doi:https://doi.org/10.1016/j.impact.2019.01.003.
- Basei, G., A. Zabeo, K. Rasmussen, G. Tsiliki, and D. Hristozov. 2021. “A Weight of Evidence Approach to Classify Nanomaterials according to the EU Classification, Labelling and Packaging Regulation Criteria.” NanoImpact 24: 100359. doi:https://doi.org/10.1016/j.impact.2021.100359.
- Card, J. W., and B. A. Magnuson. 2010. “A Method to Assess the Quality of Studies That Examine the Toxicity of Engineered Nanomaterials.” International Journal of Toxicology 29 (4): 402–410. doi:https://doi.org/10.1177/1091581810370720.
- Cazzagon, V., E. Giubilato, L. Pizzol, C. Ravagli, S. Doumett, G. Baldi, M. Blosi, et al. 2022. “Occupational Risk of Nano-Biomaterials: Assessment of Nano-Enabled Magnetite Contrast Agent Using the BIORIMA Decision Support System.” NanoImpact 25: 100373. doi:https://doi.org/10.1016/j.impact.2021.100373.
- Comandella, D., S. Gottardo, I. M. Rio-Echevarria, and H. Rauscher. 2020. “Quality of Physicochemical Data on Nanomaterials: An Assessment of Data Completeness and Variability.” Nanoscale 12 (7): 4695–4708. doi:https://doi.org/10.1039/c9nr08323e.
- Dusinska, M., M. Roxana Cimpan, D. Carlander, K. Hogveen, V. Fessard, B. Suarez, R. Marcos, et al. 2016. NANoREG D5.07: Develop a rapid high throughput screening methodology to evaluate nanomaterial toxicity. https://www.rivm.nl/sites/default/files/2018-11/NANoREG%20D5.07%20DR%20Develop%20a%20rapid%20HTS%20methodology%20to%20evaluate%20NM%20toxicity.pdf
- ECHA (European Chemicals Agency). 2011. Guidance on information requirements and chemical safety assessment- Chapter R.4: Evaluation of available information. https://echa.europa.eu/documents/10162/17235/information_requirements_r4_en.pdf
- ECHA (European Chemicals Agency). 2017a. Guidance on the application of the CLP criteria, guidance to regulation (EC) No 1272/2008 on classification, labelling and packaging (CLP) of substances and mixtures, version 5.0. https://echa.europa.eu/documents/10162/23036412/clp_en.pdf/58b5dc6d-ac2a-4910-9702-e9e1f5051cc5
- ECHA (European Chemicals Agency). 2017b. Guidance on information requirements and chemical safety assessment chapter R.7a: Endpoint specific guidance. https://echa.europa.eu/documents/10162/17224/information_requirements_r7a_en.pdf/
- ECHA (European Chemicals Agency). 2017c. Guidance on information requirements and chemical safety assessment chapter R. 7b : Endpoint specific guidance. https://echa.europa.eu/documents/10162/17224/information_requirements_r7b_en.pdf/
- ECHA (European Chemicals Agency). 2022. Appendix for nanoforms applicable to the guidance on registration and substance identification (version 2.0). https://echa.europa.eu/documents/10162/13655/how_to_register_nano_en.pdf/f8c046ec-f60b-4349-492b-e915fd9e3ca0
- European Commission. 2006. “Regulation (EC) 1907/2006 of the European Parliament and of the Council of 18 December 2006 concerning the Registration, Evaluation, Authorisation and Restriction of Chemicals (REACH), Establishing a European Chemicals Agency, Amending Directive 1999/45/E.” Official Journal of the European Union L 396: 1–849.
- European Commission, 1994. “Commission Regulation (EC) No 1488/94 of 28 June 1994 Laying down the Principles for the Assessment of Risks to Man and the Environment of Existing Substances in accordance with Council Regulation.” Official Journal of the European Union L 161: 3–11.
- European Parliament and Council, 2008. “ Regulation (EC) No 1272/2008 of the European Parliament and of the Council of 16 December 2008 on Classification, Labelling and Packaging of Substances and Mixtures, Amending and Repealing Directives 67/548/EEC and 1999/45/EC, and Amending Regulation (EC).” Official Journal of the European Union L 353: 1–1355.
- Fernández-Cruz, M. L., D. Hernández-Moreno, J. Catalán, R. K. Cross, H. Stockmann-Juvala, J. Cabellos, V. R. Lopes, et al. 2018. “Quality Evaluation of Human and Environmental Toxicity Studies Performed with Nanomaterials-the GUIDEnano Approach.” Environmental Science: Nano 5 (2): 381–397. doi:https://doi.org/10.1039/C7EN00716G.
- Furxhi, I., A. J. Koivisto, F. Murphy, S. Trabucco, B. Del Secco, and A. Arvanitis. 2021. “Data Shepherding in Nanotechnology. The Exposure Field Campaign Template.” Nanomaterials 11 (7): 1818. doi:https://doi.org/10.3390/nano11071818.
- Furxhi, I., F. Murphy, M. Mullins, A. Arvanitis, and C. A. Poland. 2020a. “Nanotoxicology Data for in Silico Tools: A Literature Review.” Nanotoxicology 14 (5): 612–637. doi:https://doi.org/10.1080/17435390.2020.1729439.
- Furxhi, I., F. Murphy, M. Mullins, A. Arvanitis, and C. A. Poland. 2020b. “Practices and Trends of Machine Learning Application in Nanotoxicology.” Nanomaterials 10 (1): 116. doi:https://doi.org/10.3390/nano10010116.
- Gottardo, S., G. Ceccone, H. Freiberger, P. Gibsin, M. Kellermeier, E. Guggiero, B. Stolpe, W. Wacker, and H. Rauscher. 2019. GRACIOUS Data Logging Templates for the Environmental, Health and Safety Assessment of Nanomaterials. Luxembourg: EUR 29848 EN, Publications Office of the European Union. doi:https://doi.org/10.2760/142959, JRC117733.
- GRACIOUS deliverable 6.1: Requirements for data quality criteria, data sources, modelling tools and terminology. 2021. https://ec.europa.eu/research/participants/documents/downloadPublic?documentIds=080166e5db4a6d00&appId=PPGMS.
- EFSA Scientific Committee, A. Hardy, D. Benford, T. Halldorsson, M. J. Jeger, H. K. Knutsen, S. More, H. Naegeli, et al. 2017. “Scientific Opinion on the Guidance on the Use of the Weight of Evidence Approach in Scientific Assessments.” EFSA Journal 2017 15 (8): 4971, 69 pp. doi:https://doi.org/10.2903/j.efsa.2017.4971.
- Hartmann, N. B., M. Ågerstrand, H. C. H. Lützhøft, and A. Baun. 2017. “NanoCRED: A Transparent Framework to Assess’ the Regulatory Adequacy of Ecotoxicity Data for Nanomaterials – Relevance and Reliability Revisited.” NanoImpact 6: 81–89. doi:https://doi.org/10.1016/j.impact.2017.03.004.
- Hristozov, D., L. Pizzol, G. Basei, A. Zabeo, A. Mackevica, S. F. Hansen, I. Gosens, et al. 2018. “Quantitative Human Health Risk Assessment along the Lifecycle of Nano-Scale Copper-Based Wood Preservatives.” Nanotoxicology 12 (7): 747–765. doi:https://doi.org/10.1080/17435390.2018.1472314.
- Hristozov, D. R., A. Zabeo, C. Foran, P. Isigonis, A. Critto, A. Marcomini, and I. Linkov. 2014. “A Weight of Evidence Approach for Hazard Screening of Engineered Nanomaterials.” Nanotoxicology 8 (1): 72–87. doi:https://doi.org/10.3109/17435390.2012.750695.
- Jeliazkova, N., M. D. Apostolova, C. Andreoli, F. Barone, A. Barrick, C. Battistelli, C. Bossa, et al. 2021. “Towards FAIR Nanosafety Data.” Nature Nanotechnology 16 (6): 644–654. doi:https://doi.org/10.1038/s41565-021-00911-6.
- Jeliazkova, N., E. Bleeker, R. Cross, A. Haase, G. Janer, W. Peijnenburg, M. Pink, et al. 2022. “How Can we Justify Grouping of Nanoforms for Hazard Assessment? Concepts and Tools to Quantify Similarity.” NanoImpact 25: 100366. doi:https://doi.org/10.1016/j.impact.2021.100366.
- Jeliazkova, N., C. Chomenidis, P. Doganis, B. Fadeel, R. Grafström, B. Hardy, J. Hastings, et al. 2015. “The eNanoMapper Database for Nanomaterial Safety Information.” Beilstein Journal of Nanotechnology 6 (1): 1609–1634. doi:https://doi.org/10.3762/bjnano.6.165.
- Klimisch, H. J., M. Andreae, and U. Tillmann. 1997. “A Systematic Approach for Evaluating the Quality of Experimental Toxicological and Ecotoxicological Data.” Regulatory Toxicology and Pharmacology: RTP 25 (1): 1–5. doi:https://doi.org/10.1006/rtph.1996.1076.
- Kochev, N., N. Jeliazkova, V. Paskaleva, G. Tancheva, L. Iliev, P. Ritchie, and V. Jeliazkov. 2020. “Your Spreadsheets Can Be Fair: A Tool and Fairification Workflow for the Enanomapper Database.” Nanomaterials 10 (10): 1908.
- Krug, H. F., N. Bohmer, D. Kühnel, C. Marquardt, K. Nau, and C. Steinbach. 2018. “The DaNa2.0 Knowledge Base Nanomaterials—an Important Measure Accompanying Nanomaterials Development.” Nanomaterials 8 (4): 204. doi:https://doi.org/10.3390/nano8040204.
- Loosli, F., K. Rasmussen, H. Rauscher, R. K. Cross, N. Bossa, W. Peijnenburg, J. Arts, et al. 2022. “Refinement of the Selection of Physicochemical Properties for Grouping and Read-across of Nanoforms.” NanoImpact 25: 100375. doi:https://doi.org/10.1016/j.impact.2021.100375.
- Lubinski, L., P. Urbaszek, A. Gajewicz, M. T. D. Cronin, S. J. Enoch, J. C. Madden, D. Leszczynska, J. Leszczynski, and T. Puzyn. 2013. “Evaluation Criteria for the Quality of Published Experimental Data on Nanomaterials and Their Usefulness for QSAR Modelling.” SAR and QSAR in Environmental Research 24 (12): 995–1008. doi:https://doi.org/10.1080/1062936X.2013.840679.
- Marchese Robinson, R. L., I. Lynch, W. Peijnenburg, J. Rumble, F. Klaessig, C. Marquardt, H. Rauscher, et al. 2016. “How Should the Completeness and Quality of Curated Nanomaterial Data Be Evaluated?” Nanoscale 8 (19): 9919–9943. doi:https://doi.org/10.1039/c5nr08944a.
- Moermond, C. T. A., R. Kase, M. Korkaric, and M. Ågerstrand. 2016. “CRED: Criteria for Reporting and Evaluating Ecotoxicity Data.” Environmental Toxicology and Chemistry 35 (5): 1297–1309. doi:https://doi.org/10.1002/etc.3259.
- Money, C. D., J. A. Tomenson, M. G. Penman, P. J. Boogaard, and R. Jeffrey Lewis. 2013. “A Systematic Approach for Evaluating and Scoring Human Data.” Regulatory Toxicology and Pharmacology : RTP 66 (2): 241–247. doi:https://doi.org/10.1016/j.yrtph.2013.03.011.
- EFSA Scientific Committee, S. More, V. Bampidis, D. Benford, C. Bragard, T. Halldorsson, A. Hernández-Jerez, S. Hougaard Bennekou, et al. 2021. “Guidance on Risk Assessment of Nanomaterials to Be Applied in the Food and Feed Chain: human and Animal Health.” EFSA Journal 19 (8): 6768, 111 pp. doi:https://doi.org/10.2903/j.efsa.2021.6768.
- NANoREG. 2016a. Accumulation potential and aquatic toxicity of relevant groups of nanomaterials and product formula. https://www.rivm.nl/sites/default/files/2018-11/NANoREG%20D4.12%20FS%20Accumulation%20potential%20and%20aquatic%20toxicity%20of%20relevant%20groups%20of%20nanomaterials%20and%20product%20formula.pdf
- NANoREG. 2016b. D5.06: Identification and optimization of the most suitable in vitro methodology. https://www.rivm.nl/sites/default/files/2019-01/NANoREG_D5_06_DR_Identification_and_optimization_of_the_most_suitable_in_vitro_methodology_Yo3qmgPoS9aEh1-9l2OVcA.pdf
- OECD. 2012. “Important Issues on Risk Assessment of Manufactured Nanomaterials (OECD Environment, Health and Safety Publications. Series on the Safety of Manufactured Nanomaterials No. 33).” ENV/JM/MONO(2012)/ 8 (33): 57.
- Pizzol, L., D. Hristozov, A. Zabeo, G. Basei, W. Wohlleben, A. J. Koivisto, K. A. Jensen, W. Fransman, V. Stone, and A. Marcomini. 2019. “SUNDS Probabilistic Human Health Risk Assessment Methodology and Its Application to Organic Pigment Used in the Automotive Industry.” NanoImpact 13: 26–36. doi:https://doi.org/10.1016/j.impact.2018.12.001.
- Saarimäki, L. A., A. Federico, I. Lynch, A. G. Papadiamantis, A. Tsoumanis, G. Melagraki, A. Afantitis, A. Serra, and D. Greco. 2021. “Manually Curated Transcriptomics Data Collection for Toxicogenomic Assessment of Engineered Nanomaterials.” Scientific Data 8 (1): 41. doi:https://doi.org/10.1038/s41597-021-00808-y.
- Schneider, K., M. Schwarz, I. Burkholder, A. Kopp-Schneider, L. Edler, A. Kinsner-Ovaskainen, T. Hartung, and S. Hoffmann. 2009. “ "ToxRTool", a new tool to assess the reliability of toxicological data.” Toxicology Letters 189 (2): 138–144. doi:https://doi.org/10.1016/j.toxlet.2009.05.013.
- Seleci, D. A., G. Tsiliki, K. Werle, D. A. Elam, O. Okpowe, K. Seidel, X. Bi, et al. 2022. “Determining Nanoform Similarity via Assessment of Surface Reactivity by Abiotic and in Vitro Assays.” NanoImpact 26: 100390. doi:https://doi.org/10.1016/j.impact.2022.100390.
- Stone, V., S. Gottardo, E. A. J. Bleeker, H. Braakhuis, S. Dekkers, T. Fernandes, A. Haase, et al. 2020. “A Framework for Grouping and Read-across of Nanomaterials- Supporting Innovation and Risk Assessment.” Nano Today. 35: 100941. doi:https://doi.org/10.1016/j.nantod.2020.100941.
- Totaro, S. H. Crutzen, and J. Riego-Sintes. 2017. “Data Logging Templates for the Environmental, Health and Safety Assessment of Nanomaterials.” Publications Office of the European Union. doi:https://doi.org/10.2787/505397.
- Tsiliki, G., D. A. Seleci, A. Zabeo, G. Basei, D. Hristozov, N. Jeliazkova, M. Boyles, et al. 2022. “Bayesian Based Similarity Assessment of Nanomaterials to Inform Grouping.” NanoImpact 25: 100389. doi:https://doi.org/10.1016/j.impact.2022.100389.
- Zabeo, A., G. Basei, G. Tsiliki, W. Peijnenburg, and D. Hristozov. 2022. “Ordered Weighted Average Based Grouping of Nanomaterials with Arsinh and Dose Response Similarity Models.” NanoImpact 25: 100370. doi:https://doi.org/10.1016/j.impact.2021.100370.