
 ?Mathematical formulae have been encoded as MathML and are displayed in this HTML version using MathJax in order to improve their display. Uncheck the box to turn MathJax off. This feature requires Javascript. Click on a formula to zoom.
Abstract
Recently a new International Standard for testing nanomaterial photocatalytic activity under physiological conditions was issued by Technical Committee 229 (Nanotechnologies) of the International Organization for Standardization (ISO 20814:2019 Nanotechnologies-Testing the photocatalytic activity of nanoparticles for NADH oxidation). The document offers a robust, high throughput photocatalytic assay using a bio-compatible indicator nicotinamide amide dinucleotide (NAD) and provides a screening tool to gauge nanomaterial potency for phototoxicity. This paper describes the measurement principles behind this assay, the scope of the standard and its validation through an interlaboratory comparison study using a traceable standard reference material (SRM 1898).
1. Introduction
Standardization for nanotechnologies is required to promote the commercialization of nanoproducts. It is also essential to ensure protection of humans and environment from various hazards due to their potential exposure to manufactured nanomaterials (MNMs). These are responsibilities of the International Organization for Standardization Technical Committee 229 (ISO/TC229 Nanotechnologies), a leading originator of consensus-based standards in this area (Hatto Citation2009).
The potential for risks to human health and the environment associated with the manufacture and use of MNMs was recognized early on (Ferin et al. Citation1990). Concerns arose from the high surface-to-volume ratio, increased reactivity, and unique attributes related to size-dependent MNM physicochemical properties such as enhanced transport across biological barriers (Schulte et al. Citation2019). Consequently some materials, while benign in the bulk form, potentially exhibit toxicity when present in nano forms (Yordanov, Tzankova, and Yoncheva Citation2018). Exposure of humans to high volume produced MNMs is growing, highlighting the need to assess the potential hazards. Even though nanotoxicology is now a well-established research field (Singh et al. Citation2019) it is not realistic to expect comprehensive epidemiological and ecosystem data for each MNM product, given the vast variety of their hazard factors, such as particle size, crystallographic structure, surface coating, etc. Although traditional toxicology relies on animal models for safety screening, the basic safety data is still lacking for 86% of major chemicals (Kathawala et al. Citation2013) that were several decades in production. Therefore, the toxicological assessment of emerging materials like MNMs pose a substantial challenge. Lately there is a strong push by regulatory agencies toward a no-animal based testing approach. This situation suggests that in vitro assays based on human and animal cells as well as mechanistically informative in situ reactivity tests could accelerate MNM screening for potential hazards, which is required for market approval.
A broad range of nanomaterials, currently used as photocatalysts, UV light blockers in sunscreens, display materials as well as in nanotherapeutics are produced in large quantities (TiO2, ZnO, WO3, CeO2, quantum dots, etc.) and can produce reactive oxygen species (ROS) under light exposure. Phototoxicity can be further categorized as photo-irritation, photo-allergy and photo-genotoxicity. Assessment of these effects require dedicated in vitro and in vivo assays developed for soluble chemicals (Ceridono et al., Citation2012, Maurer Citation1987), and photocatalytic activity (PCA) has been identified by the Organization for Economic Cooperation and Development (OECD) as one of the seventeen physicochemical parameters of MNMs relevant to environmental safety and human health (Yin et al. Citation2014).
Phototoxicity is triggered by adverse chemical reactions supported by photocatalytically active material under illumination. Absorption of a photon with a sufficient energy in semiconducting MNMs generates an electron-hole pair that can migrate to the particle surface and react with water and/or oxygen, producing various radicals and reactive oxygen species (ROS)(Friehs et al. Citation2016). Light absorption by a tested material is considered a necessary condition for the photochemical reaction to occur. Therefore, light absorbance measurement can be used as a first round of screening for phototoxicity potential. However, it was determined for chemicals that light absorption did not always reveal material phototoxic potential, as the generation of ROS is the key determinant for material causing phototoxic reactions (Huygevoort et al. Citation2016). These species induce cellular redox imbalance and can damage organism biomolecules, proteins, lipids and nucleic acids. Moreover, some MNMs can release highly reactive metal ions under light exposure (Kahru et al. Citation2008; Lipovsky et al. Citation2011). Either way, material photocatalytic activity (PCA) is directly related to phototoxicity and its measurement can be employed to assess the MNM phototoxic hazard potential (Friehs et al. Citation2016) prior to conducting in vitro and in vivo phototoxicity assays.
A typical procedure to measure PCA for soluble chemicals involves monitoring the kinetics of an organic chemical degradation by photogenerated radicals (Mills, Hill, and Robertson Citation2012). The indicator chemical concentration change over time occurs because of the photocatalytic reaction under light exposure and can be evaluated using absorbance, fluorescence or other analytical techniques. Currently there are no OECD issued guidelines for testing MNM PCA (Rasmussen et al. Citation2019). Existing PCA standard assays, developed by ISO TC 206 (Fine Ceramics) – ISO 10678, ISO 10676, ISO 22197 – however, are not directly applicable to MNMs as they require substantial material quantities (milligrams to grams), relatively large solution volume (>50 mL), lengthy measurements (over 24 h), and separation of the photocatalyst from the suspension prior to analysis (Mills, Hill, and Robertson Citation2012). In addition, common indicator reagents such as methylene blue, acetaldehyde or dimethyl-sulfoxide are not biocompatible (Mills, Hill, and Robertson Citation2012), thus complicating the assessment of phototoxicity potency under physiological conditions. Comparison of the photocatalytic activity between laboratories is hampered due to different light sources, reactor geometries and concentrations of the photocatalyst MNM (Beegam, Narendranath, and Periyat Citation2017, Bhat et al. Citation2017, Lei et al. Citation2016, Kim et al. Citation2016, Kamalakkannan et al. Citation2016b, Satra et al. Citation2019, Kamalakkannan et al. Citation2016a). Since the photochemical reaction rate is directly dependent on the photon energy and number (light intensity), it is imperative to ensure a uniform, well characterized, and reproducible lighting throughout the sample suspension. The photocatalytic efficiency depends on the spectral distribution and radiant intensity; hence it is improper to compare the material activity values measured with different light sources. Even a small fraction of high energy photons (λ < 300 nm) present in the output of some illuminators can disproportionately accelerate the photochemical reaction expected to be driven by UVA light (315–400 nm). Similarly, the presence of the visible light produced by Xe arc lamps can lead to false positive effects when used with some dye indicators (Lipovsky et al. Citation2011). Another key factor is light penetration through the reactor, which depends on particle concentration and their optical properties. These parameters should be tightly controlled to ensure a reproducible procedure.
The aim of this paper is to describe the development of a standardized, high throughput PCA assay using a bio-compatible indicator nicotinamide amide dinucleotide (NAD). NAD is an indispensable part of living systems, supporting energy homeostasis (Kulkarni and Brookes Citation2019) and serves as a cofactor to multiple enzymatic reactions. NAD’s reduced form, i.e. NADH, can be conveniently quantified using fluorescence or absorbance measurements (Blacker and Duchen Citation2016).
2. Scope and contents of the ISO standard
The standard MNM PCA assay is based on a prototype procedure, first described by Lee et al. (Lee et al. Citation2011), which underwent further development throughout the interlaboratory comparison study. The main advantages of this assay are that it does not require complicated equipment, uses only milligram quantities of the MNM and accomplishes a high throughput PCA screening in just a couple of hours.
As stated in the scope of the standard, it specifies a method for the measurement of photocatalytic activity of nanoparticles, suspended in aqueous environment under physiologically relevant conditions, by measuring UV-induced NADH oxidation. The measurement is intended to assess the potential for phototoxicity of nanomaterials. The method is also applicable to nanoparticle aggregates and agglomerates. Verification by several independent laboratories and rigorous statistical analysis of their output is key in the development of the robust and reproducible measurement procedure. In that way, procedure sensitivity to various measurement inputs such as operator actions, equipment, and material differences, as well as environmental conditions can be elucidated and managed to reduce variability (Petersen et al. Citation2020). Protocol tests for reproducibility and repeatability by independent laboratories is an integral part of international standard development within ISO TC229.
The MNM PCA testing protocol was developed starting with the measurement principle, described in (Lee et al. Citation2011) with basic steps provided in a flowchart ().
Figure 1. Measurement workflow of the MNM PCA.
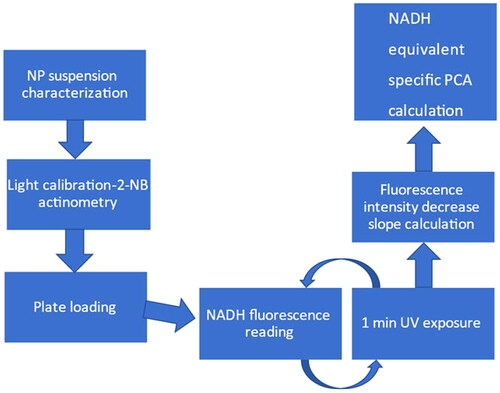
Equipment required to perform the MNM PCA assay consists of a UV-VIS spectrophotometer with a wavelength ranging from 190 to 800 nm, a flat-bottom surface UV transparent 96-well plate with dark plastic sides, a microplate absorbance and fluorescence reader, and a UV transilluminator as a UVA light source.
3. Methodology
3.1. Nanoparticle dispersion
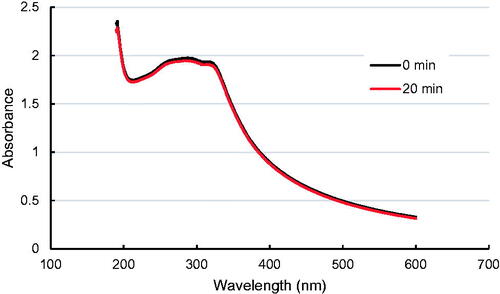
MNMs are dispersed in the phosphate buffer saline (PBS) at pH = 8.0 at fixed concentrations, and suspension stability is tested to ensure material consistency for the duration of the measurement (at least 20 min). Comprehensive MNM characterization is not required by this standard, and only properties that directly affect the measurement reliability are defined. To ensure the uniform illumination of the reaction volume throughout the well and minimize the internal filter effects (Kao, Asanov, and Oldham Citation1998) for NADH fluorescence measurement, the maximum nanosuspension absorbance is specified to be within the prescribed limits (1.4 < A < 1.6) in the wavelength range from 300 to 800 nm for the duration of the experimental procedure. This condition also facilitates the adequate material response to the UVA light inside a plate well. As this protocol is applicable to various types of MNM suspensions, the user is directed to a published dispersion procedure for the particular MNM type to achieve an adequately uniform and sufficiently stable suspension (Taurozzi, Hackley, and Wiesner Citation2013).
For the industrially relevant case of TiO2 MNM, the first step of the dispersion procedure involves dispersing the nano-powder into deionized (DI) water using a probe sonication routine at a prescribed power, and sonicator probe submersion, followed by exposure to bovine serum albumin (BSA) and a final dilution in the cell media (Taurozzi, Hackley, and Wiesner Citation2013). The suspensions were prepared by adding 0.025 g of SRM 1898 to a 100 mL, 5 cm diameter glass beaker, after which 50 mL of DI water were added. The sonicator tip was directly immersed into beaker to a depth of 2.5 cm below the liquid line and sonicated for 15 min with the 80% duty cycle. The beaker was placed into ice bath during sonication. Following sonication, 80 mg mL Bovine Serum Albumin solution was added dropwise maintaining 16:1 BSA: TiO2 mass ratio. Finally, the resulting aqueous mixtures were transferred to 5 mmol L−1 phosphate buffered saline (PBS), pH = 8 to yield a final particle concentration of 100 µg mL−1. When applied to NIST Standard Reference Material (SRM) 1898 this dispersion protocol yields a stable monomodal TiO2 suspension in PBS with an average particle diameter of about 75 nm. NIST SRM 1898 is a mixture of anatase (bandgap Eg = 3.2 eV) and rutile (Eg = 3.02 eV) phases in a ratio of an approximately 3:1. Both components of the mixture were activated by UVA light from the transilluminator, centered at λ = 365 nm (E = 3.4 eV), and providing irradiance at 5 mW cm−2. MNM suspension stability throughout the period of the assay is checked by monitoring its absorbance to confirm it does not change more than 5% at the maximum absorbance wavelength over 20 min., which is a sufficient period to perform the assay ().
Figure 2. Absorbance change of a 100 µg/ml TiO2 NM (SRM 1898) suspension in PBS, prepared according to Taurozzi, Hackley, and Wiesner (Citation2013).
3.2. Irradiance correction
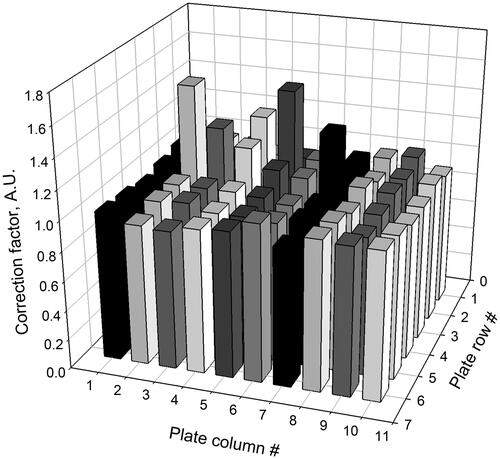
Illumination intensity variation between the 96-well plate wells can result in uneven irradiance and NADH oxidation rates causing a variability in the measured catalytic activities. Previously, this issue was addressed by performing the measurement by loading a separate full 96-well plate with a fixed nano catalyst concentration (Lee et al. Citation2011) and using the measured NADH conversion rates to adjust for the inter-well light intensity variations. We have measured the irradiation of each well by means of UV actinometry with 2-nitrobenzaldehyde as a photo-reagent (Willett and Hites Citation2000). First, a separate 96-well plate is loaded with a solution of 2-nitrobenzaldehyde at pH = 12 containing phenolphthalein, serving as a colorimetric pH indicator. Next, the plate is exposed to a trans-illuminator light (λ max = 365 nm) for 10 min and absorbance at 540 nm is recorded with a plate reader. Absorbance variation between plate wells corresponds to the pH change due to the differences in the photochemical conversion of 2-nitrobenzaldehyde into benzoic acid, which is dependent on the difference in the photon flux in each well. This provides the light intensity correction factors for individual wells and a way to compensate for the inhomogeneity of the UVA light source profile. Plate position on the trans-illuminator is then fixed using a cutout to ensure a similar light intensity pattern during the calibration and subsequent exposure of NADH and test NP combination.
A graphical representation sample of a light intensity correction factor pattern for the 96-well plate is presented in .
Figure 3. An example of light intensity correction factors, calculated from 2-nitrobenzaldehyde actinometry at each well of the 96-well plate reflecting the UV irradiation inhomogeneity.
3.3. Assay plate design and loading of the NADH solution
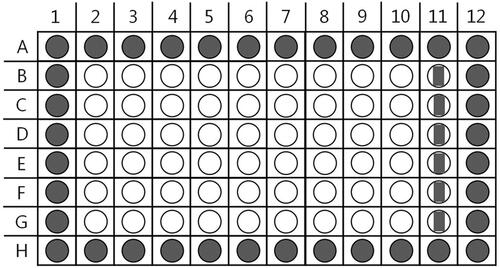
A biocompatible photocatalytic indicator, NADH is an ideal selection because it is efficiently oxidized by ROS (Vinogradov and Grivennikova Citation2016), which are produced by UVA illumination of MNMs. Only the reduced form of NAD emits fluorescence with λmax = 460 nm (Blacker and Duchen Citation2016) and is used here to evaluate its concentration change. However, the reduced form of NADH slowly autoxidizes in both dry and dissolved forms in the presence of atmospheric oxygen therefore introducing a significant variability in the measured kinetic constants. It is imperative to verify that the working concentration of NADH is close to 125 µmol L−1 by confirming its absorbance at λ = 339 nm immediately before loading into the 96-well plate. Next, 54 wells of the plate are filled with a constant concentration NADH solution and a series dilution of test nanoparticles in each of the nine plate columns (). Column #2 contains only the NADH solution, serving as a no-MNM control and column #11 as a mix of the stock MNM concentration and a buffer solution, used as a fluorescence background control. Such arrangement allows for six technical replicates (rows) for each loaded MNM concentration, ensuring statistical evaluation (Lee et al. Citation2011).
Figure 4. Schematic diagram of a 96-well plate for NADH photo-oxidation rate measurement at various MNM concentrations. Wells marked in white contain 100 µL of 250 µmol L−1 NADH solution and: buffer for col. 2, 100 µL NP suspension at C0 for col. 3, and a series dilution of 100 µL NP suspension in col. from 4 to 10. Col. 11 wells are filled with 100 µL NP suspension at C0+ 100 µL buffer (5 mmol L−1 PB, pH = 8) solution.
3.4. UV exposure
A plate, containing NADH and a series dilution of test MNMs is placed on a transilluminator surface and exposed to UVA in the next stage of the protocol. Exposure is performed in one-minute intervals, with a subsequent recording of the fluorescence at 460 nm following each exposure (λexc=340 nm). One minute exposure intervals avoid excessive sample heating and allow for the replenishment of dissolved oxygen during the pauses between the illumination. The UVA exposure continues until the initial NADH concentration decreases () below 50%, after which the slopes describing the rate of fluorescence intensity decrease are calculated for each well, including those containing no catalyst, and reflecting NADH autoxidation under UVA (col #2) (which is subsequently subtracted from catalyst MNM-induced decay slopes). At each time point starting with the first exposure minute, a proportion of fluorescence for that particular well with respect to the initial (0 min) value is computed ().
Figure 5. An example of kinetic evolution of the NADH fluorescence intensities depending on the TiO2 nanoparticle concentration, following 1 min exposures to the UVA light. Each data point corresponds to the average of the six technical replicates. Error bars correspond to one standard deviation from six replicate measurements.
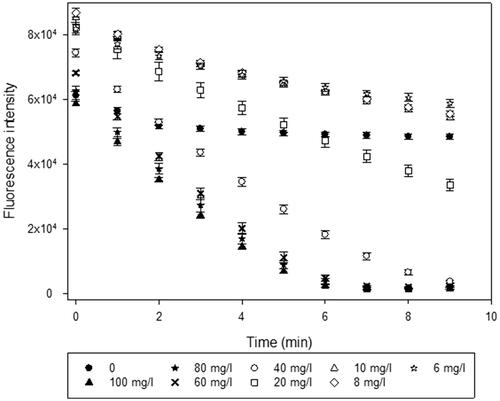
Figure 6. Linear fit to the NADH fluorescence intensity evolution following 1 min exposures to the UV light. Each data point corresponds to the actual reading from each well of the plate column.
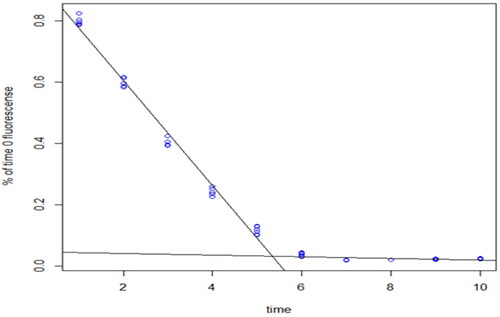
The measurements in each column (corresponding to a particular MNM concentration) as a function of time is fitted by a change-point regression, i.e. two separate linear regressions: one that fits the data up to the change point, and one that fits after the change point.
3.5. NADH equivalent specific PCA calculation
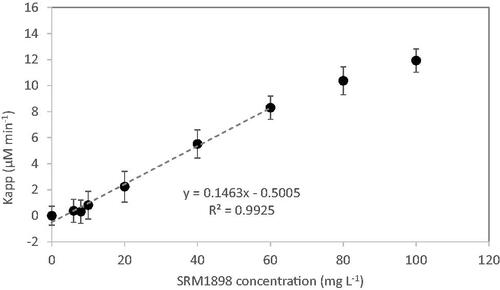
The slope of the first linear regression provides a parameter that is later used to calculate the apparent NADH photo-oxidation rate kinetic constant (kapp) obtained by multiplying the slope by the NADH stock concentration. As noted above, verifying the actual NADH concentration following the solution preparation by means of absorbance was found to noticeably reduce the kinetic constant variability between the testing laboratories. As a next step, the normalized kapp is plotted versus MNM concentration (expressed in mg L−1) up to the highest concentration within the linear range (). The slope of kapp vs MNM concentration gives the NADH photooxidation rate per unit mass of MNM in units of mmol min−1 g−1, and this value is termed as the ‘NADH equivalent specific PCA’ of the MNM.
Figure 7. NADH photo-oxidation rate as a function of NP concentration. The slope of the linear fit to this dependence is an end - point of the PCA measurement, termed the “NADH equivalent specific PCA of the MNM”. Error bars correspond to one standard deviation from six replicate measurements.
4. Discussion
The main advantages of this standard are its simplicity, ease of use, and robustness of the protocol. Use of 96-well plate allows to test a range of catalyst concentrations, saving time and materials. Because the NADH/NAD + redox couple is abundant in biological systems, it can track the oxidative stress caused by MNMs in physiological conditions, that way offering a screening tool for their phototoxicity potency.
The first step in the nanomaterial photocatalytic process is the absorption of the photon, which excites the valence band electron to the conduction band and produces a positively charged hole in the valence band, both producing ROS. Although the exact pathway of NADH oxidation by ROS is still not established (Hirst and Roessler Citation2016), it is believed that the major product of this reaction is NAD+, which can be tracked using absorbance or fluorescence (Lee et al. Citation2011). This simplifies photocatalysis product analysis, when compared to some other dyes, analysis of which often require more complex spectroscopic an/or chromatographic methods (Mills, Hill, and Robertson Citation2012).
At the initial stage of the NADH photocatalytic oxidation the reaction rate can be approximated to pseudo-linear kinetics. Fluorescence intensity monitoring without NADH separation from NP suspension is valid for the NADH concentration decrease rate measurement offering the means to quantify MNM PCA (Lee et al. Citation2011). This is true within the linear range of the apparent NADH photo-oxidation rate constant plot vs MNM concentration (), that way determining the upper limit for the MNM concentration. The lower limit of the test material concentration is specified at 5% of the stock MNM concentration, which is about 3 mg L−1 for TiO2 MNMs.
To account for gradual NADH auto-oxidation in the presence of atmospheric oxygen and potential weighing inaccuracies, this standard includes a condition to verify the NADH solution absorbance at λ = 339 nm prior to loading the 96-well plate. This reduces the measurement variability by ensuring the accurate entry of NADH concentration value when calculating the apparent photo-oxidation rate constant. Given the NADH photo-oxidation in the absence of MNM, a slope of the fluorescence decay in PBS solution is subtracted from catalyst MNM-induced fluorescence decay slopes.
Standardizing the irradiation conditions for the photocatalysis test is also critical for data comparison between laboratories. These include the spectral composition and irradiance of the test sample, which also depends on the sample distance from the light source. This ISO standard specifies a UV transilluminator as a light source, equipped with fluorescent lamps emitting radiation, centered at 365 nm. The power of such light source typically ranges from 4 to 6 mW cm−2 in the UVA spectral range and varies due to different manufacturing processes from various suppliers (Blume and Bloess Citation2014). The photon flux for each well of the 96-well plate is calibrated using a 2-Nitrobenzaldehyde actinometry procedure.
As an integral part of the standard development process in ISO TC 229, the measurement protocol was validated by conducting an interlaboratory comparison study. NIST served as a coordinator of the study and collected the raw NADH fluorescence data from six participating laboratories - National Institute of Standards and Technology (USA), National Metrology Institute of Japan, Korea Research Institute of Standards and Science, Thailand Metrology Institute, Arizona State University, and Chung-Ang University (Korea). A well characterized MNM (https://www-s.nist.gov/srmors/certificates/1898.pdf) (Hackley and Stefaniak Citation2013) () was distributed to six laboratories along with the prescribed dispersion procedure, published in (Taurozzi, Hackley, and Wiesner Citation2013).
Table 1. Properties of SRM1898, used in the PCA interlaboratory comparison study (from https://www-s.nist.gov/srmors/certificates/1898.pdf).
Study participants used the equipment available within their laboratories and procured reagents from various vendors except for the dry TiO2 nanomaterial SRM 1898, which was supplied by NIST. Experimental data in the form of the NADH fluorescence values following 1 min UVA exposures was collected in MS EXCEL format and statistically processed by the NIST Statistical Engineering Division who also performed the calculation of the SRM 1898 photocatalytic activity toward NADH oxidation consensus value (). As required by the standard protocol, the stock (maximum) MNM concentration in a test suspension was limited by its maximum absorbance value in the spectral range from 300 to 800 nm specified to be within 1.4 and 1.6. This resulted in variation of the initial MNM concentration among the participating laboratories (). Similarly, the actual NADH concentrations were calculated from the absorbance at λ = 339 nm, measured prior to loading of the 96-well plates.
Table 2. Stock TiO2 MNM and NADH concentrations, as prepared by the participating laboratories.
The following linear regression model was applied to fit each laboratory’s data, starting at MNM concentrations above 10 mg L−1:
(1)
(1)
Fitting was conducted using Bayesian Markov Chain Monte Carlo analysis. The standard uncertainty is the standard deviation of the posterior probability distribution of the parameter b. also shows the 95% uncertainty interval with the median, because for some laboratories the posterior distribution was not symmetric. The main source of uncertainty in b is uncertainty of the fit, as well as the uncertainty of the ratio of the two slopes (
Table 3. Estimates of slope for the regression of on .
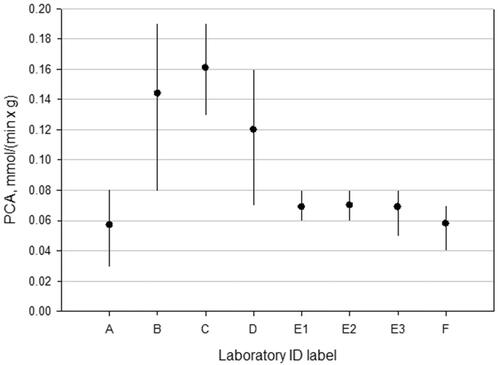
We found that the absolute value of the NADH equivalent Specific Photocatalytic Activity (PCA) of NIST SRM 1898 (TiO2 NP) was within 95% uncertainty bounds for most of the study participants indicating the assay robustness independent of variations in local equipment and condition (). This consensus value of the parameter was obtained using a random effects meta-analysis (Koepke et al. Citation2017). The inter-laboratory testing concluded the NADH equivalent Specific Photocatalytic Activity of NIST SRM1898 TiO2 MNM was this particular b = 0.10 ± 0.02 mmol min−1 g−1
Figure 8. Values of NADH equivalent Specific Photocatalytic Activity (PCA) of NIST SRM 1898 (TiO2 NP) with 95% expanded uncertainty bounds measured during the interlaboratory comparison study. Laboratory E has contributed three sets of data acquired at different times to test repeatability.
Based on this interlaboratory comparison study, the b value was appended to the SRM 1898 certificate of analysis as the capacity of a material to promote a specific photochemical reaction under defined conditions. Potentially SRM 1898 can be utilized as a positive control when performing photocatalytic activity assays with other MNMs by means of this standard protocol.
5. Conclusion
Due to a vast number of MNM types, a variety of standardized safety tests must be developed to facilitate their acceptance by the market and regulatory agencies. A significant segment of current nanomaterials possesses photocatalytic activity when exposed to light, in particular the UV wavelength component of the sunlight. While such properties are often sought by material design, e.g. for chemical or biological decontamination and photodynamic therapies, they can potentially lead to phototoxicity and adversely affect living organisms. A rapid, affordable and robust screening method for potential phototoxicity is therefore highly desirable. Standardized tests of the photocatalytic activity for larger particle size powder materials were available, however they are not directly applicable to MNMs due to requirements of large material quantities, suspension volumes and lengthy measurement procedures, including catalyst separation after light exposure. Moreover, to be suitable for potential phototoxicity screening, these tests should be conducted close to physiological conditions. These concerns were addressed in the new international photocatalytic activity measurement standard ISO 20814:2019, developed specifically for MNMs, that uses NADH as an indicator for cumulative ROS production upon illumination. The main advantage of this procedure is that it requires only milligram quantities of the MNM, uses simple equipment, does not require catalyst separation and takes only a couple of hours to perform. The multiplex platform based on 96-well plate allows to test MNM PCA for eight concentrations simultaneously. The stock (maximum) MNM concentration in a test suspension was limited by its maximum absorbance value in the spectral range from 300 to 800 nm specified to be within 1.4 and 1.6 to minimize the internal filter effects. A twenty times diluted MNM stock suspension corresponded to the lower suspension concentration limit.
MNM PCA measurement protocol was tested during an interlaboratory comparison study among six laboratories using NIST SRM 1898 (Titanium dioxide nanomaterial). The repeatability and reproducibility of the protocol was confirmed when the absolute value of the NADH equivalent Specific Photocatalytic Activity (PCA) of SRM 1898 was within 95% uncertainty bounds for most of the study participants, indicating a level of assay robustness that is independent of variations in local equipment, operators and conditions. Together, the PCA value for SRM 1898 and the ISO standard offers a system of traceable measurements that enable environmental and health risk assessments of MNMs that exhibit photocatalytic activity. In vitro photo-toxicity mechanisms vary widely, but a main presumption has been that ROS induces redox interactions with cellular components. By measuring the cumulative ROS production upon illumination, it may be possible to gauge the potency of the agent for photo-toxicity. As a next step, it is necessary to develop a standardized in vitro biological assay for UV exposed cells, as currently available standardized phototoxicity procedure (OECD guidance #432), adopted for soluble chemicals is not applicable to MNM.
Disclosure statement
No potential conflict of interest was reported by the author(s). Certain commercial equipment, instruments and materials are identified in this paper to specify and experimental procedure as completely as possible. In no case does the identification of particular equipment or materials imply a recommendation or endorsement by the National Institute of Standards and Technology nor does it imply that materials, instruments, or equipment are necessarily the best available for the purpose.
Correction Statement
This article has been corrected with minor changes. These changes do not impact the academic content of the article.
Additional information
Funding
References
- Beegam, M. S., S. B. Narendranath, and P. Periyat. 2017. “Tuning of Selective Solar Photocatalysis by Mn2+ Decorated Nanocrystalline Mesoporous TiO2.” Solar Energy 158: 774–781. doi:10.1016/j.solener.2017.10.046.
- Bhat, S. S. M., D. Swain, M. Feygenson, J. C. Neuefeind, A. K. Mishra, J. L. Hodala, C. Narayana, G. V. Shanbhag, and N. G. Sundaram. 2017. “Bi4TaO8Cl Nano-Photocatalyst: Influence of Local, Average, and Band Structure.” Inorganic Chemistry 56 (10): 5525–5536. doi:10.1021/acs.inorgchem.6b01970.
- Blacker, T. S., and M. R. Duchen. 2016. “Investigating Mitochondrial Redox State Using NADH and NADPH Autofluorescence.” Free Radical Biology & Medicine 100: 53–65. doi:10.1016/j.freeradbiomed.2016.08.010.
- Blume, E., and S. P. Bloess. 2014. “Experimental Approach of Irradiation Conditions for Photocatalytical Tests.” Catalysis Today 230: 240–244. doi:10.1016/j.cattod.2013.12.034.
- Ceridono, M., P. Tellner, D. Bauer, J. Barroso, N. Alepee, R. Corvi, A. DE Smedt, et al. 2012. “The 3T3 Neutral Red Uptake Phototoxicity Test: Practical Experience and Implications for Phototoxicity testing - The Report of an ECVAM-EFPIA Workshop.” Regulatory Toxicology and Pharmacology : RTP 63 (3): 480–488.
- Ferin, J., G. Oberdorster, D. P. Penney, S. C. Soderholm, R. Gelein, and H. C. Piper. 1990. “Increased Pulmonary Toxicity of Ultrafine Particles.1. Particle Clearance, Translocation, Morphology.” Journal of Aerosol Science 21 (3): 381–384. doi:10.1016/0021-8502(90)90064-5.
- Friehs, E., Y. Alsalka, R. Jonczyk, A. Lavrentieva, A. Jochums, J. G. Walter, F. Stahl, T. Scheper, and D. Bahnemann. 2016. “Toxicity, Phototoxicity and Biocidal Activity of Nanoparticles Employed in Photocatalysis.” Journal of Photochemistry and Photobiology C: Photochemistry Reviews 29: 1–28. doi:10.1016/j.jphotochemrev.2016.09.001.
- Hackley, V. A., and A. B. Stefaniak. 2013. “Real-World" Precision, Bias, and between-Laboratory Variation for Surface Area Measurement of a Titanium Dioxide Nanomaterial in Powder Form.” Journal of Nanoparticle Research 15: 1742. doi:10.1007/s11051-013-1742-y.
- Hatto, P. 2009. “International Standards for Risk Management in Nanotechnology.” Nature Nanotechnology 4 (4): 205–205. doi:10.1038/nnano.2009.25.
- Hirst, J., and M. M. Roessler. 2016. “Energy Conversion, Redox Catalysis and Generation of Reactive Oxygen Species by Respiratory Complex I.” Biochimica et Biophysica Acta (BBA) – Bioenergetics 1857 (7): 872–883. doi:10.1016/j.bbabio.2015.12.009.
- Huygevoort, T. V., J. Latour, P. V. Sas, K. Scase, and H. Emmen. 2016. “Refinement of the ICH S10 Guideline: Selection of a Pigmented or a Non-Pigmented Animal Model in Relation to the Melanin Binding Capacity of Drugs for the Assessment of Phototoxicity.” Toxicology Letters 258: S196–S197. doi:10.1016/j.toxlet.2016.06.1719.
- Kahru, A., H. C. Dubourguier, I. Blinova, A. Ivask, and K. Kasemets. 2008. “Biotests and Biosensors for Ecotoxicology of Metal Oxide Nanoparticles: A Minireview.” Sensors 8 (8): 5153–5170. doi:10.3390/s8085153.
- Kamalakkannan, J., V. L. Chandraboss, B. Karthikeyan, and S. Senthilvelan. 2016a. “Synthesis of InMoO3-TiO2 Nanocomposite – Photocatalysis of Genotoxic Dye Multiapplication Study.” Ceramics International 42 (8): 10197–10208. doi:10.1016/j.ceramint.2016.03.138.
- Kamalakkannan, J., V. L. Chandraboss, B. Loganathan, S. Prabha, B. Karthikeyan, and S. Senthilvelan. 2016b. “TiInCrO6-Nanomaterial Synthesis, Characterization and Multi Applications.” Applied Nanoscience 6 (5): 691–702. doi:10.1007/s13204-015-0474-y.
- Kao, S. M., A. N. Asanov, and P. B. Oldham. 1998. “A Comparison of Fluorescence Inner-Filter Effects for Different Cell Configurations.” Instrumentation Science & Technology 26 (4): 375–387. doi:10.1080/10739149808001906.
- Kathawala, M. H., Xiong, S. J., Richards, M., Ng, K. W., George, S., and Loo, S. C. J. 2013. “Emerging in Vitro Models for Safety Screening of High-Volume Production Nanomaterials under Environmentally Relevant Exposure Conditions.” Small 9 (9–10): 1504–1520.
- Kim, H. I., H. N. Kim, S. Weon, G. H. Moon, J. H. Kim, and W. Choi. 2016. “Robust Co-Catalytic Performance of Nanodiamonds Loaded on WO3 for the Decomposition of Volatile Organic Compounds under Visible Light.” ACS Catalysis 6 (12): 8350–8360. doi:10.1021/acscatal.6b02726.
- Koepke, A., T. Lafarge, A. Possolo, and B. Toman. 2017. “Consensus Building for Interlaboratory Studies, Key Comparisons, and Meta-Analysis.” Metrologia 54 (3): S34–S62. doi:10.1088/1681-7575/aa6c0e.
- Kulkarni, C. A., and P. S. Brookes. 2019. “Cellular Compartmentation and the Redox/Nonredox Functions of NAD(+).” Antioxidants & Redox Signaling 31 (9): 623–642. doi:10.1089/ars.2018.7722.
- Lee, N. A., S. J. Kim, B. J. Park, H. M. Park, M. Yoon, B. H. Chung, and N. W. Song. 2011. “Development of Multiplexed Analysis for the Photocatalytic Activities of Nanoparticles in Aqueous Suspension.” Photochemical & Photobiological Sciences 10 (12): 1979–1982. doi:10.1039/c1pp05244f.
- Lei, W. Y., T. T. Zhang, P. Liu, J. A. Rodriguez, G. Liu, and M. H. Liu. 2016. “Bandgap- and Local Field-Dependent Photoactivity of Ag/Black Phosphorus Nanohybrids.” ACS Catalysis 6 (12): 8009–8020. doi:10.1021/acscatal.6b02520.
- Lipovsky, A., Y. Nitzan, A. Gedanken, and R. Lubart. 2011. “Antifungal Activity of ZnO Nanoparticles-the Role of ROS Mediated Cell Injury.” Nanotechnology 22 (10):105101. doi:10.1088/0957-4484/22/10/105101.
- Maurer, T. 1987. “Phototoxicity Testing – In Vivo and In Vitro.” Food and Chemical Toxicology 25 (5): 407–414. doi:10.1016/0278-6915(87)90177-3.
- Mills, A., C. Hill, and P. K. J. Robertson. 2012. “Overview of the Current ISO Tests for Photocatalytic Materials.” Journal of Photochemistry and Photobiology A: Chemistry 237: 7–23. doi:10.1016/j.jphotochem.2012.02.024.
- Petersen, E. J., C. Hirsch, J. T. Elliott, H. F. Krug, L. Aengenheister, A. T. Arif, A. Bogni, et al. 2020. “Cause-and-Effect Analysis as a Tool to Improve the Reproducibility of Nanobioassays: Four Case Studies.” Chemical Research in Toxicology 33 (5): 1039–1054. doi:10.1021/acs.chemrestox.9b00165.
- Rasmussen, K., H. Rauscher, P. Kearns, M. Gonzalez, and J. R. Sintes. 2019. “Developing OECD Test Guidelines for Regulatory Testing of Nanomaterials to Ensure Mutual Acceptance of Test Data.” Regulatory Toxicology and Pharmacology 104: 74–83.
- Satra, J., P. Mondal, U. K. Ghorui, and B. Adhikary. 2019. “In Situ Systematic Metallic Gold Incorporation to Optimize the Photon Conversion Efficiency of AgInS2 Thin Film Semiconductor.” Solar Energy Materials and Solar Cells 195: 24–33. doi:10.1016/j.solmat.2019.02.017.
- Schulte, P. A., V. Leso, M. Niang, and I. Iavicoli. 2019. “Current State of Knowledge on the Health Effects of Engineered Nanomaterials in Workers: A Systematic Review of Human Studies and Epidemiological Investigations.” Scandinavian Journal of Work, Environment & Health 45 (3): 217–238. doi:10.5271/sjweh.3800.
- Singh, A. V., P. Laux, A. Luch, C. Sudrik, S. Wiehr, A. M. Wild, G. Santomauro, J. Bill, and M. Sitti. 2019. “Review of Emerging Concepts in Nanotoxicology: Opportunities and Challenges for Safer Nanomaterial Design.” Toxicology Mechanisms and Methods 29 (5): 378–387. doi:10.1080/15376516.2019.1566425.
- Taurozzi, J. S., V. A. Hackley, and M. R. Wiesner. 2013. “A Standardised Approach for the Dispersion of Titanium Dioxide Nanoparticles in Biological Media.” Nanotoxicology 7 (4): 389–401. doi:10.3109/17435390.2012.665506.
- Vinogradov, A. D., and V. G. Grivennikova. 2016. “Oxidation of NADH and ROS Production by Respiratory Complex I.” Biochimica et Biophysica Acta (BBA) – Bioenergetics 1857 (7): 863–871. doi:10.1016/j.bbabio.2015.11.004.
- Willett, K. L., and R. A. Hites. 2000. “Chemical Actinometry: Using O-Nitrobenzaldehyde to Measure Light Intensity in Photochemical Experiments.” Journal of Chemical Education 77 (7): 900–902. doi:10.1021/ed077p900.
- Yin, H., T. Tsuzuki, K. R. Millington, and P. S. Casey. 2014. “A Comparative Interlaboratory Study on Photocatalytic Activity of Commercial ZnO and CeO2 Nanoparticles.” Journal of Nanoparticle Research: 16: 2641 doi:10.1007/s11051-014-2641-6.
- Yordanov, Y. I., V. I. Tzankova, and K. Yoncheva. 2018. “Nanotoxicology: Factors, Affecting Toxicity.” Pharmacia 65: 63–71.