
Abstract
The increasing use of graphene-based materials (GBM) requires their safety evaluation, especially in occupational settings. The same physico-chemical (PC) properties that confer GBM extraordinary functionalities may affect the potential toxic response. Most toxicity assessments mainly focus on graphene oxide and rarely investigate GBMs varying only by one property. As a novelty, the present study assessed the in vitro cytotoxicity and genotoxicity of six reduced graphene oxides (rGOs) with different PC properties in the human bronchial epithelial 16HBE14o − cell line. Of the six materials, rGO1-rGO4 only differed in the carbon-to-oxygen (C/O) content, whereas rGO5 and rGO6 were characterized by different lateral size and number of layers, respectively, but similar C/O content compared with rGO1. The materials were characterized by transmission electron microscopy, X-ray photoelectron spectroscopy, laser diffraction and dynamic light scattering, and Brunauer-Emmett-Teller analysis. Cytotoxicity (Luminescent Cell Viability and WST-8 assays), the induction of reactive oxygen species (ROS; 2′,7′-dichlorofluorescin diacetate-based assay), the production of cytokines (enzyme-linked immunosorbent assays) and genotoxicity (comet and micronucleus assays) were evaluated. Furthermore, the internalization of the materials in the cells was confirmed by laser confocal microscopy. No relationships were found between the C/O ratio or the lateral size and any of the rGO-induced biological effects. However, rGO of higher oxygen content showed higher cytotoxic and early ROS-inducing potential, whereas genotoxic effects were observed with the rGO of the lowest density of oxygen groups. On the other hand, a higher number of layers seems to be associated with a decreased potential for inducing cytotoxicity and ROS production.
1. Introduction
Graphene-based materials (GBM) consist of a diverse family of two-dimensional carbon-based nanomaterials that have raised high expectations during the last decades in the nanotechnology field (Bianco et al. Citation2013; Chee et al. Citation2016; Mahmoudi, Wang, and Hahn Citation2018; Wick et al. Citation2014). GBM are characterized by an enormous surface area, huge thermal conductivity, outstanding electron mobility, extraordinary strength and flexibility, high transparency, and significant stability, making them interesting for multiple applications (Anichini and Samorì Citation2021). The use of GBM ranges from batteries development, supercapacitors and solar cells to food packaging, screens, wind protective coatings, biomedicine, and imaging (Brownson, Kampouris, and Banks Citation2011; Guo et al. Citation2021; Magne et al. Citation2022; Park et al. Citation2017; Tarelho et al. Citation2018).
GBM can be classified into graphene oxide (GO), reduced graphene oxide (rGO), few-layer graphene (FLG), graphene nanosheets and flakes, and graphene ribbons and dots depending on their physico-chemical descriptors, such as a number of graphene layers, the average lateral size, and the carbon-to-oxygen (C/O) ratio (Bianco et al. Citation2013; Geim and Novoselov Citation2007; Wick et al. Citation2014). Among GBM, GO stands out as the most widely used and biologically relevant material because of its good dispersibility in organic solvents and matrices, as well as its efficient functionalization (Achawi et al. Citation2021; Ray Citation2015; Reina et al. Citation2017). Starting from GO, rGO can be obtained by the removal of some oxygen-bearing functional groups using reducing agents or thermal reduction methods (Huang et al. Citation2011; Pei and Cheng Citation2012; Razaq et al. Citation2022). By controlling the number of the remaining oxygen-containing functional groups, it is possible to modulate the dispersibility and electrical performance of rGO, making it suitable for different applications such as solar cells, energy applications, biosensors, drug delivery systems and the production of composite paper-like materials (Ray Citation2015; Razaq et al. Citation2022).
The increasing applications of GBM in new nanotechnologies should keep pace with the safe use of these nanomaterials (Bianco and Prato Citation2015; Ruijter et al. Citation2023). The main human health risks deal with occupational exposure and one of the most significant and studied routes is inhalation (Pelin et al. Citation2018). Although the amount of published data on the health effects of GBM have increased a lot in last years (i.e. see reviews by Domenech et al. Citation2022; Fadeel et al. Citation2018; Pelin et al. Citation2018), there are still plenty of safety-related uncertainties. As with other nanomaterials, the same physico-chemical (PC) properties that confer GBM extraordinary functionalities may also guide the interaction with biological systems, affecting the potential toxic response (Magne et al. Citation2022). Unfortunately, the broad variability of materials, which are often poorly characterized (Achawi et al. Citation2021; Pelin et al. Citation2018), and of cellular systems used, preclude the identification of PC parameters that could drive the toxic response of GBM (Bianco et al. Citation2013; Domenech et al. Citation2022). Among the most studied PC properties, degree of oxidation, thickness, agglomeration, and size play a relevant role on toxicity, although in the latter case the available information is contradictory regarding the observed effects (Achawi et al. Citation2021). As concerns rGO toxicity, in vitro studies have reported an influence of the reduction method used, lateral size and oxygen-containing functional groups (Akhavan, Ghaderi, and Akhavan Citation2012; Mittal et al. Citation2016; Ou et al. Citation2021). However, the vast majority of evaluations, which were mainly performed with GO, did not investigated materials varying only by one property to highlight its specific toxicity impact; and they did usually not consider more than one single property.
The aim of the present study was to evaluate the influence of different PC properties of rGO on the in vitro toxic effects toward human bronchial epithelial cells. Firstly, we evaluated four rGO characterized by different C/O ratios. Based on the results, two additional rGO, characterized by different lateral size and number of layers, but similar oxygen content than one of the previously investigated rGO, were also assessed.
2. Materials and methods
2.1. Testing materials
2.1.1. Production of the reduced graphene oxide
Six different rGO in powder form were prepared by thermochemical reduction of graphene oxide.
Graphite batches preparation. Natural graphite (NGS-Naturgraphit) was consecutively sieved with a 40–60 and a 450 sized meshes, renting two different fractions (GR1 and GR2, respectively) that were used to prepare graphene oxide. GR1 had a particle size between 425 and 250 µm, whereas the particle size of GR2 was below 32 µm.
Graphene oxide preparation. Different samples of graphene oxide (GO) were prepared using a modified Hummers’ method in H2SO4. GO1 was prepared from the GR1 fraction using a proportion of graphite/KMnO4/NaNO3 of 1:3.75:0.25. The mixture was placed inside a reactor, whose temperature was kept between 0 and 4 °C during the addition of oxidative agents (72 h). After that, the solution was slowly warmed up to 20 °C and maintained for an additional 72-h reaction. To remove the excess of MnO4−, H2O2 solution was added to the reaction mixture and stirred overnight. After sedimentation, the solution was washed with a mechanical stirred HCl 4% wt solution for 2 h. The solid component was filtered off, obtaining wet graphite oxide. Wet Graphite oxide was then dispersed in osmotic water (1% wt based on dry graphene oxide) and stirred in a Dispermat LC75 (Lumaquim, Montomes del Valles, Spain) using a cowles helix, first at 1000 rpm for 10 min, and then, at 20,000 rpm for 60 s. The resulting dispersion was ultrasonicated with a UP400S (HIELCHER, Berlin, Germany) for 45 min using an H22 sonotrode (HIELCHER, Berlin, Germany) with 90% of amplitude and full cycle condition to exfoliate the graphite oxide and obtain a water based GO1 dispersion.
Graphene oxide GO2 was prepared using the same procedure as described above but starting from the lower particle sized GR2 fraction.
Graphene oxide GO3 was prepared using of the same method as GO1 but reducing the time of ultrasonication to 20 min with the aim to obtain higher thickness graphene oxide (Gómez et al. Citation2017).
Reduced graphene oxide preparation. Ascorbic acid (8.75 g) was added to the GO dispersions (10 g in 1.75 l of water) and the mixture was refluxed overnight at atmospheric pressure. The solid component was filtered off and air-dried. For the preparation of the thermochemically reduced rGOs, the chemically reduced GO was placed in an oven under an Ar atmosphere for 20 min and heated in the following way: rGO1, rGO5, and rGO6 at 1000 °C (starting from GO1, GO2 and GO3, respectively), and rGO2, rGO3, and rGO4 at 700 °C, 500 °C and 200 °C, respectively (the three of them starting from GO1).
2.1.2. Characterization of the tested materials
2.1.2.1. X-ray photoelectron spectroscopy (XPS)
XPS analysis was carried out using an ESCAPROBE P (Omnicron, Uppsala, Sweden) with non-monochromatized MgK radiation (1253.6 eV) photoelectron spectrometer; the X-ray source operated at 300 W. The residual pressure was lower than 10 − 9 Pa during the spectra collection. The binding energy was referenced to the Au 4f 7/2 line at 84.37 eV.
2.1.2.2. Laser diffraction & Dynamic Light Scattering (DLS)
The flake lateral size was determined in a dry state by laser diffraction technique using a Mastersizer 2000 (Malvern Pananalytical, Malvern, UK), and, in the case of rGO5, also by DLS from a water dispersion using 90Plus (Brookhaven, Holtsville, USA).
2.1.2.3. Raman micro spectroscopy
Raman spectra were recorded on a confocal inVia Raman microscope (Renishaw, Wotton-under-Edge, UK) at room temperature. The system is equipped with a CCD detector and a holographic notch filter, using an excitation wavelength of 532 nm. Scans were acquired from 1000 to 3400 cm−1, performing maps of 25 spectra on sample pellets. Sample pellets were prepared by pressing rGO powders in a 13 mm diameter mold at 5 tonne/cm2. Spectra analysis and deconvolution were performed using Wire 4.2 software.
2.1.2.4. Specific surface area (SSA)
SSA of rGOs was determined by Brunauer-Emmett-Teller technique (BET) using an Autosorb-6 (Quantachrome instruments, Germany), where podwer rGO samples were degassed at 250 °C for 8 h.
2.1.2.5. Dispersion
A stock dispersion (1 mg/ml) of each rGO was prepared in water containing 0.1% bovine serum albumin (BSA; Sigma–Aldrich Chemie, Steinheim, Germany). The suspension was sonicated (44 ± 2 kHz) for 45 min, stopping the sonication process to mix by vortexing the mixture each 15 min. The stability of each stock dispersion was assessed by UV-visible spectrophotometric analysis, measuring absorbance at 660 nm up to 2 h. Then, the treatment suspensions were prepared by serial dilutions, and the pH value was measured at the highest test concentration (100 µg/ml), renting values between 7.5 and 8.0.
2.1.2.6. Transmission electron microscopy (TEM) analysis
For TEM analysis, dispersions of each rGO in cell culture media (Minimum Essential Medium, MEM) (Sigma Aldrich; Milan, Italy) were appropriately diluted in water and dropped on a lacey copper grid (100 µm, 300 mesh, coated with carbon film) and dried at room temperature to eliminate the solvent. Then, samples were evaluated using Philips EM208 TEM and RADIUS 2.0 software (EMSIS GmbH; Muenster, Germany). Lateral dimensions distributions were analyzed offline using the ImageJ software on at least 100 different flakes.
2.1.2.7. Endotoxin content
A modified version of the TNF-α expression test (TET assay) previously described, was performed to assess endotoxin contamination of GBMs, using macrophages obtained by differentiation of human THP-1 monocytes (Mukherjee et al. Citation2016). Briefly, THP-1 cells were differentiated using 50 nM phorbol-12-myristate-13-acetate (PMA) for 24 h and then exposed for 24 h to a non-cytotoxic concentration (1 µg/mL) of each rGO, in presence or absence of polymyxin B sulfate (10 µM). A standard curve was obtained by macrophages exposure to different concentrations of lipopolysaccharide (LPS; 0.01–100 ng/ml); as positive control, macrophages were exposed to 100 ng/ml LPS. After supernatants collection, TNF-α was quantified by a specific enzyme-linked immunosorbent assay (ELISA) kit, following the manufacturer’s instructions (Diaclone; Tema Ricerca, Bologna, Italy). LPS was quantified in each rGO on the basis of a standard curve generated on LPS-induced TNF-α release data. Data are reported as the mean LPS concentration (endotoxin units/ml) ± SE in each sample.
2.2. Cell lines and cell culture
The inmortalized human bronchial epithelial 16HBE14o- cell line was kindly donated by the laboratory of Dr. Grunet (University of California, San Francisco). Cells were grown in MEM (Minimum Essential Medium; Gibco, Paisley, UK) supplemented with penicillin/streptomycin (100 U/ml/100 µg/ml, Biowest, Nuaillé, France), 1% L-glutamine (Cytva, Marlborough, MA, USA) and 10% Fetal Bovine Serum (FBS, Gibco, Paisley, UK). Cells were maintained in a humidified atmosphere, at 37 °C and 5% CO2 and sub-cultured each 3–4 d when achieving 70–80% confluence.
THP-1 cells were cultured in RPMI-1640 supplemented with 10% FBS, 1% glutamine, 100 µg/ml penicillin/streptomycin at 37 °C under a humidified 95% air/ 5% CO2 atmosphere.
2.3. Cytotoxicity assessment
2.3.1. Luminescent Cell Viability Assay
The CellTiter-GloVR Luminescent Cell Viability Assay (Promega, Madison, WI, USA) was carried out according to the protocol detailed by the manufacturer (Promega Citation2023), and as previously described by Aimonen and colleagues (Aimonen et al. Citation2022). Cells were exposed to rGO suspensions for 3 and 24 h at nine doses: 0.4–100 µg/ml (0.12–31.25 µg/cm2). Untreated cells and cells treated with 0.1% Triton X-100 (Applichem, Darmstadt, Germany) were included as negative and positive controls, respectively. In addition, optical interference controls consisting in parallel wells containing the rGO materials without cells at the corresponding treatment concentrations were included in each experiment. All treatments were performed per quadruplicate, and each experiment was carried out three times. Cell viability was assessed by recording the luminescence using a plate reader (Fluoroskan Ascent FL, Vantaa, Finland) and expressed as the relative luminescence of the rGO-treated cultures in comparison to the negative control cultures.
2.3.2. WST-8 assay
After exposure to rGOs (0.4–100.0 μg/ml; equal to 0.25–62.5 μg/cm2), the effect on 16HBE14o − cells viability was assessed by the WST-8 assay using the Cell Counting Kit (CCK)-8 (Sigma Aldrich; Milan, Italy). Cells were washed twice in phosphate buffer saline (PBS), and 10 μl of WST-8 reagent in 100 μl of fresh medium were added per well for 4 h, as previously described (Pelin et al. Citation2017). Subsequently, absorbance was read at 450 nm using the automated microplate reader FLUOstar Omega (BMG LABTECH; Germany). Data are the mean ± SE of at least 3 independent experiments performed in triplicate and reported as % of cell viability in cells exposed to rGOs with respect to untreated control cells (negative control).
2.4. Induction of reactive oxygen species
The effects of rGOs on ROS production were evaluated by the 2′,7′-dichlorofluorescin diacetate (DCFDA) assay, as previously described (Pelin et al. Citation2017). After incubating cells with medium (100 μl/well) containing 100 μM DCFDA for 30 min, at 37 °C in the dark, cells were exposed to rGOs (0.4–25.0 μg/ml) in complete medium without phenol red. The highest concentrations (50.0 and 100.0 μg/ml) were excluded from the analysis due to the fluorescence quenching properties of the materials. A free radical initiator, 2,2′-Azobis (2-methylpropionamidine) dihydrochloride (AAPH, 1 mM; Sigma Aldrich; Milan, Italy), was used as a positive control. The fluorescence was read by the microplate fluorometer FLUOstar Omega (BMG LABTECH; Germany), at an excitation wavelength of 485 nm and an emission wavelength of 520 nm, instantly after the exposure to rGOs and at increasing exposure times (45 min–24 h). Data are the mean ± SE of at least 3 independent experiments performed in triplicate and are reported as % of ROS increase with respect to negative control (cells not exposed to rGOs).
2.5. Cytokine analyses
The pro-inflammatory response of 16HBE14o − cells exposed to rGO1 – rGO6 was evaluated using specific enzyme-linked immunosorbent assays (ELISA). 16HBE14o − cells were seeded in a T25 cell culture flask at the density of 106 cells/flask and incubated for 48 h at 37 °C and 5% CO2. Then, cells were exposed for 24 h to rGOs at the concentration of 10 μg/ml. Cells were exposed to 1 μg/ml LPS for 24 h, as positive control; 1 μg/ml MITSUI-7 Multiwall Carbon-Nanotubes (MWCNT; Mitsui & co., Ltd., Tokyo, Japan) was included as reference material. After exposure, supernatants were collected and the following pro-inflammatory mediators were quantified: interleukin (IL)-1α, IL-1β, IL-6, IL-8, IL-18, TNF-α, monocyte chemoattractant protein-1 (MCP-1), granulocyte-macrophage colony-stimulating factor (GM-CSF), interferon gamma (INF-γ), eosinophil chemotactic factor (ECF/CCL11), prostaglandin E2 (PG-E2), regulated upon activation normal T cell expressed and secreted (RANTES). Each mediator was quantified using a specific ELISA kit, following the manufacturer’s instructions; ELISA kits were provided by Diaclone (Tema Ricerca; Bologna, Italy) and by Elabscience (Milan, Italy).
2.6. Genotoxicity assessment
2.6.1. Comet assay
The induction of DNA strand breaks (SBs) and alkali labile sites (ALS) was assessed by the alkaline comet assay (pH > 13). Each experiment consisted of: (1) untreated cells (negative control), (2) cells treated with 6 concentrations of the rGOs: 1.5, 3, 6, 12, 25 and 50 µg/ml (0.35, 0.71, 1.42, 2.84, 5.68, 11.36 µg/cm2), (3) cells treated with 20 mM H2O2 (Riedel–de Haen, Seelze, Germany), as a positive control, and (4) interference controls. Interference controls consisted of parallel wells, containing cells that were mixed with the maximum concentration of each material, just before adding the agarose. All treatments were performed in duplicate, and each experiment was carried out twice.
A total of 1.5 × 10⁵ 16HBE14o-cells/well were plated in 48-well plates (Corning Inc. Corning, NY, USA) 24 h prior to exposure. Then, cells were exposed to the materials for 3 and 24 h. The comet assay was performed as previously described by Vales and colleagues (Vales et al. Citation2020). The slides were coded, stained with ethidium bromide (VWR, Radnor, PA, USA), and analyzed using a fluorescence microscope (Axioplan 2, Zeiss, Jena, Germany) and an interactive automated comet counter (Komet 5.5, Kinetic Imaging Ltd., Liverpool, UK). The induction of SBs and ALS was expressed as % of DNA in the comet tail. A total of 200 cells were analyzed per dose and experiment (two replicates per dose, two slides per replicate, 50 cells/slide).
2.6.2. Micronucleus assay
The induction of chromosome damage was assessed by the flow cytometry-based micronuclei (MN) assay using a CytoFLEX Flow Cytometer (Beckman Coulter Inc., Brea, CA, USA). The assay was carried out following the principles of the OECD TG 487 (OECD Citation2023) and based on the method described by García-Rodríguez and colleagues (García-Rodríguez et al. Citation2019). Cell viability was assessed within the assay using counting beads to determine the percentage of relative survival (RS) compared to one of the negative controls. RS was measured by calculating the healthy nuclei/counting bead ratio in the sample (Rodriguez-Garraus et al. Citation2022). Concentrations whose RS was under 40% were considered too cytotoxic and excluded from the MN analyses.
Each experiment consisted of: (1) untreated cells, as a negative control, (2) cells exposed to 6 concentrations of each material: 1.5, 3, 6, 12.5, 25 and 50 µg/ml (0.41, 0.82, 1.64, 3.28, 6.57, 13.15 µg/cm2), (3) cells exposed to Mitomycin C (MMC), as a positive control (50 ng/ml; 13.15 ng/cm2; Sigma–Aldrich Chemie, Steinheim, Germany) and (4) interference controls or spike-in wells. Each treatment was carried out per triplicate and each experiment was conducted once.
A total of 7 × 10⁴ 16HBE14o- cells/well were seeded in 48-well plates 24 h prior exposure. Then, the cultures were exposed to the corresponding treatment for 24 h. After that, the medium was removed, cells were washed three times with warm MEM containing 50% FBS in a shaker (75 rpm, 5 min), and the cultures were allowed to recover for 24 h in a fresh medium. Then, the plates were placed on ice for 20 min, the medium was removed and 150 µl of ethidium monoazide bromide (EMA; Life Technologies, Carlsbad, CA, USA) staining solution (0.125 mg/ml) was added per well. The samples were placed on ice again and a light source (11 W) was applied 15 cm above the wells for 30 min. Then, the samples were processed as previously described (García-Rodríguez et al. Citation2019). In brief, after washing, the samples were incubated with 150 μl lysis solution 1 at 37 °C in the dark for one hour. Then, 150 μL of lysis solution 2 and Cell Sorting Set-up Beads for blue lasers (Invitrogen, Waltham, Massachusetts, USA; 1 drop per 10 ml lysis solution 2) were added to each sample and incubated at room temperature in the dark for 30 min before the analysis. Samples were analyzed in the CytoFLEX Flow Cytometer using the Cyt expert software (version 2.4; Beckman Coulter Inc., Brea, CA, USA). The flow-cytometric gating strategy was based on the instructions of the In Vitro MicroFlow kit from Litron laboratories (Litron Laboratories, Rochester, New York, USA). For each sample, 150 μl volume was analyzed and a minimum of 20,000 nuclei were recorded. MN induction was calculated by dividing the events recorded in the MN region by the events recorded in the nuclei region and expressed as a fold increase relative to the negative control.
Due to the potential interferences GBM may pose in fluorescence-based assays (Park et al. Citation2017), several interference controls were introduced. Two spike-in controls were implemented to determine if interference with the staining procedure or readouts exist, as recommended by Franz and coworkers (Franz et al. Citation2020). Wells with 25 µg/mL of graphene were incubated in a medium (without cells) in order to mimic the dynamics and same processes that occur during the exposure period. Later, the incubated materials were added to particle-free cultures at two different time points, (1) after the EMA staining step (staining interference) or (2) briefly before the flow cytometer analysis (readout interference). In addition, as individual sheets or aggregates of rGOs may show a similar size/fluorescence profile as MN, an additional gate location control was introduced, in where cell exposure was carried out as previously described, but the cells were analyzed right after the removal of graphene. Any increase in MN frequency, without the recovery period, could indicate that the rGOs and MN might share overlapping location after the gating procedure.
2.7. Cellular uptake
Laser confocal microscopy was used to assess the cell internalization of the rGOs. To this aim, 6 × 10⁴ 16HBE14o- cells were seeded onto clean 16-mm ø coverslips (VWR international, Radnor, PA, United States), which were placed onto 12-well plates (Corning Inc. Corning, NY, United States) for 24 h. Afterwards, cells were exposed for 24 h to 12 and 25 µg/ml for all rGOs except rGO3, which was only exposed to 12 µg/ml due to its lower relative survival rate in the micronucleus assay. After exposure, cells were stained in the dark, using CellMask™ Deep Red plasma membrane stain solution (1:1000, 5 µg/ml, in DPBS, 37 °C, 10 min; Thermofisher Scientific, Waltham, MA, United States). Then, the coverslips were fixed in 4% formaldehyde in DPBS (37 °C, 10 min) and stained using Hoechst 33 342 nuclei staining solution (5 µg/ml in DPBS, 37 °C, 10 min, Invitrogen, Waltham, MA, USA). Cells were washed three times in DPBS after each step. Then, the coverslips were mounted on super frost slides (VWR international, Radnor, PA, United States) using Vectashield (Vector Laboratories Inc, Burlingame, CA, United States) and sealed with nail polish.
Images were obtained by a confocal laser scanning microscope Carl Zeiss LSM 510 (Zeiss, Oberkochen, Germany) using the 405 nm (Hoechst 33 342 staining, nuclei), 543 nm (graphene material) and 630 nm (CellMask™ staining, membrane) lasers and a 40x magnification objective. The graphene materials were observed due to their own light reflective properties. Confocal images were obtained and processed using the Zen 2008 software (Zeiss, Oberkochen, Germany).
2.8. Statistical analysis
All statistical analyses were performed using the GraphPad prism version 9.3.1 for Windows (GraphPad Software, San Diego, CA, USA). In all cases, the effects were considered significant if p < 0.05. Results of the cytotoxicity assays (Luminescent cell viability and WST-8) and ROS were analyzed by a two-way analysis of variance (ANOVA), considering type and concentration of rGO, followed by Bonferroni’s post-test. Cytokines quantification data were analyzed by a one-way ANOVA analysis followed by Bonferroni’s post-test. Regarding genotoxicity results, for data normally distributed and showing homogeneity of variance, an unpaired one-tailed t-test was used for comparisons between the positive and negative control groups, whereas one-way ANOVA followed by Dunnett’s multiple tests was applied to assess whether any of the concentrations significantly differed from the corresponding zero control. For non-parametric data, the unpaired one-tailed Mann Whitney test or the Kruskal-Wallis test followed by Dunn’s multiple test was used, respectively. In addition, dose–response relationships were evaluated by linear regression analysis.
3. Results
3.1. Physico-chemical characterization
shows the PC properties of the six different rGOs. The C/O content of rGO1-rGO4 varied by a > 7-fold factor (from 52.6 to 7.1). On the other hand, rGO5 and rGO6 showed a C/O content (45.5 and 66.7, respectively) similar to that of rGO1 (52.6).
Table 1. Physico-chemical properties of the studied reduced graphene oxides (rGO).
According to the measurements provided by the laser diffraction analyses performed in dry form, all rGO showed a similar average lateral size (39–43 µm) except rGO5, whose lateral size was much smaller (50% of the particles had a lateral size below 1 µm, D50 < 1 µm). A more precise estimation of the lateral size of rGO5 was obtained by DLS, renting an average lateral size of 382 nm.
The number of graphene layers in a stack (NG) can be determined through SSA measured by BET (NG = 2600/SSA) (Guo et al. Citation2014). In the case of rGO1, rGO2, rGO3 and rGO4, the average thickness determined by the NG scaling law (2600/SSA) corresponded to ∼4 layers. The value was slightly higher for rGO5 (∼5 layers), probably due to the higher surface area loss by irregular restacking due to the lower lateral size (Guo et al. Citation2014). On the other hand, rGO6 showed the highest average number of layers (∼8), as expected.
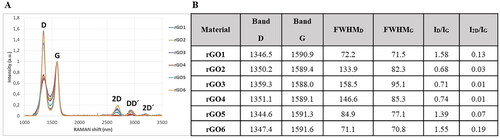
The structural quality of rGO was further investigated by Raman spectroscopy, a well-known technique to evaluate defectiveness in GBM. As shown in , two main sets of signals were observed in rGO samples. The first order of signal (1200–1700 cm−1) is composed of D, G, and D′ bands. The D band is related to the breathing modes of six-atom rings, and it requires a defect for activation, while the G band is ascribed to the in-plane stretching vibration mode of sp2 carbon atoms (Ferrari and Basko Citation2013). In the second order, 2D band, DD′ and 2D’ band were clearly observed in the rGOs with lower oxygen content (rGO1, rGO5 and rGO6), whereas they were not observed in the materials with higher oxygen content (rGO2, rGO3 and rGO4). It is well established that the relative intensity of D band to the G band (ID/IG), and the full width at half maximum of the D and G bands (FWHMD, FWHMG) can be associated with the disorder of graphene material network (Ferrari and Basko Citation2013). The ID/IG ratio was similar for rGO1, rGO5, and rGO6 (1.58, 1.39, and 1.55, respectively), but significantly higher than that observed for rGO2, rGO3 and rGO4 (0.68, 0.71, and 0.74, respectively). On the other hand, the FWHM in D dropped from 84.9 for rGO5 to 72.2 and 71.1 for rGO1 and rGO6, respectively, which is in agreement with an increase of edge defects, due to the lower particle size (Chee et al. Citation2012). FWHM in G was quite similar in these three rGOs. On the other hand, rGO2, rGO3 and rGO4 showed higher FWHMD and FWHMG values, which indicated that these rGO have a higher number of defects.
Figure 1. Raman spectroscopy structural analysis bands in Graphical form (A) and numerical values (B). FWHM: full width at half maximum; I: intensity of band.
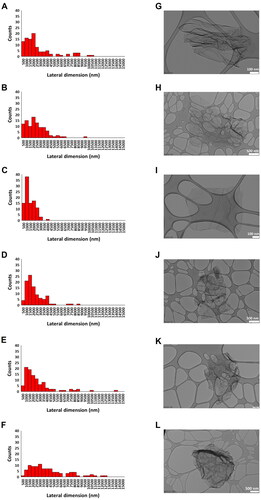
Lateral dimensions of all materials were also computed by TEM analyses, as illustrated in , where representative images of the materials are also shown. The lateral size distribution was located between 280 and 10 499 nm with an average lateral dimension of 2387 ± 2278 nm for rGO1 (), between 165 and 9089 nm with an average lateral dimension of 2083 ± 1483 nm for rGO2 (), between 169 and 3573 nm with an average lateral dimension of 1191 ± 692 nm for rGO3 (), between 274 and 8140 nm with an average lateral dimension of 1927 ± 1403 nm for rGO4 (), between 380 and 13 655 nm with an average lateral dimension of 2368 ± 2245 nm for rGO5 () and between 449 and 16 659 nm with an average lateral dimension of 4282 ± 3381 nm for rGO6 (). Discrepancies between dimensions measured by TEM and laser diffraction analyses may be due to the physical status of materials during acquisition (i.e. water-diluted dispersions in protein-containing cell media and dry powder, respectively) as well as by the repeated water dilutions of cell media dispersions to allow TEM visualization which may have selected bigger flakes.
Figure 2. Lateral dimension distribution of reduced graphene oxides (rGOs). size distributions were calculated from the dimensional analysis of transmission electron microscope (TEM) images (A–F) through the ImageJ software. Pictures show representative TEM images (G–L) of rGO1 (A,G), rGO2 (B,H), rGO3 (C,I), rGO4 (D,J), rGO5 (E,K) and rGO6 (F,L). scale bar: 500 nm (H,J,L); 200 nm (K); 100 nm (G,I).
The stability of each material dispersion in 0.1% BSA (1 mg/ml) was assessed by UV-visible spectrophotometric analysis, measuring absorbance at 660 nm up to 2 h. Regarding rGO1, rGO2, rGO3, rGO4 and rGO5, flakes dispersion appeared almost completely stable up to 2 h. On the contrary, as regards rGO6 dispersion, its stability was almost maintained within the first hour, with a slight decrease within 2 h (Supplementary Materials, Figure S1) attributed to its higher thickness.
3.2. Determination of endotoxin content
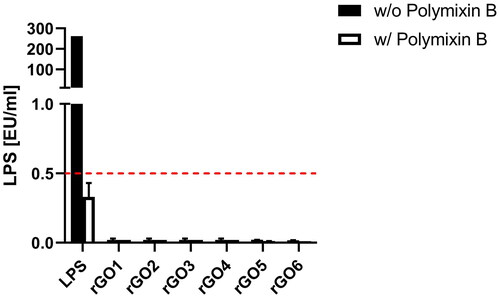
To exclude any endotoxin contamination of rGOs, a TET assay was performed on differentiated THP-1 cells. Endotoxin contamination can be excluded if LPS quantitation in macrophages exposed to the material is equivalent in the presence or absence of polymyxin B sulfate, suggesting that the observed effect is an intrinsic feature of the material. By contrast, if LPS quantitation is significantly reduced or even abolished in the presence of polymyxin B, the material is endotoxin contaminated. Results are reported as endotoxin units/ml (EU/ml), and according to the U.S. Food and Drug Administration (FDA) guidelines, 0.5 EU/ml is the endotoxin limit for considering a material not contaminated by endotoxin in regards of medical devices. As shown in , for none of the tested materials, LPS was detected at levels above 0.5 EU/ml; in addition, the absence of endotoxin contamination was confirmed by the similar levels of LPS quantified in the presence and absence of polymyxin B for all the tested materials.
Figure 3. Endotoxin detection in reduced graphene oxides (rGOs) using the TNF-α expression test (TET assay). macrophages obtained by differentiation from the human monocytic THP-1 cell line were exposed for 24 h to rGO1 – rGO6 at a non-cytotoxic concentration (1 µg/ml) in presence or absence of polymyxin B sulfate (10 µM). as positive control, macrophages were exposed to 100 ng/ml LPS. The red dashed line represent the 0.5 EU/ml acceptable limit suggested by the U.S. FDA. Results are the mean ± SE of three independent experiments.
3.3. Cytotoxicity
The reduction in the number of viable 16HBE14o- cells related to 3- and 24-h treatment with rGO1-rGO6 (0.4–100.0 μg/ml) was evaluated by the ATP-luminometric cytotoxicity assay and the WST-8 assay. The impact of C/O ratio was evaluated by comparing rGO1, rGO2, rGO3 and rGO4. Then, the influence of lateral size and number of layers was assessed by comparing rGO1 with rGO5, and rGO6, respectively. In addition, and in order to select the concentrations to be tested in the genotoxicity assays, cell viability was considered to be affected when the percentage of viable cells relative to the negative control was less than 45 ± 5% (OECD Citation2023).
3.3.1. Luminescent Cell Viability Assay
The results, expressed as a percentage of living cells in comparison to the negative control, are summarized in . It is worth noting that none of the tested rGOs showed any interference with the assay at any of the exposure times. After 3 h exposure, rGO1 (C/O: 52.6) did not show a significant decrease in viability being the least cytotoxic with an EC50 of 198.5 µg/ml. The most cytotoxic ones were rGO2 (C/O: 13.9) and rGO3 (C/O: 11.0), both showing a significant decrease in viability starting from 25 µg/ml, and EC50 of 110.3 µg/ml and 153.1 µg/ml, respectively. Then, rGO4 (C/O: 7.1) exhibited an intermediate cytotoxic effect compared to the other three materials, with a significantly decreasing viability starting also at 25 µg/ml, but with an EC50 of 157.3 µg/ml. After 24 h exposure, rGO1, rGO2 and rGO4 showed a significant decrease in viability starting from 25 µg/ml, while rGO3 only after 100 µg/ml. However, the observed toxicity followed the same trend as in the short treatment, with rGO1 being the least toxic material, with an EC50 of 67.17 µg/ml, and rGO4 < rGO3 < rGO2, with EC50 values of 53.47 µg/ml, 48.38 µg/ml, and 49.38 µg/ml, respectively. With respect to the number of layers and lateral size, none of the materials showed statistically significant differences in toxicity with respect to rGO1. On the other hand, results with rGO5 were inconclusive; the EC50 (454.4 µg/ml) was higher than that of rGO1 after 3h, while the EC50 (74.24 µg/ml) was similar to rGO1 after 24 h. rGO6 showed to be less toxic than rGO1 with an EC50 of 285.4 and 107.5 µg/ml after 3 h and 24 h, respectively.
Figure 4. Effects of rGO1-rGO6 on 16HBE14o − cell viability evaluated by the CellTiter-GloVR Luminescent Cell Viability assay after 3 h (A,C,E) and 24 h (B,D,F) exposure. Data are reported as % of living cells compared to untreated controls (100% of living cells) and represented as the mean ± SEM of three independent experiments. The grey bar represents the range of 45 ± 5% cell viability (corresponding to the 55 ± 5% cytotoxicity) below which doses should not be included in the genotoxicity assays. Statistical differences *: p < .005; **: p < .001; ***: p < .0005; ****: p < .0001 (two-way ANOVA and Bonferroni’s post-test).
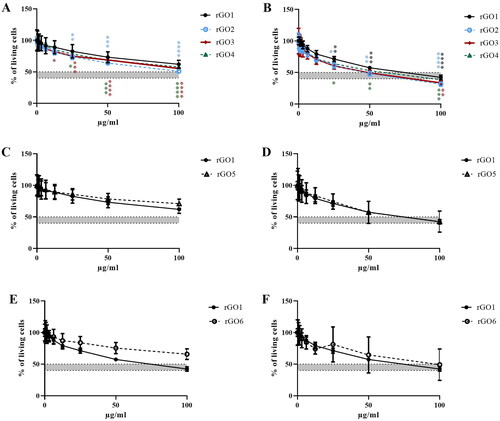
Regarding the 45 ± 5% limit in cell viability requested for selecting the concentrations to be tested in the genotoxicity assays, rGO2 was the only material reaching such limit at 100 µg/ml after 3 h exposure. On the other hand, after 24 h exposure, rGO2, rGO3, and rGO4 reach that limit at 50 µg/ml, whereas rGO1 showed slightly less cytotoxicity at that concentration. All materials exceeded the limit at 100 µg/ml.
3.3.2. WST-8 assay
shows the effects of rGO1, rGO2, rGO3, and rGO4 on cell viability after a short (3 h; panel A) and a longer (24 h; panel B) exposure. Data are reported as % of cell viability in cells exposed to rGOs with respect to untreated control cells (100% cell viability). After 3 h exposure, rGO1 reduced cell viability starting from the concentration of 50 μg/ml (77% cell viability with respect to untreated controls), with an EC50 value > 100 μg/ml. After 24 h exposure, rGO1 reduced cell viability at the concentration of 12.5 μg/ml (79% cell viability) and above, with an EC50 value equal to 69.9 μg/ml (95% CI = 45.5–107.7 μg/ml).
Figure 5. Effects of rGO1 − rGO6 on 16HBE14o − cells viability evaluated by the WST-8 assay after 3 h (A,C,E) and 24 h (B,D,F) exposure. Data are reported as % of cell viability in cells exposed to rGOs with respect to untreated control cells (negative control) and represented as the mean ± SE of 3 independent experiments performed in triplicate. Statistical differences vs rGO1: *p < .05; **p < .01; ***p < .001; ****p < .0001 (two-way ANOVA and Bonferroni’s post-test).
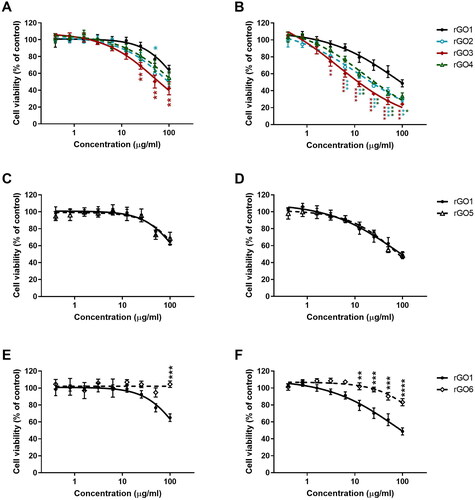
To evaluate the impact of C/O ratio on rGO cytotoxicity, the effects of rGO2 (13.9 C/O content), rGO3 (11.0 C/O content), and rGO4 (7.1 C/O content) were compared to that of rGO1 (52.6 C/O content). In general, rGOs with lower C/O content showed a slightly higher cytotoxicity potency. After 3 h exposure, rGO2 reduced cell viability from the concentration of 25 μg/ml (77% cell viability), exerting a cytotoxic effect significantly higher than that of rGO1 only at the concentration of 50 μg/ml (p < 0.05); its EC50 value was equal to 90.4 μg/ml (95% CI = 61.5–132.8 μg/ml). The cytotoxic effect induced by rGO3 was significantly higher than that of rGO1 (p < 0.01) starting from the concentration of 25 μg/ml; its EC50 value was equal to 50.4 μg/ml (95% CI = 36.1–70.2 μg/ml). rGO4 reduced cell viability with a lower effect, starting from the concentration of 25 μg/ml (81% cell viability), with an EC50 > 100 μg/ml. After 24 h exposure, the effect induced by rGO2 was significantly higher than that of rGO1 starting from the concentration of 6.3 μg/ml (p < 0.001), with an EC50 value equal to 14.2 μg/ml (95% CI = 6.6–30.3 μg/ml), almost 5-fold lower than that of rGO1. Similarly, rGO3 reduced cell viability from concentration of 3.1 μg/ml (74% cell viability), exerting a cytotoxic effect significantly higher than that of rGO1 (p < 0.01); its EC50 value was equal to 4.6 μg/ml (95% CI = 1.6–13.1 μg/ml), 15-fold lower than that of rGO1. rGO4 reduced cell viability starting from the concentration of 6.3 μg/ml (77% cell viability); as compared to rGO1, this effect was significantly higher starting from the concentration of 12.5 μg/ml (p < 0.01), with an EC50 equal to 16.7 μg/ml (95% CI = 10.1–27.5 μg/ml), 4.2-fold lower than that of rGO1.
Secondly, to clarify the influence of lateral size on rGO cytotoxic potential, the effects induced by rGO5 (medium lateral size < 1 µm) was compared to that of rGO1 (medium lateral size equal to 39 µm); both materials characterized by similar oxygen content (45.5 and 52.6 C/O content, respectively) and number of layers (4–5). shows the effects of rGO1 and rGO5 on cell viability after 3 (panel C) and 24 h (panel D) exposure. No significant differences were observed between the two materials: after 3 h exposure, rGO5 reduced cell viability starting from a concentration of 50 μg/ml (73% cell viability), with an EC50 > 100 μg/ml, similarly to rGO1 (see above). After 24 h exposure, the effect of rGO5 was induced with an EC50 equal to 78.1 μg/ml (95% CI = 55.78–109.5 μg/ml), comparable to that of rGO1 (see above).
Lastly, to evaluate the influence of the number of layers on rGO cytotoxic potential, the effect of rGO6 (∼8 layers) was compared to that of rGO1 (∼4 layers), both materials characterized by similar oxygen content (66.7 and 52.6 C/O content, respectively) and average lateral dimension (43 and 39 µm, respectively). shows the effects of rGO1 and rGO6 on cell viability after 3 (panel E) and 24 h (panel F). In contrast to rGO1, rGO6 did not reduce cell viability at any of the concentrations tested after 3 h exposure. On the other hand, after 24 h exposure, rGO6 slightly reduced cell viability starting from the concentration of 50 μg/ml (90% cell viability; p < 0.001) with an EC50 value > 100 μg/ml; its effect was significantly lower than that of rGO1 starting from the concentration of 12.5 μg/ml (102% cell viability; p < 0.01).
3.4. Induction of reactive oxygen species
The effects of rGO1 – rGO6 (0.4–25.0 μg/ml, up to 24 h exposure) on ROS production were evaluated by the DCFDA assay through a comparative approach with respect to rGO1. Higher concentrations of each material were excluded from the analysis due to interferences with the fluorescence readout given by all the materials. For rGO1, rGO2, rGO3, rGO4, and rGO5, the induction of ROS production was concentration- and time-dependent at all the concentrations tested, but significantly lower as compared with the positive control starting from 6 h exposure. For rGO6, a slight concentration-dependent induction of ROS production was observed only after 6 h exposure and above, although lower than that induced by the other materials and by the positive control. In general, comparing the whole kinetics profiles, rGO1, rGO2, rGO3, rGO4, rGO5 showed a similar potency in inducing ROS production, whereas rGO6 showed a lower potency (Supplementary Figure S2).
To better investigate the potencies of ROS production induced by the different materials after 3 (, panel A, C, E) and 24 h (, panel B, D, F) exposure, rGO2 – rGO4 effects were compared to that of rGO1 to evaluate the role of oxygen content, whereas rGO5 or rGO6 effects were compared to that of rGO1 to evaluate the role of lateral dimension and layers number, respectively. Data are reported as % of ROS increase with respect to negative control (cells not exposed to rGOs). In particular, rGO1 exerted a concentration-dependent effect, leading to 400% and 1820% increase of ROS production after 3 h and 24 h exposure, respectively, at the highest concentration (25 μg/ml). The effects of rGO1 were initially compared with those induced by rGO2, rGO3 and rGO4. After 3 h exposure (panel A), rGO2, rGO3 and rGO4 effects were slightly higher than that of rGO1 (624%, 520% and 536% of ROS production at the highest concentration, respectively), but the differences were not significant (p > 0.05). A similar trend was observed also after 24 h exposure (panel B): rGO2, rGO3 and rGO4 induced ROS production with a potency comparable to that of rGO1, increasing ROS production by 1877%, 1721% and 2228% respectively, at the highest concentration.
Figure 6. Reactive oxygen species (ROS) production in 16HBE14o − cells after exposure to rGO1 − rGO6 for 3 h (A,C,E) or 24 h (B,D,F), evaluated by the DCFDA assay. Results are expressed as % of ROS increase with respect to negative control (cells not exposed to rGOs) and represented as the mean ± SE of at least 3 independent experiments performed in triplicate. Statistical differences vs rGO1: **p < .01; ***p < .001; ****p < .0001 (two-way ANOVA and Bonferroni’s post-test).
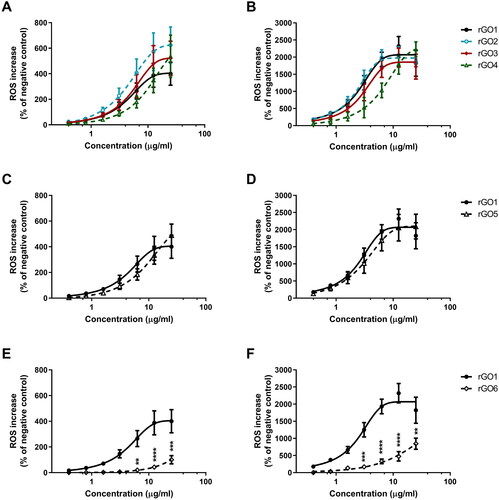
Secondly, the rGO5 effect was compared to that of rGO1 to evaluate the role of lateral dimension (; panels C,D). In particular, no significant differences were observed between the two materials. After 3 (panel C) and 24 h (panel D) exposures, rGO5 induced a 488% and 2089% increase of ROS production at the highest concentration, respectively, an effect comparable to that of rGO1.
Lastly, the rGO6 effect was compared to that of rGO1 to evaluate the role of layers number (; panels E,F). After 3 h exposure (panel E), as compared to rGO1, rGO6 induced a significant lower effect starting from concentration of 6.3 μg/ml (20% of ROS production; p < 0.01) up to 25 μg/ml (100% of ROS production; p < 0.001). A similar trend was observed also after 24 h exposure (panel F). As compared to rGO1, rGO6 induced a significant lower effect starting already from the concentration 3.1 μg/ml (168% of ROS production; p < 0.001) up to 25 μg/ml (844% of ROS production; p < 0.01).
3.5. Cytokine analysis
To assess the pro-inflammatory effects of each rGO in 16HBE14o − cells, a panel of inflammatory mediators (IL-1α, IL-1β, IL-6, IL-8, IL-18, TNF-α, GM-CSF, INF-γ, MCP-1, RANTES, ECF/CCL11, PG-E2) was quantified in cell media collected after 24 h exposure to rGO1 – rGO6 (10 μg/ml), using specific ELISA assays. shows the amount of the specific mediators, expressed as pg/ml, released by 16HBE14o − cells after rGOs treatment, in comparison with untreated cells, the positive control and the reference material.
Figure 7. Release of pro-inflammatory mediators by 16HBE14o − cells exposed to rGO1 – rGO6 (10 μg/ml) for 24 h. After 24 h exposure, cell media were collected and IL-1α (A), IL-1β (B), IL-6 (C), IL-18 (D), TNF-α (E), GM-CSF (F), INF-γ (G), MCP-1 (H), RANTES (I), IL-8 (J), ECF/CCL11 (K), PG-E2 (L) were measured by specific ELISA assays. Cells were exposed to LPS 1 µg/ml as a positive control or Mitsui-7 MWCNT 1 µg/ml as a reference material. The data, reported as pg/ml of each mediator released in the media, are represented as the mean ± SE of three independent experiments. Statistical differences vs negative controls: *, p < .05; **, p < .01; ****, p < .0001 (one-way ANOVA and Bonferroni’s post-test); statistical differences vs rGO1: #, p < .05; ##, p < .01; ###, p < .001 (one-way ANOVA and Bonferroni’s post-test).
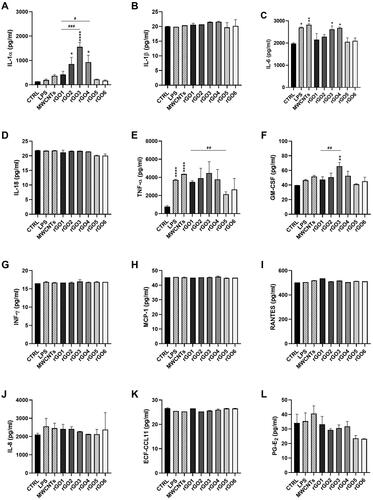
Regarding IL-1α, with respect to untreated controls (134 pg/ml), rGO1 induced a higher, but not significant, release of IL-1α (420 pg/ml; 3.1-fold increase). This effect appeared anyway higher to that induced by LPS (197 pg/ml; 1.5 folds increase) or MWCNT Mitsui-7 (371 pg/ml; 2.8 folds increase). However, this effect appeared enhanced by increasing the oxygen content of rGO. In comparison with the negative controls, rGO2, rGO3 and rGO4 significantly increased IL-1α release to 852 pg/ml (6.4 folds increase; p < 0.05), 1559 pg/ml (11.6 folds increase; p < 0.0001) and 931 pg/ml (6.9-fold increase; p < 0.05), respectively. These effects were 2-fold (p > 0.05), 3.7-fold (p < 0.001) and 2.2-fold (p < 0.05) higher with respect of that induced by rGO1, respectively. On the contrary, the effects induced by rGO5 (223 pg/ml) and rGO6 (173 pg/ml) were comparable to that induced by negative controls and appeared slightly, but not significantly, lower than that induced by rGO1.
Regarding IL-6, with respect to negative controls (1977 pg/ml), only rGO3 and rGO4 significantly increased its release, up to 2618 pg/ml (1.3-fold increase; p < 0.05) and 2677 pg/ml (1.4-fold increase; p < 0.05), respectively. The effects were similar to those induced by LPS (2700 pg/ml; 1.4-fold increase) and MWCNT Mitsui-7 (2825 pg/ml; 1.4-fold increase). On the contrary, no significant effects, as compared to negative controls, were observed for the other rGO materials.
Considering GM-CSF, as compared to the negative control (40 pg/ml), only rGO3 significantly increased its release to 66 pg/ml (1.6-fold increase; p < 0.01), at a level higher than that induced by LPS (47 pg/ml; 1.2-fold increase) or MWCNT Mitsui-7 (52 pg/ml; 1.3-fold increase). As compared to rGO1 (47 pg/ml), only rGO3 significantly increased GM-CSF release (1.4-fold increase; p < 0.01).
Regarding TNF-α, as compared to untreated controls (770 pg/ml), all rGO materials appeared to induce a higher release of TNF-α, even though the differences were not significant (p > 0.05). However, as compared to rGO1 (3486 pg/ml), rGO5 induced a significantly lower release (2131 pg/ml; p < 0.01). In contrast, LPS and Mitsui-7 MWCNTs significantly increased TNF-α release up to 3715 pg/ml (p < 0.0001) and 4368 pg/ml (p < 0.0001), respectively, as compared to negative controls. On the contrary, no significant effects were observed for IL-1β, IL-8, IL-18, INF-γ, MCP-1, RANTES, ECF-CCL11 and PG-E2, even though for the latter a non-significant reduction of its release with respect to negative control and rGO1 was observed in rGO5- and rGO6-treated cells.
3.6. Genotoxicity assessment
3.6.1. Comet assay
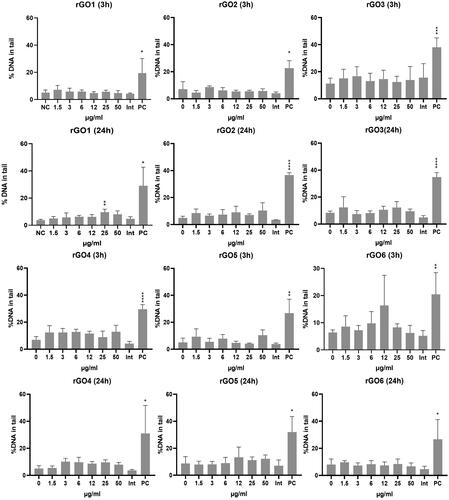
The induction of SBs and ALS was assessed by the comet assay after 3 and 24 h treatment with rGO1–rGO6. Results are shown in . None of the materials induced a statistically significant increase in DNA damage after 3 h treatment. However, a statistically significant effect was induced by rGO1 at 25 μg/ml (p < 0.001) after 24 h treatment, with a slight but significant concentration-dependent response (p = 0.0036, slope = 0.07978). No statistically significant increase of DNA damage, nor a significant linear dose-response was induced by any of the other rGO materials.
Figure 8. DNA damage induction in 16HBE14o- cells after exposure to rGO1 – rGO6 for 3 and 24 h, assessed by the comet assay. Results are expressed as the % DNA in tail and represented as the mean ± SD of two independent experiments. Int: interference control; PC: positive control (20 mM H2O2). *: p < .005; **: p < .001; ***: p < .0005; ****: p < .0001.
3.6.2. Micronucleus test
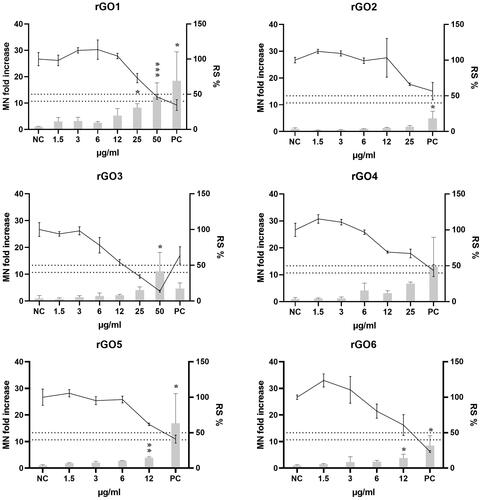
The induction of chromosome breaks and losses was assessed by the MN test after 24 h treatment with rGO1 – rGO6. Readout interference was observed in the spike controls at 25 and 50 µg/ml for rGO6 (data not shown); therefore, these concentrations were excluded from the MN analyses. In addition, an overlap in the gating of the rGOs’ aggregates and the MN at 24 h after exposure (gate localization control) was observed at 50 µg/ml for rGO2, and at 25 and 50 µg/ml for rGO5 (data not shown). Therefore, these concentrations were also excluded from the MN analyses. The results of the MN analyses are shown in . For rGO1, the two highest doses (25 and 50 µg/ml) were statistically significantly different from the negative control (p = 0.0117 and p = 0.0003, respectively), and there was a statistically significant linearconcentration–response (p < 0.0001; slope = 0.2171). A statistically significant linear concentration-response was also observed for rGO5 and rGO6 (p < 0.0001; slopes = 0.2178 and 0.2219, respectively), which also showed a statistically significant effect at the highest tested dose of 12 µg/ml (p = 0.0447 and p = 0.0051, respectively). On the other hand, none of the tested doses (up to 25 µg/ml) of rGO2 significantly differed from the zero dose, although the linear concentration-response was statistically significant (p < 0.0001; slope = 0.3757). Finally, rGO3 and rGO4 showed a statistically significant increase of MN only at doses that were sub-toxic for the former (relative survival of 40–50%) or clearly toxic for the latter (relative survival below 40%), although a significant linear dose-response (p < 0.0001; slopes = 0.04479 and 0.04440, respectively) was observed with both materials.
Figure 9. Micronuclei (MN) induction in 16HBE14o- cells after exposure to rGO1-rGO6 for 24 h. Results are expressed as MN fold increase over the negative control (±SD, bars) and relative cell survival (RS %, ±SD, line). NC: negative control; PC: positive control (Mitomycin C; 50 ng/ml); *: p < .05. The dotted lines indicate the maximum acceptable toxicity range according to the OECD TG 487.
3.7. Cellular uptake
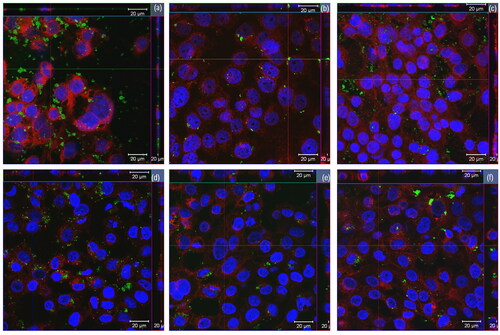
The aim of the cellular uptake experiment was to assess whether rGOs were internalized into the bronchial cells. The images obtained by laser confocal microscopy allowed to confirm the cellular internalization of all the tested rGOs, as shown in . A slightly different pattern of cell interaction could be observed. In some samples, rGO signals were seen outside the cells in abundance (rGO1 and rGO3; ) as well as in the cytoplasm. For the other rGOs, signals were observed in the cytoplasm with varying degrees of patchiness (). However, quantitative differences in the level of internalization among the different rGOs could not be assessed due to the limitations of the method used.
Figure 10. Orthogonal view of confocal images of the 16HBE14o- cells treated for 24 h with (A) 25 µg/ml of rGO1, (B) 12 µg/ml of rGO2, (C) 12 µg/ml of rGO3, (D) 25 µg/ml of rGO4, (E) 25 µg/ml of rGO5 and (F) 25 µg/ml of rGO6. Cell nuclei: blue; cell membranes: red; rGOs: green.
4. Discussion
In this study, the aim was to evaluate the influence of C/O ratio, lateral size, and number of layers of a series of rGOs on a set of key hazard endpoints (cytotoxicity, oxidative stress, inflammation, and genotoxicity) that are usually considered in most of the testing strategies developed for nanomaterials (Dekkers et al. Citation2016; Ruijter et al. Citation2023). Differences on these PC characteristics give rise to different properties and applications, as previously shown (Galindo et al. Citation2014). To the best of our knowledge, while GO is being widely assessed, studies addressing the influence of the PC properties of rGO on its biological effects are scarce and, in some cases, the results reported are contradictory. As an overview, the literature reviewed by Achawi and colleagues (Achawi et al. Citation2021) showed inconclusive results on the level of oxidation of GBM, as most of the studies performed did not characterize this property. In the same review, lateral size and thickness were related to cytotoxicity and oxidative stress, but in general, no clear conclusion could be drawn due to limited information.
In order to assess the influence of the oxidation status, four rGO (rGO1 to rGO4) with different C/O ratio (–52.6 to 7.1) were analyzed in the present study. First, we evaluated the effects of the selected panel of rGO on cell viability using two different assays, a luminescence cell viability assay measuring the number of viable cells based on quantification of intracellular ATP, as an indicator of metabolically active cells, and the colorimetric WST-8 assay, evaluating viable cells through the measurement of metabolic enzymes activity. Even though with slight differences, the results obtained by both assays lead to interesting observations. The results of the luminescent cell viability assay showed the following potency rank: rGO2 (13.9 C/O content) > rGO3 (11.0) > rGO4 (7.1) > rGO1 (52.6); although it should be noted that the toxicity of both rGO2 and rGO3 is very similar. On the other hand, the results of the WST-8 assay suggested the following potency rank: rGO3 (11.0 C/O content) > rGO2 (13.9) > rGO4 (7.1) > rGO1 (52.5). Overall, despite rGOs characterized by higher densities of oxygen content appeared generally slightly more cytotoxic than rGO1, there is not a direct correlation with the amount of O2-bearing functional groups, probably because of the slight differences in C/O ratio of rGO2 – rGO4 (13.9–7.1). These results are consistent with Chatterjee and colleagues’ findings. The evaluation of two materials (GO and rGO) with similar lateral size, thickness and layer number but different oxidation state and C/O ratio, showed similar cytotoxicity response, although trough different mechanisms of uptake and ROS induction (Chatterjee, Eom, and Choi Citation2014). However, the differences in C/O content did not influence the potency of the studied rGOs in inducing ROS production, as no significant statistical differences among treatment groups were observed in the present study. Conversely, Majeed and colleagues (Majeed et al. Citation2017) evaluated a series of GBMs and concluded that those materials with a higher degree of oxidation showed increased ROS induction but lower cytotoxicity, whereas an association between a higher oxygen content with higher cytotoxicity has been reported for GO (Pelin et al. Citation2018). Nevertheless, results from the literature are not directly comparable with those of the current investigation as they involve a broader range of oxygen content (e.g. GO vs. rGO), which together with other variables (e.g. reduction method) may affect the outcomes of the assays.
Although oxidative stress has been suggested to be the main mechanism of the toxicity exerted by some graphene derivatives (Zhang et al. Citation2015), the results of previous and present study seem to indicate that other mechanisms also play an important role. For instance, Majeed and coworkers (Majeed et al. Citation2017) hypothesized that the previously reported higher hydrophilicity of graphene materials with increased oxygen content (Chatterjee et al. Citation2015) might result in higher dispersibility, allowing these materials to enter into cells as individual flakes rather than as aggregates. Unfortunately, the method used in the present study did not provide enough resolution to allow the identification of quantitative differences among the rates of cellular internalization of the tested rGOs. On the other hand, the physical interaction of the graphene derivatives with cell membranes, leading to lipid peroxidation, has also pointed out as one of the main causes of their cytotoxicity (Li et al. Citation2018). In the case of rGO, the reducing agents used in the production process may affect the final shape of the material and, consequently, could damage cell membranes when interacting with them, as it has been described for ascorbic acid-reduced GO (Pelin et al. Citation2023).
To consider the role of average lateral dimension and number of layers, two additional rGO (rGO5 and rGO6) of similar C/O content as rGO1 were also assessed. In both cytotoxicity assays, rGO5 (medium lateral size < 1 µm) showed a cytotoxic potency comparable to that of rGO1 (medium lateral size = 39 µm), suggesting that neither lateral dimension appears to play a significant role in the cytotoxicity of these materials. Nevertheless, we cannot exclude that this observation could be due to the common tendency of rGOs to slightly aggregate in cell culture media, vanishing the possible contribution of lateral dimension of each single non-aggregated flake. This possibility could support the discrepancy observed between rGO5 lateral dimensions measured by DLS and TEM analyses: the former was carried out directly on the powdered material whereas the latter was performed in water-diluted cell culture media suspension that could have led to aggregates formation or selection of bigger flakes. In contrast, when comparing the effects of rGO6 (∼8 layers) and rGO1 (∼4 layers), although only significant in the WST-8 assay at both exposure times, showed a lower cytotoxic potency for the former. This finding suggests that an increasing number of flakes may significant lower the cytotoxic potency of rGO. This conclusion is supported also by the analysis of ROS production induced by the selected materials. Indeed, differences in lateral size (rGO1 vs rGO5) did not influence the materials potency in inducing ROS production. On the contrary, rGO6 showed a lower ROS induction than rGO1, both after a short (3 h) and a longer (24 h) exposure time, suggesting that a higher number of layers may reduce the ROS induction potential of rGO.
The analysis of pro-inflammatory mediators’ release from bronchial cells supported some of the above conclusions, even though significant differences were only barely noticed due to the low effects induced by the selected materials. Indeed, as compared to untreated controls, only 3 out of 12 mediators (IL-1α, IL-6, and GM-CSF) were significantly increased by only a few of the tested rGOs. Even though in some cases the effect on these mediators appeared similar or even higher than that of the positive control LPS, the low number of increased mediators among those mostly relevant for pulmonary inflammation suggests a general low pro-inflammatory potential. The highest increased release was observed for IL-1α. However, this effect may derive from rGO-induced cell damage leading to a passive release of IL-1α, an intracellular stored alarmin. This hypothesis is supported by a previous study showing that rGO can induce mechanical membrane injuries through its sharp edges (Pelin et al., Citation2023). On the contrary, alarmins appear to be only slightly released by cells exposure to LPS, which pro-inflammatory effect is dependent on activation of transcription factors associated with inflammatory genes, including those encoding for some of the mediators we measured. Notwithstanding, some interesting observations can still be made: (i) only rGO characterized by lower C/O ratios, but not the others, were able to significantly release IL-1α, but not in a manner directly dependent on the density of O2-bearing groups; being intracellularly stored, IL-1α is mainly released after cellular damage, and therefore it may be considered a direct marker of plasma membrane rupture, thus reflecting the results obtained through the viability assays; (ii) also the release of IL-6 and GM-CSF was increased only by rGO characterized by the lower C/O ratio, but not the others. On the contrary, pro-inflammatory mediators’ release induced by rGO5 and rGO6 appeared generally comparable to those induced by rGO1, that per se were in most cases similar to those of the negative control. Similarly, Li and colleagues (Li et al. Citation2018) observed a correlation between oxidation status and lung inflammation after evaluating GO and rGOs with a very similar number of layers and lateral size. This observation, together with the lower cytotoxic and ROS-inducing potencies of rGO6, may be explained by a probable lower capability of this material to interact with cells, tentatively due to its higher thickness in comparison to the other materials. Indeed, as shown by confocal images, the rGO6 signal was only barely detectable in bronchial cells.
Among the rGOs analyzed in the present study, only rGO1 was able to induce DNA alterations assessed by the comet test, despite all the rGOs were efficiently internalized into the cells and could have interacted with the cellular genetic material. Both positive and negative outcomes with this assay have been reported in previous studies analyzing different types of rGO and functionalized rGO (Domenech et al. Citation2022), although positive results were usually observed only at high doses (50–100 µg/mL) (Hashemi et al. Citation2014; Hinzmann et al. Citation2014; Ou et al. Citation2021) that, according to the information provided by the authors, could be considered as too cytotoxic.
As concerns chromosome damage, very few in vitro studies have assessed the induction of MN after exposure to GBMs (Domenech et al. Citation2022). Only one study was performed with a rGO of a similar C/O ratio as rGO4 (Cebadero-Dominguez et al. Citation2023), although no information on the lateral size and the number of layers was provided, reporting negative results in L5178Y Tk ± mouse lymphoma cells exposed to 15.6–250 µg/mL of the material for 24 h. However, Burgum and colleagues were able to detect an increase of the MN formation when exposing 16HBE14o- cells to neutral and aminated few-layers graphene (2–100 µg/mL) for 24 h (Burgum et al. Citation2021). Being the same cell line as the one used in the present study; it therefore confirms the suitability of the cellular system. In the present work, a positive outcome based on the OECD criteria for the in vitro micronucleus assay (OECD Citation2023) (a significant increase in the MN frequency at non-cytotoxic doses together with a significant dose-response relationship) was observed for the three materials with the highest C/O content (rGO1, rGO5 and rGO6), although the other rGOs also showed a dose-dependent trend. Both rGO5 and rGO6 were more efficient than rGO1 in the induction of MN, as a significant difference compared with the negative control was already observed at a lower dose (12 µg/mL). However, they showed a similar effectivity, causing about a 3.8-fold increase in comparison to the negative control at that dose. Therefore, based on the current results, no clear association between the induction of DNA and chromosome damage and the C/O content, lateral size or number of layers can be established.
Most of the DNA lesions detected by the comet assay are caused by oxidative damage leading to strand breaks (Kohl et al. Citation2020). However, rGO1 showed a similar potency than the other rGO in inducing ROS. Hence, other mechanisms (e.g. interfering with the DNA repair system) might explain why rGO1 was the only material inducing DNA damage. A similar conclusion was reached by Domenech and colleagues (Domenech et al. Citation2020) who found a significantly higher percentage of DNA in the tail of Caco-2/HT29 barrier cells exposed to GO and graphene nanoplatelets (GNPs) than that observed in untreated cells, despite no increase of intracellular ROS nor DNA breaks derived from oxidatively-damaged DNA bases was detected with any of the materials. Inconsistencies between ROS production and induction of DNA damage have also been described for other graphene derivatives. A higher generation of ROS was reported in the murine lung epithelial cell line FE1 by one GO compared to other two rGOs of similar number of layers (2–3) and lateral size (1–2 µm) but lower oxygen content (C/O ratio of 8 and 12.8, respectively) than the GO (C/O ratio of about 1). However, induction of DNA damage was observed for none of the materials following 3 or 24 h of treatment with up to 200 μg/mL (Bengtson et al. Citation2016). On the other hand, in a recent publication (Pelin et al. Citation2023) using the same bronchial cell line (16HBE14o-) as in the present study, a rGO showed a significantly higher induction of ROS compared to a GO derivative after 3 and 24 h exposure. However, none of the materials significantly increased the levels of DNA damage over the negative control values when assessed by the alkaline comet assay after similar exposure times. In both studies, the differences in ROS generation potency between the GO and rGO materials were much higher than the differences observed among rGOs in the present study.
As reported above, rGO1, rGO5 and rGO6 were able to induce an increase in the frequency of MN, which may raise as a consequence of a clastogenic or aneugenic effect (Fenech Citation2020). The former results from chromosome breaks, which can appear e.g. because of unrepaired single DNA strand breaks or abasic sites, whereas the latter consists of the loss of whole chromosomes during the cell division due to problems during the attachment of the chromosomes with the mitotic spindle (Domenech et al. Citation2022). Interferences with the microtubules of the mitotic spindle have been reported for carbon nanotubes (Sargent et al. Citation2012), and it could be caused by rGO5 or rGO6 due to their bigger size (either lateral size or increased number of layers). In fact, the previously reported increased formation of MN by neutral and aminated FLG showed to be induced by both chromosome breaks and loss of entire chromosomes (Burgum et al. Citation2021).
In conclusion, the results of the present study, which assessed different sets of rGOs varying only by one physico-chemical property whereas being similar for the other ones, indicate that rGO of higher oxygen content showed higher cytotoxic and early ROS-inducing potential, whereas genotoxic effects were observed with the rGO of lowest density of oxygen groups. However, a direct correlation between the C/O content cannot be established for any of the hazard endpoints. On the other hand, a higher number of layers seems to be associated with a decreased potential for inducing cytotoxicity and ROS production, whereas no influence of the lateral size was observed. The observed results can be of interest when considering the safe-by-design production of new rGOs.
Supplemental Material
Download PDF (558.2 KB)Disclosure statement
No potential conflict of interest was reported by the author(s).
Data availability statement
All data generated in this study is included in the current publication and its supplementary information files.
Additional information
Funding
References
- Achawi, S., J. Pourchez, B. Feneon, and V. Forest. 2021. “Graphene-Based Materials in Vitro Toxicity and Their Structure-Activity Relationships: A Systematic Literature Review.” Chemical Research in Toxicology 34 (9): 2003–2018. https://doi.org/10.1021/acs.chemrestox.1c00243
- Aimonen, K., M. Imani, M. Hartikainen, S. Suhonen, E. Vanhala, C. Moreno, O. J. Rojas, et al. 2022. “Surface Functionalization and Size Modulate the Formation of Reactive Oxygen Species and Genotoxic Effects of Cellulose Nanofibrils.” Particle and Fibre Toxicology 19 (1): 19. https://doi.org/10.1186/s12989-022-00460-3
- Akhavan, O., E. Ghaderi, and A. Akhavan. 2012. “Size-Dependent Genotoxicity of Graphene Nanoplatelets in Human Stem Cells.” Biomaterials 33 (32): 8017–8025. https://doi.org/10.1016/j.biomaterials.2012.07.040
- Anichini, C., and P. Samorì. 2021. “Graphene-Based Hybrid Functional Materials.” Small 17 (33): e2100514. https://doi.org/10.1002/smll.202100514
- Bengtson, S., K. Kling, A. M. Madsen, A. W. Noergaard, N. R. Jacobsen, P. A. Clausen, B. Alonso, et al. 2016. “No Cytotoxicity or Genotoxicity of Graphene and Graphene Oxide in Murine Lung Epithelial FE1 Cells in Vitro.” Environmental and Molecular Mutagenesis 57 (6): 469–482. https://doi.org/10.1002/em.22017
- Bianco, A., H.-M. Cheng, T. Enoki, Y. Gogotsi, R. H. Hurt, N. Koratkar, T. Kyotani, et al. 2013. “All in the Graphene Family – A Recommended Nomenclature for Two-Dimensional Carbon Materials.” Carbon 65: 1–6. https://doi.org/10.1016/j.carbon.2013.08.038
- Bianco, A., and M. Prato. 2015. “Safety Concerns on Graphene and 2D Materials: A Flagship Perspective.” 2D Materials 2 (3): 030201–030201. https://doi.org/10.1088/2053-1583/2/3/030201
- Brownson, D. A. C., D. K. Kampouris, and C. E. Banks. 2011. “An Overview of Graphene in Energy Production and Storage Applications.” Journal of Power Sources 196 (11): 4873–4885. https://doi.org/10.1016/j.jpowsour.2011.02.022
- Burgum, M. J., M. J. D. Clift, S. J. Evans, N. Hondow, M. Miller, S. B. Lopez, A. Williams, et al. 2021. “In Vitro Primary-Indirect Genotoxicity in Bronchial Epithelial Cells Promoted by Industrially Relevant Few-Layer Graphene.” Small 17 (15): e2002551. https://doi.org/10.1002/smll.202002551
- Cebadero-Dominguez, Ó., C. Medrano-Padial, M. Puerto, S. Sánchez-Ballester, A. M. Cameán, and Á. Jos. 2023. “Genotoxicity Evaluation of Graphene Derivatives by a Battery of in Vitro Assays.” Chemico-Biological Interactions 372: 110367. https://doi.org/10.1016/j.cbi.2023.110367
- Chatterjee, N., H. J. Eom, and J. Choi. 2014. “A Systems Toxicology Approach to the Surface Functionality Control of Graphene-Cell Interactions.” Biomaterials 35 (4): 1109–1127. https://doi.org/10.1016/j.biomaterials.2013.09.108
- Chatterjee, N., J. S. Yang, K. Park, S. M. Oh, J. Park, and J. Choi. 2015. “Screening of Toxic Potential of Graphene Family Nanomaterials Using in Vitro and Alternative in Vivo Toxicity Testing Systems.” Environmental Health and Toxicology 30: e2015007. https://doi.org/10.5620/eht.e2015007
- Chee, S. Y., H. L. Poh, C. K. Chua, F. Šaněk, Z. Sofer, and M. Pumera. 2012. “Influence of Parent Graphite Particle Size on the Electrochemistry of Thermally Reduced Graphene Oxide.” Physical Chemistry Chemical Physics 14 (37): 12794–12799. https://doi.org/10.1039/c2cp41462g
- Chee, W. K., H. N. Lim, Z. Zainal, N. M. Huang, I. Harrison, and Y. Andou. 2016. “Flexible Graphene-Based Supercapacitors: A Review.” The Journal of Physical Chemistry C 120 (8): 4153–4172. in pp https://doi.org/10.1021/acs.jpcc.5b10187
- Dekkers, S., A. G. Oomen, E. A. J. Bleeker, R. J. Vandebriel, C. Micheletti, J. Cabellos, G. Janer, et al. 2016. “Towards a Nanospecific Approach for Risk Assessment.” Regulatory Toxicology and Pharmacology 80: 46–59. https://doi.org/10.1016/j.yrtph.2016.05.037
- Domenech, J., A. Hernández, E. Demir, R. Marcos, and C. Cortés. 2020. “Interactions of Graphene Oxide and Graphene Nanoplatelets with the in Vitro Caco-2/HT29 Model of Intestinal Barrier.” Scientific Reports 10 (1): 2793. https://doi.org/10.1038/s41598-020-59755-0
- Domenech, J., A. Rodríguez-Garraus, A. L. de Cerain, A. Azqueta, and J. Catalán. 2022. “Genotoxicity of Graphene-Based Materials.” Nanomaterials 12 (11): 1795. https://doi.org/10.3390/nano12111795
- Fadeel, B., C. Bussy, S. Merino, E. Vázquez, E. Flahaut, F. Mouchet, L. Evariste, et al. 2018. “Safety Assessment of Graphene-Based Materials: Focus on Human Health and the Environment.” ACS Nano American Chemical Society 12 (11): 10582–10620. https://doi.org/10.1021/acsnano.8b04758
- Fenech, M. 2020. “Cytokinesis-Block Micronucleus Cytome Assay Evolution into a More Comprehensive Method to Measure Chromosomal Instability.” Genes 11 (10): 1–13. https://doi.org/10.3390/genes11101203
- Ferrari, A. C., and D. M. Basko. 2013. “Raman Spectroscopy as a Versatile Tool for Studying the Properties of Graphene.” Nature Nanotechnology 8 (4): 235–246. https://doi.org/10.1038/nnano.2013.46
- Franz, P., A. Bürkle, P. Wick, and C. Hirsch. 2020. “Exploring Flow Cytometry-Based Micronucleus Scoring for Reliable Nanomaterial Genotoxicity Assessment.” Chemical Research in Toxicology 33 (10): 2538–2549. https://doi.org/10.1021/acs.chemrestox.0c00071
- Galindo, B., S. G. Alcolea, J. Gómez, A. Navas, A. O. Murguialday, M. P. Fernandez, R. C. Puelles, et al. 2014. “Effect of the Number of Layers of Graphene on the Electrical Properties of TPU Polymers.” IOP Conference Series Materials Science and Engineering 64: 012008. https://doi.org/10.1088/1757-899X/64/1/012008
- García-Rodríguez, A., L. Kazantseva, L. Vila, L. Rubio, A. Velázquez, M. J. Ramírez, R. Marcos, et al. 2019. “Micronuclei Detection by Flow Cytometry as a High-Throughput Approach for the Genotoxicity Testing of Nanomaterials.” Nanomaterials 9 (12): 1677. https://doi.org/10.3390/nano9121677
- Geim, A. K., and K. S. Novoselov. 2007. “The Rise of Graphene.” Nature Materials 6 (3): 183–191. https://doi.org/10.1038/nmat1849
- Gómez, J., E. Villaro, A. Navas, and I. Recio. 2017. “Testing the Influence of the Temperature, RH and Filler Type and Content on the Universal Power Law for New Reduced Graphene Oxide TPU Composites.” Materials Research Express 4 (10): 105020–105020. https://doi.org/10.1088/2053-1591/aa8e11
- Guo, F., M. Creighton, Y. Chen, R. Hurt, and I. Külaots. 2014. “Porous Structures in Stacked, Crumpled and Pillared Graphene-Based 3D Materials.” Carbon 66: 476–484. https://doi.org/10.1016/j.carbon.2013.09.024
- Guo, Z., S. Chakraborty, F. A. Monikh, D.-D. Varsou, A. J. Chetwynd, A. Afantitis, I. Lynch, et al. 2021. “Surface Functionalization of Graphene‐Based Materials: Biological Behavior, Toxicology, and Safe‐by‐Design Aspects.” Advanced Biology 5 (9): e2100637. https://doi.org/10.1002/adbi.202100637
- Hashemi, E., O. Akhavan, M. Shamsara, R. Rahighi, A. Esfandiar, and A. R. Tayefeh. 2014. “Cyto and Genotoxicities of Graphene Oxide and Reduced Graphene Oxide Sheets on Spermatozoa.” RSC Advances 4 (52): 27213–27223. https://doi.org/10.1039/c4ra01047g
- Hinzmann, M., S. Jaworski, M. Kutwin, J. Jagiełło, R. Koziński, M. Wierzbicki, M. Grodzik, et al. 2014. “Nanoparticles Containing Allotropes of Carbon Have Genotoxic Effects on Glioblastoma Multiforme Cells.” International Journal of Nanomedicine 9 (1): 2409–2417. https://doi.org/10.2147/IJN.S62497
- Huang, X., Z. Yin, S. Wu, X. Qi, Q. He, Q. Zhang, Q. Yan, et al. 2011. “Graphene-Based Materials: Synthesis, Characterization, Properties, and Applications.” Small 7 (14): 1876–1902. https://doi.org/10.1002/smll.201002009
- Kohl, Y., E. Rundén-Pran, E. Mariussen, M. Hesler, N. El Yamani, E. M. Longhin, M. Dusinska, et al. 2020. “Genotoxicity of Nanomaterials: Advanced in Vitro Models and High Throughput Methods for Human Hazard Assessment—A Review.” Nanomaterials 10 (10): 1911. https://doi.org/10.3390/nano10101911
- Li, R., L. M. Guiney, C. H. Chang, N. D. Mansukhani, Z. Ji, X. Wang, Y.-P. Liao, et al. 2018. “Surface Oxidation of Graphene Oxide Determines Membrane Damage, Lipid Peroxidation, and Cytotoxicity in Macrophages in a Pulmonary Toxicity Model.” ACS Nano 12 (2): 1390–1402. https://doi.org/10.1021/acsnano.7b07737
- Magne, T. M., T. de Oliveira Vieira, L. M. R. Alencar, F. F. M. Junior, S. Gemini-Piperni, S. V. Carneiro, L. M. U. D. Fechine, et al. 2022. “Graphene and Its Derivatives: understanding the Main Chemical and Medicinal Chemistry Roles for Biomedical Applications.” Journal of Nanostructure in Chemistry 12 (5): 693–727. https://doi.org/10.1007/s40097-021-00444-3
- Mahmoudi, T., Y. Wang, and Y. B. Hahn. 2018. “Graphene and Its Derivatives for Solar Cells Application.” Nano Energy 47: 51–65. https://doi.org/10.1016/j.nanoen.2018.02.047
- Majeed, W., S. Bourdo, D. M. Petibone, V. Saini, K. B. Vang, Z. A. Nima, K. M. Alghazali, et al. 2017. “The Role of Surface Chemistry in the Cytotoxicity Profile of Graphene.” Journal of Applied Toxicology 37 (4): 462–470. https://doi.org/10.1002/jat.3379
- Mittal, S., V. Kumar, N. Dhiman, L. K. S. Chauhan, R. Pasricha, and A. K. Pandey. 2016. “Physico-Chemical Properties Based Differential Toxicity of Graphene Oxide/Reduced Graphene Oxide in Human Lung Cells Mediated through Oxidative Stress.” Scientific Reports 6 (1): 39548–39548. https://doi.org/10.1038/srep39548
- Mukherjee, S. P., N. Lozano, M. Kucki, A. E. Del Rio-Castillo, L. Newman, E. Vázquez, K. Kostarelos, et al. 2016. “Detection of Endotoxin Contamination of Graphene Based Materials Using the TNF-α Expression Test and Guidelines for Endotoxin-Free Graphene Oxide Production.” PLOS One 11 (11): e0166816-e0166816. https://doi.org/10.1371/journal.pone.0166816
- OECD. 2023. Test No. 487: In Vitro Mammalian Cell Micronucleus Test. https://www.oecd-ilibrary.org/docserver/9789264264861-en.pdf?expires=1696319862&id=id&accname=guest&checksum=35B99E0BF45E0F053ADE2A260CD274D5
- Ou, L., X. Lv, Z. Wu, W. Xia, Y. Huang, L. Chen, W. Sun, et al. 2021. “Oxygen Content-Related DNA Damage of Graphene Oxide on Human Retinal Pigment Epithelium Cells.” Journal of Materials Science Materials in Medicine 32 (2): 20. https://doi.org/10.1007/s10856-021-06491-0
- Park, M. V. D. Z., E. A. J. Bleeker, W. Brand, F. R. Cassee, M. van Elk, I. Gosens, W. H. de Jong, et al. 2017. “Considerations for Safe Innovation: The Case of Graphene.” ACS Nano 11 (10): 9574–9593. https://doi.org/10.1021/acsnano.7b04120
- Pei, S., and H. M. Cheng. 2012. “The Reduction of Graphene Oxide.” Carbon 50 (9): 3210–3228. https://doi.org/10.1016/j.carbon.2011.11.010
- Pelin, M., L. Fusco, V. León, C. Martín, A. Criado, S. Sosa, E. Vázquez, et al. 2017. “Differential Cytotoxic Effects of Graphene and Graphene Oxide on Skin Keratinocytes.” Scientific Reports 7 (1): 40572. https://doi.org/10.1038/srep40572
- Pelin, M., C. Passerino, A. Rodríguez-Garraus, M. Carlin, S. Sosa, S. Suhonen, G. Vales, et al. 2023. “Role of Chemical Reduction and Formulation of Graphene Oxide on Its Cytotoxicity towards Human Epithelial Bronchial Cells.” Nanomaterials 13 (15): 2189. https://doi.org/10.3390/nano13152189
- Pelin, M., S. Sosa, M. Prato, and A. Tubaro. 2018. “Occupational Exposure to Graphene Based Nanomaterials: Risk Assessment.” Nanoscale Royal Society of Chemistry 10 (34): 15894–15903. in https://doi.org/10.1039/c8nr04950e
- Promega. 2023. CytoTox-ONE™ Homogeneous Membrane Integrity Assay Instructions for Use of Products G7890, G7891 and G7892.
- Ray, S. C. 2015. “Application and Uses of Graphene Oxide and Reduced Graphene Oxide.” In Applications of Graphene and Graphene-Oxide Based Nanomaterials, edited by Sekhar Chandra Ray, 39–55. Amsterdam: Elsevier.
- Razaq, A., F. Bibi, X. Zheng, R. Papadakis, S. H. M. Jafri, and H. Li. 2022. “Review on Graphene-, Graphene Oxide-, Reduced Graphene Oxide-Based Flexible Composites: From Fabrication to Applications.” Materials 15 (3): 1012. https://doi.org/10.3390/ma15031012
- Reina, G., J. M. González-Domínguez, A. Criado, E. Vázquez, A. Bianco, and M. Prato. 2017. “Promises, Facts and Challenges for Graphene in Biomedical Applications.” Chemical Society Reviews 46 (15): 4400–4416. https://doi.org/10.1039/c7cs00363c
- Rodriguez-Garraus, A., A. Azqueta, F. Laborda, A. C. Gimenez-Ingalaturre, A. Ezquerra, L. Lostao, A. Lopez de Cerain, et al. 2022. “In Vitro Genotoxicity Evaluation of an Antiseptic Formulation Containing Kaolin and Silver Nanoparticles.” Nanomaterials 12 (6): 914. https://doi.org/10.3390/nano12060914
- Ruijter, N., L. G. Soeteman-Hernández, M. Carrière, M. Boyles, P. McLean, J. Catalán, A. Katsumiti, et al. 2023. “The State of the Art and Challenges of in Vitro Methods for Human Hazard Assessment of Nanomaterials in the Context of Safe-by-Design.” Nanomaterials 13 (3): 472. https://doi.org/10.3390/nano13030472
- Sargent, L. M., A. F. Hubbs, S.-H. Young, M. L. Kashon, C. Z. Dinu, J. L. Salisbury, S. A. Benkovic, et al. 2012. “Single-Walled Carbon Nanotube-Induced Mitotic Disruption.” Mutation Research 745 (1–2): 28–37. https://doi.org/10.1016/j.mrgentox.2011.11.017
- Tarelho, J. P. G., M. P. Soares dos Santos, J. A. F. Ferreira, A. Ramos, S. Kopyl, S. O. Kim, S. Hong, et al. 2018. “Graphene-Based Materials and Structures for Energy Harvesting with Fluids – A Review.” Materials Today 21 (10): 1019–1041. https://doi.org/10.1016/j.mattod.2018.06.004
- Vales, G., S. Suhonen, K. M. Siivola, K. M. Savolainen, J. Catalán, and H. Norppa. 2020. “Size, Surface Functionalization, and Genotoxicity of Gold Nanoparticles in Vitro.” Nanomaterials 10 (2): 271. https://doi.org/10.3390/nano10020271
- Wick, P., A. E. Louw-Gaume, M. Kucki, H. F. Krug, K. Kostarelos, B. Fadeel, K. A. Dawson, et al. 2014. “Classification Framework for Graphene-Based Materials.” Angewandte Chemie 53 (30): 7714–7718. https://doi.org/10.1002/anie.201403335
- Zhang, W., L. Yan, M. Li, R. Zhao, X. Yang, T. Ji, Z. Gu, et al. 2015. “Deciphering the Underlying Mechanisms of Oxidation-State Dependent Cytotoxicity of Graphene Oxide on Mammalian Cells.” Toxicology Letters 237 (2): 61–71. https://doi.org/10.1016/j.toxlet.2015.05.021