ABSTRACT
The main aim of this study was to adjust the Questionnaire on the Experience and Evaluation of Work (QEEW) in order to measure stress causes and stress responses of beginning secondary school teachers in the Netherlands. First, the suitability of the original QEEW stress scales for use in the beginning teachers (BTs) context was investigated using a sample of 356 beginning teachers from 52 different secondary school locations in the Netherlands. Confirmatory Factor Analyses, Principal Component Analyses and Mokken scaling item reduction was applied to create high concise and precise scales. Hereafter, based on the teacher stress literature, additional teacher specific stress items were added, resulting in the adjusted version of the measure, the Questionnaire on the Experience and Evaluation of Work – Beginning Teachers (QEEW-BT, study 1). To cross-validate the results and to examine the internal consistency and validity of the adjusted instrument a different sample of 143 beginning teachers from 61 different secondary school locations in the Netherlands was used (study 2). The present findings provide adequate support that the QEEW-BT is a reliable and valid instrument to measure stress causes and responses for beginning secondary school teachers in the Netherlands.
Introduction
Knowledge about work stress, its causes and negative consequences, and how it affects employees’ wellbeing and performance has been well established (Van Veldhoven Citation1996; Van Veldhoven and Meijman Citation1994). General stress causes – as measured by the Questionnaire on the Experience and Evaluation of Work (QEEW, in Dutch: VBBA) of Van Veldhoven and Meijman (Citation1994) – are positively related to stress responses, and negatively related to wellbeing and performance. The QEEW has robust psychometric properties and has been widely used and recognized in the Netherlands and various other countries (e.g. Belgium, France, Germany, Italy, and Brasil). Despite its strong psychomeric quality and popularity, the QEEW is limited for use in a job-specific context such as the teaching profession. The questionnaire does not cover specific stress factors related to the teaching context. Although we assume that general stress causes and responses apply to teachers’ work as well, inclusion of stress factors specifically related to the teaching context is necessary to unravel the knowledge about stress in the teaching profession more comprehensively. In the present study, we aim to adjust the QEEW to measure stress causes and stress responses among beginning teachers (BTs).
The teaching profession is considered to be a highly stressful profession by nature (Johnson et al. Citation2005). In the Netherlands, in 2014, circa 1 in 5 teachers experienced burnout symptoms. Teachers also reported higher levels of workload compared to other professionals (Hooftman et al. Citation2015).
There is no consistent definition of (teacher) stress provided by the experts in the field and competing bodies of literature on teacher stress exist that originate from different fields (e.g. Izawa et al. Citation2012; Klassen and Chiu Citation2010). That being said, there seem to be two general perspectives on (teacher) stress. The first one is that stress responses (e.g. tension) are a result of something ouside of the individual, external factors (e.g. heavy workload). For example Kyriacou (Citation2001) and Rudow (Citation1999) define teachers stress as teachers’ experience of unpleasant, negative emotions, such as tension and anger, resulting from some aspects of their work. The other perspective posits that stress is internal; it is what goes on inside the individual as they interpret or react to what is going on around them (Gold and Roth Citation1993). For example the Transactional model of Stress (Folkman Citation2013; Lazarus and Folkman Citation1984) views work stress as a result of an interaction and appraisal process between the employee and its environment. In the same line, other researchers conceptualize stress with both internal and external aspects: the degree of mismatch between the demands made upon an individual and the individual’s ability to cope with those demands (Bakker and Demerouti Citation2007; McCarthy et al. Citation2016). Given the on-going debate about and the different usages of the term ‘teacher stress’ in this paper the term is used more as a label indicating a specific field of (applied) research. We aim to develop an instrument that can be useful in both externally and internally focussed teacher stress research.
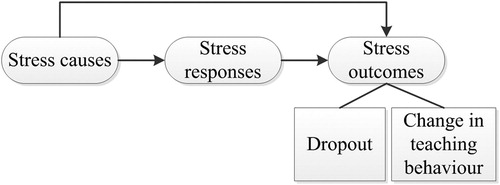
In this study teacher stress is devided into: (1) stress causes, (2) stress responses, and (3) stress outcomes. Stress causes are the collection of aspects of the work content and the work situation that influence employees at a cognitive, motivational and emotional level, for example student misbehaviour. Stress responses are the employees’ mental interpretation when experiencing stress causes, for example feeling tension (Van Veldhoven Citation1996). Stress outcomes result from persistent stress causes and responses, for example leaving the teaching profession (attrition). To understand the chain between beginning teachers’ stress causes, responses, teaching behaviour and attrition the well-validated and widely used job demands-resources (JD-R) model is used (Bakker and Demerouti Citation2007). According to the JD-R model, there are two main psychological processes at work. The first is called the health impairment process. This process describes the relationship between job demands, job resources, strain and organizational outcomes. The second proces is motivational in nature. Herby it is assumed that job resources have motivational potential and lead to high work engagement, low cynicism, and excellent performance. The focus in this study is to adjust an instrument to measure the outcomes of the health impariment proces. The JD-R model posists that job demands cover ‘physical, psychological, social, or organizational aspects of the job that require sustained physical and/or psychological (cognitive and emotional) effort or skills’. Examples in the teaching context are many hours of actual teaching and student misbehaviour. Although job demands are not necessarily negative, they may turn into stress causes when meeting those demands requires high effort from which the employee has not adequately recovered. Hence, job demands are conceptually related to stress causes. Job resources refer to physical, psychological, social or organizational aspects of the job that are either/or: functional in achieving work goals, reduce job demands and the associated physiological and psychological costs, stimulate personal growth, learning and development (Bakker and Demerouti Citation2007). According to the JD-R model: high job demands exhaust employees’ mental and physical resources leading to strain. Similarly, in the teaching context stress causes can lead to among other things feelings of tension. Therefore, strain is conceptually related to stress responses. Finally, this strain can lead to negative organizational outcomes like poor performance, health-related problems, and absenteeism (Bakker, Demerouti, and Sanz-Vergel Citation2014). Translated to the teaching context, tension can eventually lead to negative stress outcomes. Examples of negative stress outcomes are leaving the teaching profession (dropout) and less effective teaching behaviour. Effective teaching behaviour refers to teachers’ behaviour which has significant and positive impact on student learning and outcomes (Maulana, Helms-Lorenz, and van de Grift Citation2015). According to Van de Grift (Citation2007, Citation2014), effective teaching behaviours which are observable from the teacher’s work include: creating a safe and stimulating learning climate, efficient classroom management, clear instruction, activating learning, teaching learning strategies and adaptation.
Stress causes that seem to recur consistently in most of the teacher stress literature involve education specific workload (e.g. big classes), student misbehaviour, poor relationships at work (with students, supervisor, colleagues), role ambiguity, lack of job autonomy, and poor school ethos (Borg and Riding Citation1991; Chen and Miller Citation1997; Hanif Citation2004). Therefore, it is important that these teaching-related stress causes are included in measuring teacher stress. These stress causes, except for the role in the organization, are found to be positively related to dropout (Buchanan Citation2010; Gonzalez, Brown, and Slate Citation2008; Shen Citation1997; Struyven and Vanthournout Citation2014; Wilhelm, Dewhurst-Savellis, and Parker Citation2000). Furthermore, greater levels of stress that are caused by student misbehaviour, education specific workload, and poor relationships at work have a negative impact on teachers’ perceived personal accomplishments (Burke and Greenglass Citation1993; Kokkinos Citation2007). Hanif, Tariq, and Nadeem (Citation2011) studied the relationship between stressors and teaching performance of teachers with a minimum one year of teaching experience. The study showed that stress experienced by teachers was negatively related to their teaching behaviour.
BTs are more vulnerable to the pressures of the profession and stress compared to more experienced teachers (Gold and Roth Citation1993). This group also shows high dropout rates (Macdonald Citation1999). Further, BTs show less effective teaching behaviour compared to more experienced teachers (Maulana, Helms-Lorenz, and van de Grift Citation2015). Dropout is harmful for student achievement (Ronfeldt, Loeb, and Wyckoff Citation2013) and less effective teaching behaviour can also influence student achievement negatively (Hattie Citation2012).
Insight into which and how stress causes and responses influence BTs’ dropout and teaching behaviour remains unclear. This insight could help us signal the possibility of dropout at an early stage in the career, and to develop support which potentially decreases the negative influences of certain stress causes on teachers’ teaching behaviour. To this end a valid, reliable and apt instrument to measure teacher stress more comprehensively is necessary.
As mentioned above, although there are several (teacher) stress questionnaires, none of them cover the broad scope of stress causes and stress responses. The Stressor Multilevel context scale of Betoret (Citation2006) and the Stress questionnaire of Payne and Furnham (Citation1987) are both teacher stress questionnaires which do not cover teacher specific stress causes such as poor relationship with students. Additionaly, those questionnaires do not include stress responses factors, which limit the insight into the mental interpretation of teachers when experiencing stress causes. The Teacher Stress Inventory of Fimian (Citation1984) lacks the important teacher stress causes such as student misbehaviour, role ambiguity, and poor relationship with students, supervior, and colleagues. In addition, the teacher stress questionnaire of Kyriacou and Sutcliffe (Citation1978) and the stress questionnaire of Borg and Riding (Citation1991) do not include two of the important stress causes which seem to recur consistelty in most of the teacher stress literature, namely poor relationship with students and role ambiguity.
None of the mentioned teacher stress questionnaires cover the broad scope of stress causes and stress responses that we are aiming for. Therefore, the knowledge base on teacher stress will benefit from the construction of a more comprehensive teacher stress measure covering the broad scope of stress causes and stress responses experienced by BTs. Because the QEEW has been proven to be a robust and widely used questionnaire measuring general stress across professions including teaching, the QEEW will be used as the point of departure to create the Questionnaire on the Experience and Evaluation of Work – Beginning Teachers (QEEW-BT), and we will be both modifying the source and adding scales to it to make it more specific for the context of BTs.
The studies
Two studies were conducted using different samples of secondary education teachers in the Netherlands. Study 1 focuses on adjusting the QEEW to measure general and teacher specific stress causes and stress responses of beginning teachers (BTs), resulting in the concept version of the QEEW-BT. Study 2 focuses on cross-validating the factor structure of the QEEW-BT and on examining the internal consistency, scalability, construct validity and criterion validity of the QEEW-BT, resulting in the final version of the QEEW-BT. Permission to conduct the studies was taken from the concerned authorities of all the schools before the studies were conducted. Also, participants were aware that participation was voluntary and that they could stop participating at any stage of the studies.
Study 1: adjusting the QEEW resulting in the QEEW-BT
Method
Participants
Sample 1 consisted of 356 beginning teachers from 52 different secondary school locations in the Netherlands (see ). The percentage of female teachers is slightly higher (56.7%) compared to the national secondary school teachers population. The percentage of school locations with less than 1000 students is lower than in the national population. The percentage of school locations with between 1000 and 2000 is higher in this sample than in the national population. The percentage of qualified teachers is lower than in the national population, both compared to teachers from all ages as well as teachers who are younger than 35 years. The distribution of the denomination, urbanization and SES percentages differ greatly between the national population and the sample. This can be explained by the distribution of the school locations over the regions in the Netherlands (see ). The northern regions of the Netherlands (Drenthe, Friesland, and Groningen) are overrepresented. In these regions there are only two catholic school locations. Also, the urbanization and the SES in these regions is lower compared to most of the other regions in the Netherlands.
Table 1. Information on the samples and population.
Table 2. Distribution of school locations (correspond to Dutch provinces) in both samples (in percentages).
Measures
BTs from sample 1 completed the QEEW around the end of the school year 2012 (April, measurement occasion 1). BTs were defined as teachers who recently obtained their teaching qualification or would obtain this within a year and had less than three years of teaching experience. In addition, one class of students per BT filled in the student questionnaire measuring perceived teaching behaviour (students’ perceptions of the teachers’ ability on the six domains described below; Maulana, Helms-Lorenz, and van de Grift Citation2015) also around April for three consecutive years (measurement occasion 1, 2, 3). For each school the contact person of the school randomly chose one of the BTs’ classes to fill in the student questionnaire, and a survey administrator supervised the students whilst they were completing the questionnaire (the BT was not allowed to be present). Students were instructed and informed that participation was voluntary and that their answers would be treated anonymously.
Perceived teaching behaviour
Perceived teaching behaviour was measured using an unidimensional student questionnaire consisting of the six domains; safe and stimulating learning climate, efficient classroom management, clear instruction, activating learning, differentiated teaching, and teaching-learning strategies. A total of 6291 students completed the student questionnaire for 281 of the BTs from sample 1 on measurement occasion 1, and a total of 4811 students for 208 of the BTs from sample on measurement occasion 3. The individual student ratings were aggregated to classroom level for which mean averages were used. The instrument had a good internal consistency (Cronbach’s alpha = .80), and consisted of 24 questions rated on a four-point Likert scale ranging from 1 (completely disagree) to 4 (completely agree) (Maulana, Helms-Lorenz, and van de Grift Citation2015). Change in perceived teaching behaviour was operationalized as the gain score between measurement occasion 1 and 3. For 176 of the BTs from sample 1 the student questionnaire was completed both on occasion 1 and occasion 3, representing 4580 student questionnaires.
Stress causes and stress responses
Stress causes and stress responses were measured with the original QEEW (Van Veldhoven and Meijman Citation1994). All 27 scales (201 items) were used (see Appendix A for an overview of the scales). The internal consistency and validity of this questionnaire was good (Evers, Van Vliet-Mulder, and Groot Citation2000). Most scales had a good internal consistency (Cronbach’s alpha > .80) and five scales had a satisfactory internal consistency (Cronbach’s alpha between .65 and .79) in our sample.
Dropout
Dropout was registered between measurement occasion 1 and 3 when teachers left their first teaching job (1 = job leaver, 0 = stayer).
Analytic approach
In order to adjust the QEEW to measure general and teacher specific stress causes and stress responses of beginning secondary school teachers in the Netherlands, four systematic steps were followed.
Step 1. Examining and selecting the QEEW scales which are applicable for the beginning teacher context. The QEEW has 27 scales of which we intend to select only those scales that capture the broader scope of stress causes and stress responses. This was achieved by examining and selecting the scales from the QEEW which belonged to second order stress causes and stress responses scales. Second order scales are aggregated scales that measure more aspects (derived from the primary scales) of one latent construct. To examine whether the second order factor structures for the stress causes and stress responses of BTs are similar to that of employees from a variety of occupations as indicated by Van Veldhoven (Van Veldhoven, Appendix B structure 1), Confirmatory Factor Analyses (CFAs) were conducted at the scale level (see Appendix C for an explanation of the technical and statistical terms). The second order factor structures of BTs appeared to be different from that of employees from a variety of occupations. Therefore, the factor structures were explored by means of Principal Component Analyses (PCAs). The PCAs reflect a formative measurement model, meaning that the measured variables are considered to be the cause of the latent variable. In Appendix B both second order factor structures can be found (structure 1 and 2a and 2b). The new factor structure still consisted of 4 factors representing stress causes (structure 2a) and 2 factors representing stress responses (structure 2b). However, role conflict which belonged to the factor of social and organizational aspects in the structure for employees from a variety of occupations belongs to the factor of high psychological task demands in the BT structure. Lack of job autonomy belonged to lack of influence, whereas in the BT structure it belonged to the factor lack of development opportunities. Lack of communication which originally belonged to the factor social and organizational aspects appeared to belong to the factor lack of influence in the BT structure. Finally, poor sleeping quality and tiredness during work belong to the stress response tension in the BT structure. Scales within the PCA factor structure (all scales in structure 2a and 2b) were selected for our purposes to capture the broader scope of stress causes and responses.
Step 2. This step was used to identify scales having significant predictive values for dropout or change in perceived teaching behaviour using regression analyses. Scales that revealed predictive value were selected for our purposes.
Step 3. In order to create a more cost-effective teacher stress instrument with high conciseness and precision (thus avoiding redundancy) and increased user friendliness (i.e. reducing fatigue effects) item reduction was needed. Items from the scales selected in step 1 and 2 were deleted stepwise during three rounds of item reduction, which was consistent with the procedure taken by earlier initiatives for item reduction of the QEEW (Notelaers et al. Citation2007; Van Veldhoven et al. Citation2015). Consistent with the procedure taken by Van Veldhoven (Citation1996), Mokken scaling item reduction procedure was conducted. More specifically, the more restrictive double monotonicity Mokken model was applied (Mokken Citation1971). The assumption of Unidimensionality was tested by conducting the Mokken analysis for each stress scale. Items with item-scalability values (H(i)-values) below .30 violated the assumption of Unidimensionality and were therefore deleted. The assumption of local independency, was tested by means of the LD X2 statistic (Chen and Thissen Citation1997). Standardized X2 values above 10 indicate violation of the local independency assumption. The assumption of non-intersecting item response curves was checked using the information from non-intersection based on P-Matrix. Crit value above 80 is a strong violation of the assumption of non-intersecting response curves (Molenaar and Sijtsma Citation2000).
In the second round of item reduction, items measuring the same content were deleted. This was achieved by checking the mean score of the items. Items with the same mean score (or within a distance of .10) were checked in terms of their content. If the items were similar in content the item with the lowest H(i) score was deleted. One exception to this rule was made for scales with a significant predictive value for change in perceived teaching behaviour and/or dropout. Items in those scales were only deleted if the predictive value of the scale for perceived teaching behaviour and/or dropout remained significant after deletion.
The last round of deletion was content-based. The aim was to reduce the amount of original items in the scale to about 50%. Factor loadings of the items on the scale were calculated and the items with the lowest factor loading were deleted stepwise if after deletion the scale internal consistency was minimal .70, the scalability (H(t)) minimal .40 and the amount of items per subtopic in the scale was well balanced. That is, the scale lack of job variety for example has items regarding ‘Task variety’ (subject A) and items regarding ‘Creativity’ (subject B). The reduced scales has three items regarding subject A and three regarding subject B.
Step 4. As the QEEW measures general stress causes and stress responses, during this step teacher stress causes based on the teacher stress literature were added.
An overview of the steps can be found in below.
Table 3. Overview of the steps.
Results
Step 1: second order factor structure of the QEEW
For the stress causes the CFA-model showed poor fit (χ2 = 297.32, df = 59, p < .001; RMSEA = .11; CFI = .81; TLI = .75; SRMR = .08). The CFA-model for stress responses also showed poor fit (χ2 = 92.33, df = 8, p < .001; RMSEA = .18; CFI = .86; TLI = .73; SRMR = .07). In both models the modification indices indicated ways to improve model-data fit by allowing correlations between scales from the same factor. Nevertheless, allowing scales to correlate did not result in acceptable model-data fit.
PCA was conducted on the 19 stress causes scales using (in line with the development of the original QEEW) orthogonal rotation (varimax). Preliminary analyses supported the adequacy to conduct PCAs. Initial analyses were run to obtain eigenvalues for each component in the data. Six components had eigenvalues over Kaiser’s criterion of 1 and in combination explained 61.63% of the variance. Given the relatively large sample size, and the convergence of the scree plot and Kaiser’s criterion on six components, four components were retained in the final analysis. PCA was repeated this time with four fixed factors (see Appendix B structure 2a for the factor structure and the factor loadings).
PCA was also conducted on the eight stress responses scales. Two components had eigenvalues over Kaiser’s criterion of 1 and in combination explained 62.79% of the variance (see Appendix B structure 2b, and Appendix A for an overview of which stress causes and responses scales were selected in step 1).
Step 2: predictive value
None of the non-selected scales (scales which were not part of a higher order scale, step 1) had significant correlations with change in perceived teaching behaviour. Therefore no regression analysis was performed and no scales were selected based on this criterion.
Two scales, uncertainty about the future and changes in tasks, showed significant correlations with dropout. Therefore, logistic regression analysis was conducted to predict dropout using these two scales. Uncertainty about the future was a significant predictor of dropout (χ2 = 11.675, p < .001, df = 1 with Exp(b) = 1.61, b = .48, SE = .14, Nagelkerke R2 = .06). Therefore, this scale was retained (see Appendix A, step 2).
A total of 22 scales had a predictive value for dropout and/or were part of a higher order scale and were therefore selected for the QEEW-BT. The five scales physical effort, lack of possibilities for contact, lack of career opportunities, lack of remuneration, and changes in tasks were not included in the QEEW-BT (25 items). These scales were not part of a higher order scale (step 1) and did not predict dropout and/or teaching behaviour (no evidence of predictive validity).
Step 3: item reduction
Eight items were deleted as they violated the assumption of Unidimensionality. Four item pairs violated the assumption of local independency. For three out of these four item pairs, the content of the two questions was clearly different, therefore no items were removed. For the last item pair the content was similar. Therefore, the item with the lowest H(i) score was removed. Lastly, two items were deleted as they violated the assumption of non-intersecting response curves.
In the second round of item deletion a total of 20 items were deleted. In the final round of item deletion another 16 items were deleted. A total of 129 items from the QEEW were used for the QEEW-BT.
Step 4: additional scales
Based on the literature review, additional stress causes which need to be included in a teacher stress questionnaire involve: education specific workload (e.g. big classes), student misbehaviour, poor relationships at work (students, supervisor, colleagues), role ambiguity, lack of job autonomy, and poor school ethos. Stress causes concerning poor relationships with supervisor, colleagues, role ambiguity and lack of job autonomy were already included in the QEEW. The other stress causes were not included in the original QEEW and were therefore added to the QEEW-BT (46 items, see for an overview of the additional scales, example of items and the sources).
Table 4. Overview of new scales and sources.
The items regarding poor relationship with students were divided into two scales: poor relationship with students 1 and poor relationship with students 2. Both scales cover items measuring teacher-student relationships. However, both scales differ in terms of the response category. The items of the first scale were provided on a four-point Likert scale ranging from 0 (completely disagree) to 3 (completely agree), while those of the second scale were scored on a five-point Likert scale ranging from 1 (definitely not applicable) to 5 (certainly applicable).
An overview of the steps, scales and number of items per scales can be found in Appendix A.
Study 2: cross-validation
Method
Participants
Study 2 included a total sample of 143 beginning teachers from 61 different secondary school locations in the Netherlands (see ). The percentage of female teachers is slightly higher (57.3%) compared to the national secondary school teachers population. The percentage of school locations with less than 1000 students is lower than in the national population. The percentage of school locations with between 1000 and 2000 students is higher in the samples than in the national population. The percentage of qualified teachers is higher than in the national population. The distribution of the denomination, urbanization and SES percentages differ greatly between the national population and the sample. Similar to sample 1, the northern regions of the Netherlands (Drenthe, Friesland, and Groningen) are overrepresented.
Measures
Stress causes and stress responses
Stress causes and stress responses were measured with the QEEW-BT (see Appendix A). The teachers received the questionnaire digitally and they had to fill it in within a three month period.
Perceived teaching behaviour
Perceived teaching behaviour was measured during the same period as the stress causes and responses. The instrument and procedure for this measure are similar to study 1. A total of 1736 students completed the questionnaire for 86 of the BTs of sample 2.
Analytic approach
Using sample 2 the scalability of the 46 newly constructed items were tested using Mokken scaling. The same assumptions and criteria were employed consistent with study 1. The internal consistency of all QEEW-BT scales was investigated by calculating the Cronbach’s alpha and the H(t). The construct validity was investigated by correlating the new stress causes scales with the stress responses scales. The criterion validity was established by correlating the new teacher specific scales with perceived teaching behaviour, see for the path of influence. Finally, the factor structure of the QEEW-BT was explored using PCAs.
Figure 1. Path of influence stress causes, stress responses, and stress outcomes.
Results
Scalability
From the 46 newly constructed teacher specific items 5 items violated the assumption of unidimensionality and were therefore deleted. An overview of the final version of the QEEW-BT can be found in Appendix A.
Internal consistency
Appendix A indicates that all newly developed scales show satisfactory to good internal consistencies (Cronbach’s alpha .76–.89). The QEEW-BT has 14 scales with good internal consistency and 13 scales with satisfactory internal consistency (Cronbach’s alpha .70–.94). Further, all scales have sufficient H(t) values (.40–.82).
Construct validity
In the results of the correlations between the new stress causes scales and the stress responses scales are displayed. The results show that the teacher specific stress causes have significant positive relationships with many of the stress responses (Spearman’s rho ranging from .15 and .52, non-normally distributed data).
Table 5. Correlation (Spearman’s rho) between new stress causes scales and stress responses scales.
Criterion validity
In the results of the correlations between the new stress causes scales with perceived teaching behaviour scale are displayed. The scales student misbehaviour, poor relationship with students 1 and poor relationship with students 2 are negatively related to the perceived teaching behaviour scale (Spearman’s rho −.52, −.31, and −.38).
Table 6. Correlation (Spearman’s rho) between new stress causes scales and perceived teaching behaviour.
Second order factor structure QEEW-BT
PCA was conducted on the 19 stress causes scales with orthogonal rotation (varimax). Initial analyses showed that the scales lack of communication and uncertainty about the future correlated with no other scales and were therefore not included in further analyses of the structure. The PCA was conducted on the remaining 17 stress causes scales with orthogonal rotation. Preliminary analyses supported the adequacy to conduct PCAs and were run to obtain eigenvalues for each component in the data. Five components had eigenvalues over Kaiser’s criterion of 1 and in combination explained 66.06% of the variance (see Appendix B structure 3a for the factor structure and the factor loadings).
PCA was also conducted on the eight stress responses scales. Three components had eigenvalues over Kaiser’s criterion of 1 and in combination explained 70.68% of the variance (see Appendix B structure 3b).
Conclusions and discussion
The main aim of this study was to adapt the Questionnaire on the Experience and Evaluation of Work (QEEW) in order to measure stress causes and stress responses of beginning secondary school teachers in the Netherlands. We found that stress of novice employees in the teaching professions manifests itself in a unique way. Suitable QEEW scales were selected and an item reduction procedure was applied. Furthermore, relevant teacher specific stress scales were added resulting in the QEEW-BT. In the second study the factor structure, internal consistency and validity of the QEEW-BT were examined, resulting in the final version of the QEEW-BT.
It was found that the majority of the original QEEW scales were relevant for use in the BTs context. The scales physical effort, lack of possibilities for contact, lack of career opportunities, lack of remuneration, and changes in tasks were evaluated to be not relevant. Those scales did not belong to a higher order scale and did not have predictive value for dropout and/or teaching behaviour. For the relevant scales the item reduction procedure resulted in a reduction to nearly half of the original questionnaire. For physical effort and changes in tasks a restriction of range seems evident. Most BTs (around 90%) in sample 1 never or only sometimes experienced stress caused by physical effort or changes in tasks. There was more variation on the scales lack of possibilities for contact, lack of career opportunities, and lack of remuneration. However, these stress causes did not seem to influence BTs dropout or perceived teaching behaviour.
Based on teacher stress literature, items regarding student misbehaviour, poor relationship with students, poor school climate and education specific workload were identified as relevant and added to the QEEW resulting in the QEEW-BT (see Apendix A for the final version). These additional scales had significant positive correlations with the stress responses scales, meaning that higher levels on one or more of the teacher specific stress causes scales were associated with higher levels on one or more of the stress responses scales. This is in line with findings of Mearns and Cain (Citation2003), adding to the construct validity of the scale and highlighting the importance of measuring these teacher specific stress causes.
More unique to the QEEW-BT, compared to other (teacher) stress questionnaires, are the scales regarding poor relationship with students. This study showed that poor relationships with students are positively related to lack of work pleasure, lack of organizational commitment, turnover, emotional reactions during work, tiredness during work, need for recovery, and poor sleep quality. Furthermore, a negative relationship between poor relationships with students and BTs perceived teaching behaviour was revealed. Therefore, there is evidence that poor relationships between the teacher and their students do not only influence students’ school engagement and achievement negatively (Roorda et al. Citation2011), but also affect teachers’ stress responses and perceived teaching behaviour in a negative fashion.
Student misbehaviour also showed a negative relationship with BTs perceived teaching behaviour. This is in line with earlier research showing that teachers with great levels of stress caused by student misbehaviour have lower levels of perceived personal accomplishment (Abel and Sewell Citation1999; Kokkinos Citation2007).
Most scales of the QEEW-BT had good internal consistencies and some had satisfactory internal consistencies. The PCA conducted on the stress causes of the QEEW-BT showed that the new scales education specific workload and poor school climate loaded on the existing higher order factors. Whereas, the scales poor relationship with students 1, poor relationship with students 2, and student misbehaviour together loaded on a new higher order factor, students. Thereby adding a new and important factor to the questionnaire. The PCA conducted on the stress responses also showed a new factor, negative emotions, with the scales emotional reactions during work and lack of work pleasure. These scales correlated highly with each other (Spearman’s rho .66 in sample 2), meaning that higher levels on emotional reactions during work are associated with more lack of work pleasure. This is in line with the findings of Brackett et al. (Citation2010), who found that the ability to regulate emotions is positively associated with job satisfaction in secondary school teachers.
It is interesting that the scales from the higher order scale students all have positive relationships with lack of work pleasure and emotional reactions during work, whereas the other new scales do not. It seems that students play an important role in the emotional reactions and work pleasure of BTs. This is in line with research of Fokkens-Bruinsma and Canrinus (Citation2014) who found that for pre-service secondary school teachers, working with children/adolescents is in the top three of most important motives to become a teacher. This motive has, in turn, a significant relationship with satisfaction, happiness and affective commitment.
Notwithstanding the strengths, the present study also has limitations. Although the samples were relatively large, both samples included mainly school locations in the northern regions of the Netherlands. Therefore, the distribution of the denomination, urbanization, and SES percentages in our samples differed to some extent from the national population profile. Hence, caution should be taken when interpreting results of this study until replication with larger and more representative samples is available. Another limitation was the size of the second sample (N = 143). Although this sample is sufficient, a larger sample offers more possibility to examine the relationships between the teacher specific scales and dropout, and change in perceived teaching behaviour with more power. Nevertheless, the QEEW was proven to be a robust questionnaire and has been used in many countries with very diverse cultural backgrounds (e.g. UK, USA, China, Malaysia, Australia, Japan, Brazil, Sweden). Also, both the items from the QEEW as well as from the QEEW-BT reflect the stress factors which are highlighted as important stress factors in international research. Another limitation of this study is the use of PCAs to establish the factor structure of the QEEW-BT. Although Mokken scaling was used next to PCA to determine the unidimensionality, the complicated issue of establishing the factor structure would in hindsight be better employed using another advance statistical method. Future research would benefit from using exploratory structural equation modelling (ESEM; Marsh et al. Citation2014) as an alternative for analysing stress factors at the item-level.
To conclude, the QEEW-BT offers an instrument that may improve our understanding of relevant BTs’ work outcomes related to stress, which supports Sparks and Cooper’s (Citation1999) line of thinking advocating the combination of measuring general and specific stressors when assessing specific job settings. The adjustment of the QEEW has resulted in a more comprehensive measure to capture both general and specific stress causes among BTs – the QEEW-BT. Researchers and schools (i.e. coaches, mentors) can use this instrument to provide insight into which stress causes and responses BTs at their school experience in order to adjust their support more right on target to ensure the wellbeing of their (new) teaching staffs. Future research could focus on the question how these stress causes and stress responses influence BTs dropout and change in teaching behaviour.
Disclosure statement
No potential conflict of interest was reported by the authors.
ORCID
Ruth Harmsen http://orcid.org/0000-0001-6567-6341
Additional information
Funding
References
- Abel, M. H., and J. Sewell. 1999. “Stress and Burnout in Rural and Urban Secondary School Teachers.” The Journal of Educational Research 92 (5): 287–293.
- Bakker, A. B., and E. Demerouti. 2007. “The Job Demands-resources Model: State of the Art.” Journal of Managerial Psychology 22: 309–328.
- Bakker, A. B., E. Demerouti, and A. I. Sanz-Vergel. 2014. “Burnout and Work Engagement: The JD–R Approach.” Annual Review of Organizational Psychology and Organizational Behavior 1: 389–411.
- Bandalos, D. L., and S. J. Finney. 2010. “Factor Analysis: Exploratory and Confirmatory.” In The Reviewer’s Guide to Quantitative Methods in the Social Sciences, edited by G. R. Hancock and R. O. Mueller, 93–114. New York, NY: Routledge.
- Betoret, F. D. 2006. “Stressors, Self-efficacy, Coping Resources, and Burnout Among Secondary School Teachers in Spain.” Educational Psychology 26 (4): 519–539.
- Borg, M. G., and R. J. Riding. 1991. “Towards a Model for the Determinants of Occupational Stress Among Schoolteachers.” European Journal of Psychology of Education 6 (4): 355–373.
- Brackett, M. A., R. Palomera, J. Mojsa-Kaja, M. R. Reyes, and P. Salovey. 2010. “Emotion-regulation Ability, Burnout, and Job Satisfaction Among British Secondary-school Teachers.” Psychology in the Schools 47 (4): 406–417.
- Buchanan, J. 2010. “May I be Excused? Why Teachers Leave the Profession.” Asia Pacific Journal of Education 30 (2): 199–211.
- Burke, R. J., and E. Greenglass. 1993. “Work Stress, Role Conflict, Social Support, and Psychological Burnout Among Teachers.” Psychological Reports 73 (2): 371–380.
- Chen, M., and G. Miller. 1997. “Teacher Stress: A Review of the International Literature.” Research report No. ED410187. http://files.eric.ed.gov/fulltext/ED410187.pdf.
- Chen, W. H., and D. Thissen. 1997. “Local Dependence Indexes for Item Pairs Using Item Response Theory.” Journal of Educational and Behavioral Statistics 22 (3): 265–289.
- Cortina, J. M. 1993. “What is Coefficient Alpha? An Examination of Theory and Applications.” Journal of Applied Psychology 78 (1): 98–104.
- Evers, A., J. C. Van Vliet-Mulder, and C. J. Groot. 2000. “Documentatie van tests en testresearch in Nederland [Documentation of Tests and Test Research in the Netherlands].” In Testbeschrijvingen, 649–650. Assen: Van Gorcum & Comp. B.V.
- Field, A. 2013. “Exploratory Factor Analysis.” In Discovering Statistics Using IBM SPSS Statistics, edited by A. Field, 627–685. London: Sage.
- Fimian, M. J. 1984. “The Development of an Instrument to Measure Occupational Stress in Teachers: The Teacher Stress Inventory.” Journal of Occupational Psychology 57 (4): 277–293.
- Fokkens-Bruinsma, M., and E. T. Canrinus. 2014. “Motivation for Becoming a Teacher and Engagement with the Profession: Evidence from Different Contexts.” International Journal of Educational Research 65: 65–74.
- Folkman, S. 2013. “Stress: Appraisal and Coping.” In Encyclopedia of Behavioral Medicine, edited by M. D. Gellman, 1913–1915. New York, NY: Springer.
- Fontein, P., P. Prüfer, K. de Vos, and A. Vloet. 2016. “IPTO: bevoegdheden en vakken in het vo [IPTO: Teaching Qualifications and Subjects in Secondary Education].” https://www.rijksoverheid.nl/documenten/rapporten/2016/06/17/ipto-bevoegdheden-en-vakken-in-het-vo.
- Gold, Y., and R. A. Roth. 1993. Teachers Managing Stress and Preventing Burnout: The Professional Health Solution. London: The Falmer Press.
- Gonzalez, L., M. S. Brown, and J. R. Slate. 2008. “Teachers who Left the Teaching Profession: A Qualitative Understanding.” The Qualitative Report 13 (1): 1–11.
- Hanif, R. 2004. “Teacher Stress, Job Performance and Self-efficacy of Women School Teachers.” Doctoral thesis, National Institute of Psychology, Quaid-e-Azam University, Islamabad, Pakistan.
- Hanif, R., S. Tariq, and M. Nadeem. 2011. “Personal and Job Related Predictors of Teacher Stress and job Performance among School Teachers.” Pakistan Journal of Commerce and Social Sciences 5 (2): 319–329.
- Hattie, J. 2012. Visible Learning for Teachers: Maximizing Impact on Learning. London: Routledge.
- Hooftman, W. E., G. M. J. Mars, B. Janssen, E. M. M. de Vroome, and S. N. J. Van den Bossche. 2015. Nationale Enquête Arbeidsomstandigheden 2014. Methodologie en globale resultaten [National Working Conditions Survey 2014. Methodology and Overall Results]. Leiden: TNO.
- Izawa, S., K. Saito, K. Shirotsuki, N. Sugaya, and S. Nomura. 2012. “Effects of Prolonged Stress on Salivary Cortisol and Dehydroepiandrosterone: A Study of a two-Week Teaching Practice.” Psychoneuroendocrinology 37 (6): 852–858.
- Johnson, S., C. Cooper, S. Cartwright, I. Donald, P. Taylor, and C. Millet. 2005. “The Experience of Work-related Stress Across Occupations.” Journal of Managerial Psychology 20 (2): 178–187.
- Klassen, R. M., and M. M. Chiu. 2010. “Effects on Teachers’ Self-efficacy and Job Satisfaction: Teacher Gender, Years of Experience, and Job Stress.” Journal of Educational Psychology 102 (3): 741–756.
- Kokkinos, C. M. 2007. “Job Stressors, Personality and Burnout in Primary School Teachers.” British Journal of Educational Psychology 77 (1): 229–243.
- Koomen, H. M., K. Verschueren, E. Van Schooten, S. Jak, and R. C. Pianta. 2012. “Validating the Student-Teacher Relationship Scale: Testing Factor Structure and Measurement Invariance Across Child Gender and age in a Dutch Sample.” Journal of School Psychology 50 (2): 215–234.
- Kyriacou, C. 2001. “Teacher Stress: Directions for Future Research.” Educational Review 53 (1): 27–35.
- Kyriacou, C., and J. Sutcliffe. 1978. “Teacher Stress: Prevalence, Sources, and Symptoms.” British Journal of Educational Psychology 48 (2): 159–167.
- Lazarus, R. S., and S. Folkman. 1984. Stress, Appraisal, and Coping. New York, NY: Springer.
- Macdonald, D. 1999. “Teacher Dropout: A Review of Literature.” Teaching and Teacher Education 15 (8): 835–848.
- Marsh, H. W., A. J. Morin, P. D. Parker, and G. Kaur. 2014. “Exploratory Structural Equation Modeling: An Integration of the Best Features of Exploratory and Confirmatory Factor Analysis.” Annual Review of Clinical Psychology 10: 85–110.
- Maulana, R., M. Helms-Lorenz, and W. van de Grift. 2015. “Development and Evaluation of a Questionnaire Measuring Pre-service Teachers’ Teaching Behaviour: A Rasch Modelling Approach.” School Effectiveness and School Improvement 26: 169–194.
- McCarthy, C. J., R. G. Lambert, S. Lineback, P. Fitchett, and P. G. Baddouh. 2016. “Assessing Teacher Appraisals and Stress in the Classroom: Review of the Classroom Appraisal of Resources and Demands.” Educational Psychology Review 28: 577–603.
- Mearns, J., and J. E. Cain. 2003. “Relationships between Teachers’ Occupational Stress and Their Burnout and Distress: Roles of Coping and Negative Mood Regulation Expectancies.” Anxiety, Stress & Coping 16 (1): 71–82.
- Ministerie van Onderwijs, Cultuur en Wetenschap [Dutch Ministry of Education]. 2014. “Kerncijfers 2009–2013, Onderwijs, Cultuur en Wetenschap [Key Figures 2009–2013, Education, Culture and Science].” https://www.rijksoverheid.nl/documenten/jaarverslagen/2014/05/21/ocw-kerncijfers.
- Mokken, R. J. 1971. A Theory and Procedure of Scale Analysis. The Hague: Mouton.
- Molenaar, I. W., and K. Sijtsma. 2000. User’s Manual MSP5 for Windows. Groningen: iecProGAMMA.
- Notelaers, G., H. De Witte, M. J. P. M. Van Veldhoven, and J. K. Vermunt. 2007. “Construction and Validation of the Short Inventory to Monitor Psychosocial Hazards.” Médecine du Travail et Ergonomie 44 (1/4): 11–17.
- Payne, M. A., and A. Furnham. 1987. “Dimensions of Occupational Stress in West Indian Secondary School Teachers.” British Journal of Educational Psychology 57 (2): 141–150.
- Ronfeldt, M., S. Loeb, and J. Wyckoff. 2013. “How Teacher Turnover Harms Student Achievement.” American Educational Research Journal 50 (1): 4–36.
- Roorda, D. L., H. M. Koomen, J. L. Spilt, and F. J. Oort. 2011. “The Influence of Affective Teacher–student Relationships on Students’ School Engagement and Achievement a Meta-analytic Approach.” Review of Educational Research 81 (4): 493–529.
- Rudow, B. 1999. Stress and Burnout in the Teaching Profession: European Studies, Issues, and Research Perspectives. New York, NY: Cambridge University Press.
- Shen, J. 1997. “Teacher Retention and Dropout in Public Schools: Evidence from SASS91.” The Journal of Educational Research 91 (2): 81–88.
- Sparks, K., and C. L. Cooper. 1999. “Occupational Differences in the Work-strain Relationship: Towards the Use of Situation-specific Models.” Journal of Occupational and Organizational Psychology 72 (2): 219–229.
- Struyven, K., and G. Vanthournout. 2014. “Teachers’ Exit Decisions: An Investigation into the Reasons why Newly Qualified Teachers Fail to Enter the Teaching Profession or Why Those Who Do Enter Do Not Continue Teaching.” Teaching and Teacher Education 43: 37–45.
- Van de Grift, W. 2007. “Quality of Teaching in Four European Countries: A Review of the Literature and Application of an Assessment Instrument.” Educational Research 49 (2): 127–152.
- Van de Grift, W. J. 2014. “Measuring Teaching Quality in Several European Countries.” School Effectiveness and School Improvement 25 (3): 295–311.
- Van Veldhoven, M. 1996. “Psychosociale arbeidsbelasting en werkstress [Psycho-social workpressure and workstress].” Doctoral thesis, Rijksuniversiteit Groningen, Groningen, Netherlands.
- Van Veldhoven, M., and T. F. Meijman. 1994. Het meten van psychosociale arbeidsbelasting met een vragenlijst: de vragenlijst beleving en beoordeling van de arbeid (VBBA) [Measuring Psycho-social Workpressure and Workstress with a Questionnaire: The Questionnaire on the Experience and Evaluation of Work (QEEW)]. Amsterdam: Nederlands Instituut voor Arbeidsomstandigheden.
- Van Veldhoven, M., J. Prins, P. van der Laken, and L. Dijkstra. 2015. QEEW2. 0; 42 Short Scales for Survey Research on Work, Well-being and Performance. Amsterdam: SKB.
- Wellborn, J., J. Connell, E. Skinner, and L. Pierson. 1992. Teacher as Social Context (TASC). Rochester, NY: University of Rochester.
- Wilhelm, K., J. Dewhurst-Savellis, and G. Parker. 2000. “Teacher Stress? An Analysis of Why Teachers Leave and Why They Stay.” Teachers and Teaching: Theory and Practice 6 (3): 291–304.
Appendices
Appendix A. Overview stress causes and stress responses scales used in each sample, and number of items per scale which are used in each sample and the final version of the QEEW-BT
Appendix B