
ABSTRACT
Assessing student achievement over multiple years is complicated by students’ memberships in shifting upper-level nesting structures. These structures are manifested in (1) annual matriculation to different classrooms and (2) mobility between schools. Failure to model these shifting upper-level nesting structures may bias the inferences researchers make about predictors of student achievement. The current study is a systematic methodological review of 59 multi-year elementary education studies that examine student achievement growth. The review focuses on studies from the previous decade with the hope of better understanding current practices in modeling student growth in multiyear educational research, the extent to which researchers account for shifting upper-level nesting structures, and the percent of variability attributed to different levels. Findings indicate that approaches to address shifting upper-level nesting structures are not consistently applied. Further, many researchers fail to recognize shifting upper-level nesting structures as a potential threat to the validity of their findings. Finally, evidence is presented that suggests even when schools are included in a model additional variability is attributed to classrooms beyond what is attributed to schools. Accordingly, it may be necessary to include multiple classroom memberships, where such data exist, in models that seek to understand contributors to student achievement.
As students matriculate through their education, they experience multiple classroom and school settings which contribute uniquely to their achievement over time. Researchers interested in modeling contributions to this achievement should account for the contributions classrooms and schools make to student achievement (Raudenbush and Bryk, Citation2002). Multilevel modeling addresses nesting within classrooms and schools at a single time point or in cross-sectional studies. Yet, researchers who wish to model the growth in student achievement over multiple years are met with complex, shifting upper-level nesting structures (e.g. multiple classroom or schools) that may require more advanced methodological methods (Beretvas Citation2008, Browne et al. Citation2001, Grimm et al. Citation2017). Because the level of interest examined by researchers might be different in different studies (e.g. classroom, schools, districts), the term ‘shifting upper-level memberships’ is used throughout this paper to refer to nesting above the student level that may change over time. Shifting upper-level memberships in the context of this study refer to any upper-level nesting structures a student is part of that may change over time. Thus, the term is inclusive of both school mobility and annual classroom change.
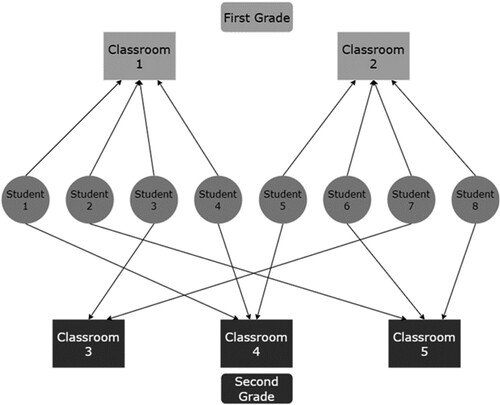
Shifting upper-level memberships are manifested in student achievement data in two primary ways. First, school mobility is the process by which a student transitions from one school to another between measurement occasions. Researchers often rely on excluding students who experience between school mobility during the study, this is sometimes referred to as the ‘delete’ approach (Beretvas Citation2008). Alternatively, researchers may allow the school a student was assigned to at the beginning of the study to remain unchanged throughout, sometimes referred to as the ‘ignore’ or ‘first school’ approach (Chung and Beretvas Citation2012, Goldstein et al. Citation2007). Yet, these approaches may lead to faulty inferences due to improperly modeling the variance in student achievement that could be attributed to different school memberships at different times (Goldstein et al. Citation2007, Luo and Kwok Citation2012). An example of shifting upper-level nesting is provided in , where children in first grade and second grade are assigned to different classrooms. Modeling only the first-grade membership may not accurately reflect the contribution of classrooms at both grades.
Figure 1. Example of shifting upper-level nesting.
In a series of simulations testing multiple rates of mobility, number of schools, number of students per school, different variance covariance matrices for student random effects, and different percentages of upper level variance, relative bias reached unacceptable levels in tested conditions where school mobility was set above 5% (Luo and Kwok Citation2012). Specifically, in conditions where more than 5% of students changed schools from year-to-year, parameter estimates’ relative bias ranged from −.149 to −.345, indicating that school level variance parameters were underestimated between 15% and 35% depending on the tested conditions. Such underestimated variance biases the estimates of student achievement over time leading to inflated standard errors and inaccurate inferences about the predictors of growth (Luo and Kwok Citation2012).
A second way in which shifting upper-level nesting structures are manifested in multi-year student achievement data is in annual classroom change, which is the process of students becoming members of a new classroom every academic year. Annual classroom change is often dealt with using the ‘ignore’ approach where a researcher will account for a student’s classroom membership at the initial time point but will ignore future changes. Or alternatively, a researcher may choose to ignore the classroom level altogether and model data only at the school level.
From a developmental perspective, the two processes described are distinct and likely have different impacts on students and their learning; yet the methods which may be applied statistically to address these processes are the same regardless of which level shifts or what process causes the shift. In a multilevel modeling context, researchers may use cross-classified random effects models to account for different upper-level nesting to decompose the variability in student experience to different upper-level nesting structures (e.g. Mainhard et al. Citation2018). In growth modeling this same structure can be extended to account for shifting nesting at different time points. Cross-classified models allow each measurement occasion of a student to be associated with a unique nesting structure the student experienced at that time (Beretvas Citation2008, McCoach and Kaniskan Citation2010, Raudenbush and Bryk Citation2002). The second method available in a multilevel modeling context is multiple membership random effects models. Multiple memberships allow for different upper-level memberships to contribute to student achievement at a single time point (Browne et al. Citation2001, Chung and Beretvas Citation2012, Goldstein Citation2011). Within a single year study students may participate in multiple overlapping social structures that, if ignored, will bias point estimates and standard errors (Tranmer et al. Citation2014). In a growth model context multiple memberships may be applied to allow for cumulative effects over time so that at a third measurement occasion a student is primarily influenced by the current upper-level membership but also is influenced by previous experiences in the earlier memberships (Bauer et al. Citation2013, Chung and Beretvas Citation2012). When students experience shifting upper-level nesting these two methods each have advantages over multilevel growth modeling that relies on either the ‘ignore’ or ‘delete’ approaches because cross-classified and multiple membership models may be used to address shifting upper-level nesting structures.
In the past decade, methodologists have investigated methods for addressing shifting upper-level memberships that account for both the cross-classified nature of the data and that students are associated with multiple upper-level memberships. In other words, the models proposed both address the issues of different nesting at different times, but also those earlier memberships likely have a contribution to later student achievement. Primarily, such methodological work has focused on addressing mobility between schools (e.g. Bauer et al. Citation2013, Cafri et al. Citation2015, Grady and Beretvas Citation2010, Leroux and Beretvas Citation2018, Luo and Kwok Citation2012). However, some work has investigated applying methods to smaller clusters to accommodate annual classroom change (Lai and Kwok Citation2017, Palardy Citation2010) and even small groups within classrooms (Petscher and Schatschneider Citation2019).
The amount of variance in student achievement at an upper-level is quantified by calculating the variance partition coefficient (VPC), which is the proportion of total variance attributed to the identified level. In unconditional models, models without predictors, this is often called the intraclass correlation or ICC, but as VPC is a more generalized term we refer to this coefficient as the VPC throughout. Thus, identifying the size of VPCs at different levels may provide important information regarding how much of the variability in student achievement is attributed to a specific level and conversely what the impact of ignoring said variance.
Work that explores annual classroom change specifically may be of particular importance considering research that shows when the school level is ignored in multilevel models that variance attributed to school membership is portioned to the classroom (Moerbeek Citation2004). However, when classrooms are ignored the variance explained by classrooms is shared between the upper-level (school) and lower level (students) (Van den Noortgate et al. Citation2005). As such, failing to account for the annual change in classrooms may lead to similarly biased estimates of student achievement. Further, this may be particularly acute in elementary or primary education where students often spend most of the school year within one classroom. The classroom assignment during these early years of schooling may have stronger influence on students as they develop socially with peers and have the opportunity for close relationships with their teachers.
While methodological innovation has attempted to address the issue of shifting upper-level nesting, it is not clear to what extent methods for accounting for shifting upper-level nesting structures are being used in current multi-year educational studies of student achievement.
The current study
The current study seeks to understand the extent to which current educational researchers are addressing shifting upper-level nesting structures and if they are using methods that employ both cross-classification and or multiple memberships in the estimation of student achievement. By conducting a systematic literature review of multi-year elementary education studies published in the last ten years, we hope to find evidence to address the following questions present in the existing literature. What methods researchers are using in modeling student achievement over multiple years? Is there evidence that researchers understand the potential for bias associated with shifting upper-level nesting structures? What amount of variance do researchers report at the school and classroom levels, and how or if researchers address shifting upper-level nesting structures? Better understanding of these questions will help to address a potential gap between methodological innovation and applied educational research.
To that end, the current study seeks to answer four research questions.
What methods are contemporary researchers using to model nested multi-year longitudinal educational data? Specifically, have recently developed methods been adopted by applied researchers?
To what extent are researchers acknowledging the issue of shifting upper-level nesting structures? What modeling approaches are they taking to address shifting upper-level nesting structures?
Does variability exist at upper-levels regardless of student outcomes, modeling approach, or levels modeled?
Methods
The current systematic review follows the Preferred Reporting Items for Systematic Reviews and Meta-Analyses (PRISMA) guidelines for transparent reporting of systematic reviews (Liberati et al. Citation2009). PRISMA provides a framework for transparent and reproducible study search and selection. Each of the following sub-sections in the methods and results sections follow the recommendations for reporting items, how the search should be conducted and communicated so that the process is transparent, and results can be substantiated (PRISMA-P Group et al. Citation2015).
Data collection strategy
The intention of our review is not to present a representative sample of current practice, but rather to uncover, to the extent possible, what methods contemporary researchers are using to model nested multi-year longitudinal educational data and if recently developed methods been taken up by applied researchers. Thus, with the aid of a subject-area reference librarian, we started the systematic search on January 1, 2021. Five databases were selected for search: Academic Search Complete, Education Full Text, Education Research Complete, ERIC, and Institute for Educational Sciences. The search was conducted using the following search terms ‘longitudinal studies or longitudinal research or longitudinal method,’ and ‘growth model or growth modeling,’ and ‘elementary school or primary school or grade school,’ and ‘multilevel modeling or hierarchical linear modeling.’ Additionally, several limiters were placed on the search results. The search included limiters, ‘published in English’, ‘published in a scholarly or peer reviewed journal,’ and ‘published between January 1, 2010 and December 31, 2020.’ In addition to the database search google scholar was used to identify articles which had cited four primary methodological articles of interest which have proposed models for addressing shifting upper-level nesting structures (Bauer et al. Citation2013, Cafri et al. Citation2015, Grady and Beretvas Citation2010, Palardy Citation2010). The decision to include citations of these studies in the literature search was motivated by an interest in identifying as many articles as possible that may have adopted one of these methods. Finally, a recently published systematic review of cross-classified multilevel models in health studies excluded 95 studies that were related to education (Barker et al. Citation2020). We contacted the authors of the systematic review and they shared the list of education studies which were excluded from their study.
Citation management
All citations were collected on Zotero (www.zotero.org). Citations were then exported to Excel for inclusion consideration and data extraction. Studies were sorted by title and author and duplicates were identified and removed. Additionally, database searches using EBSCO host excluded duplicate articles; these are included in the count of duplicates provided in the results section.
Inclusion criteria
Studies were selected for inclusion in this systematic review by meeting the following criteria. First, the study had to be published in English. Second, the study had to be published in a peer reviewed journal. Conference presentations, dissertations, book chapters, and white papers were excluded. Third, the study needed to examine data collected from a sample of students over more than a single academic year. Academic years may start and end at different time points in different school districts or countries. To address this inclusion criteria, we examined the data collection time point to determine if they encompassed at least a full calendar year (e.g. data collection in spring and then the following spring) to determine if more than one academic year was included in the analysis. Because the primary focus of the review is examining how researchers are addressing shifting upper-level memberships in assessing student growth, it is important that the study examines data from students over a period in which most will likely shift one of their upper-level memberships. Fourth, the population of interest is elementary or primary school students. Elementary or primary school is defined as kindergarten through 6th grade. If a study included at least two measurements inside the range but one fell outside of that range (e.g. preschool, kindergarten, first grade measurements) the study was included. Conversely, if only a single measurement occasion was within the range, the study was excluded. The review focuses on primary school years, because often students are primarily nested within a single classroom during these years. In secondary education, students often shift between multiple classrooms during the day which presents a distinct methodological challenge that is outside the intended scope of this research.
Fifth, included studies must report a continuous, quantitative student level outcome. The sixth inclusionary criteria concern the sample size of the examined studies. The sample examined in the study had to include at least 20 upper-level clusters. Previous research suggests that fewer than 20 clusters produces unacceptable levels of bias and coverage of the 95% confidence interval (Chung et al. Citation2018, McNeish and Stapleton Citation2016). Thus, studies with less than 20 clusters may be justified in ignoring upper-level nesting. In cases where the number of clusters was not reported, studies were included if the sample was greater than 100 and if students had been recruited in a way that the nesting structures would be relevant (e.g. from schools or classrooms). For example, a study concerning a sample of twins would be excluded even if the sample were greater than 100, because it is unlikely that more than one twin pair shared a similar classroom. In terms of focus, studies were excluded if they were focused on methodological comparisons, even in instances where real data was used. Methodological comparisons were excluded because the focus of this type of work is to illustrate or educate about modeling approaches rather than to report on factors contributing to student growth. Finally, meta-analysis, systematic reviews, essays, or other synthesis work were excluded.
Study selection
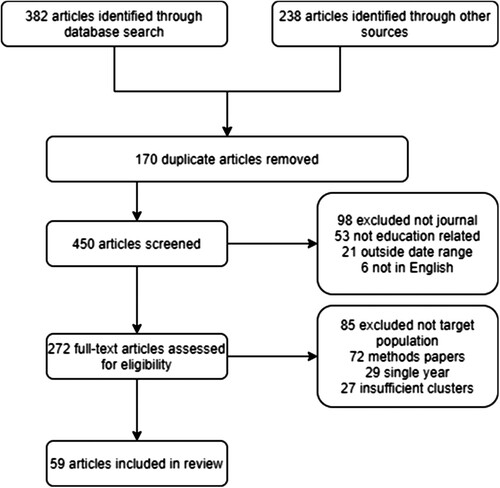
The initial review of studies eliminated studies found to be duplicates, not published in English or not published in peer reviewed journals. A second review of studies examined the article abstract to determine if the study met the inclusion criteria. Remaining studies received a full text review to determine inclusion. All studies excluded from the review, including duplicates, were catalogued with reason for exclusion and are available in online supplementary materials (https://osf.io/tjhfm/). Summary counts of excluded studies and the reasons why are presented in , a decision tree (PRISMA chart) as suggested in Liberati and colleagues (Citation2009).
Figure 2. PRISMA flow diagram of study identification.
Data extraction
The following reference data was extracted from studies included in the review: article title, first author’s last name, journal, volume, and publication year. In instances where a study was published first online and later in print the publication year for the print version was included.
Additionally, data relevant to addressing the current research questions were extracted from each included study. First, the construct or type of quantitative student outcome as reported by the study (e.g. reading achievement, student behaviour). Second, we collected the type of data source used to measure the outcome as reported by the study. For example, a standardized test, teacher report, state assessment, or efficacy trial. Third, the analytic sample size, including numbers of students and upper-level membership when provided. Fourth, the type and number of levels of upper-level memberships addressed. Fifth, VPCs of the unconditional models were extracted for all tested outcomes and for each upper-level modeled when provided by study authors. In cases in which VPCs were not provided, but unconditional model variances are provided without we will calculate VPCs for each outcome and each level modeled. For example, if a study examines reading and math outcomes and includes both classrooms and schools in its modeling approach, we report both the reading and math VPCs for the classroom level and school level for a total of four VPCs. Sixth, the modeling approach used in the assessment of student growth is reported (e.g. latent growth modeling, cross-classified growth modeling, multilevel growth modeling, etc.). Seventh, whether the study authors addressed shifting upper-level memberships. Eighth, whether study authors acknowledge shifting upper-level memberships may present limitations or complexity not assessed in the modeling approach. Finally, if shifting upper-level memberships were addressed, a short description of how the study authors addressed this will be provided. All relevant extracted data will be presented in tables within the text.
Data synthesis
All reference and study data were extracted into Excel for coding and validation. Additional data collected, but not presented in the current paper is provided in supplementary online materials (https://osf.io/tjhfm/).
Analysis approaches
Traditional approaches
As discussed in the introduction a primary motivation for this review was to determine if recent methodological innovations in multilevel growth modeling are being taken up by contemporary researchers. To summarize, multilevel growth model (ML-GCM) includes measurements at different time points nested within the individual. Above the individual additional levels may be added that include mean intercept and slope values. These values may be allowed to vary randomly so that each classroom or school, for example, would have an error term associated with the mean intercept and slope value that quantifies the shared variability associated with that upper-level nesting structure. This approach, while widely accepted, is limited in multiyear educational studies because it only allows for a membership at one time point to be accounted for. Another approach to deal with upper-level nesting is to estimate cluster robust standard errors. Such an approach obtains within cluster error correlation after estimating the regression coefficients.
To address shifting upper-level nesting, cross-classified multilevel growth curve models (CCMLM) extend the previously discussed ML-GCM, by adding additional random effects at the upper-level nesting structure intercepts (Beretvas Citation2008). In so doing, variability associated with classroom or school memberships at multiple time points are incorporated into the estimation of student achievement. Similarly, multiple membership growth models (MMGCM) are available to account for shared contributions from more than upper-level nesting structure. In the MMGCM framework, the contribution of different memberships can be weighted if certain memberships are theorized to be greater contributors to student growth. Readers interested in additional detail on these types of models may be found in (Browne et al. Citation2001, Cafri et al. Citation2015, Tranmer et al. Citation2014).
Recent innovations
Of interest in the current review are more recent methods which may better estimate the variability of shifting upper -level nesting structures over multiple year studies. These include, but are not limited to cross-classified multiple membership growth curve models (CCMM-GCM) introduced by Grady and Beretvas (Citation2010). The CCMM-GCM allows random effects for each membership over time to be estimated with the intercept and weighted memberships over time in the estimation of the slope coefficient. Thus, student growth is allowed to vary both at its intercept and in its growth trajectory while accounting for the variability associated with that student’s specific memberships over time. Similarly, dynamic growth models (DGM), which allow group level random effect to vary by time and allow for the researcher to specify the variance covariance structure for these random effects (Bauer et al. Citation2013). Both the DGM and CCMM-GCM reflect variations on the multiple membership multiple classification models introduced by Browne and colleagues (Citation2001). Finally, n-level structural equation models blend multilevel modeling and structural equation modeling allowing for complex group within group estimation over time (Mehta Citation2013, Petscher and Schatschneider Citation2019). Interested readers can find further discussion of model differences with accompanying equations in the supplemental online material available at https://osf.io/tjhfm/.
Importantly, many of these methods require data to be formatted in a long format as opposed to a wide format. In a long format data from each measurement is included in its own row, so that each student will have multiple rows of data depending on the number of assessment occasions.
Results
Review of identified articles
The database search identified 382 articles for review. An additional 238 articles were identified through citations of the selected studies and by contacting the authors of the review of cross-classified models. A PRISMA chart summarizing the articles identified, excluded, and reviewed is provided in . Of the total 620 articles identified, 170 were removed as duplicates. An additional 178 were removed without review because they were not published in English (6), outside of the date range (21), not education related (53), or not published in a peer reviewed journal (98). An additional 213 articles received review of text, but were subsequently removed; of these, 27 had insufficient clusters, 85 were not elementary / primary education, and 29 were single year or cross-sectional studies. Finally, 72 studies were identified as methods papers which included both papers focused on methodological development and comparison, as well as meta-analysis, systematic reviews, and other synthesis work. The remaining 59 articles received a full review and are included in .
Table 1. Reviewed studies by modeling approach.
Methods of accounting for nesting
To address the first research question, what methods are contemporary researchers using to model nested multi-year longitudinal educational data; specifically, have recently developed methods been adapted into applied research, methods used in each reviewed study were extracted and examined. As anticipated, several methods were used to account for the nested nature of the data present in these studies. Eight of the reviewed articles used latent growth or other latent variable approaches. The other 51 articles followed a multilevel modeling approach. Importantly, latent variable approaches are well-suited to estimated individual growth or change over time. However, because latent model approaches often differ in how variability is estimated this paper focuses on studies which use a multilevel approach.
Of the multilevel approaches, multilevel growth curve models (reported as ML-GCM in ) were the most common, accounting for 53% of the total studies reviewed. However, 12 of the studies that used ML-GCMs did not consider any upper-level nesting in modeling student achievement despite sufficient sample and cluster sizes (e.g. McCormick et al. Citation2016, Rugutt and Nur-Awaleh Citation2011, Schulte and Stevens Citation2015). For these, the nesting structure was measurement occasions nested within students.
In multilevel modeling approaches, when four or more measurements were collected, researchers often tested both linear and quadradic growth curves. In four instances, researchers tested piecewise growth and these studies are identified specifically as such in . Studies that communicated in the text of the study that the researchers had used the ‘first class’ or ‘first school’ approach are highlighted. In cases where authors used a multilevel approach but did not communicate a strategy to account for shifting upper-level memberships, then approach is simply listed as ML-GCM.
Additionally, some studies used multilevel modeling without fitting a growth curve. For example, one study collected only two measurements over two academic years and fit a multilevel model which included the pre-test as a predictor of the outcome (Swanson Citation2015). Another outlier was a study which used multilevel modeling an multiple time points, but did not fit a growth curve and instead used the intermediate time point to mediate between the first and final time point (Hughes et al. Citation2013).
The 18 remaining studies reviewed used cross-classified approaches. Most of these studies (17) used a multilevel cross-classified random effects approach (CCMLM in ). No studies were found to use a multiple membership random effect model. In one instance researchers used a cross-classified multiple membership growth curve model (CCMM-GCM in ) to examine reading and math outcomes using national assessment data (Ortega et al. Citation2018)
Shifting upper-level structures
The second research question focused on the extent are researchers acknowledge the issue of shifting upper-level nesting structures and what approaches they are taking to address shifting upper-level nesting structures? To determine the extent to which researchers both acknowledged and addressed the issue of shifting upper-level nesting structures, three pieces of information were collected and are reported in in the columns ‘Mobility acknowledged’ and ‘Mobility addressed’. First, 49% (29) acknowledged that the issue of shifting upper-level nesting structures may present a problem in terms of accurately estimating the variance in student achievement explained by the upper-level of nesting. Of those 29 studies all but six (23) used a modeling technique to address the issue of shifting upper-level nesting structures. These included the 18 studies that used cross-classified approaches. The remaining studies used different approaches such as the previously mentioned mediation model (Hughes et al. Citation2013). Another approach was to alternate the upper-level a student was nested at between the two academic years (Swanson Citation2015). Yet another removed any students who changed schools from the analysis (Rambo-Hernandez and McCoach Citation2015). Additional methods for addressing shifting upper-level nesting structures included fitting models that portioned growth into change between time points (Bulotsky-Shearer and Fantuzzo Citation2011) or cross-classifying classrooms at selected time points (Dağli and Jones Citation2013).
Reported VPCs
The third research question focuses on how large the VPCs reported at classroom and school levels. presents information about reported VPCs. First, it is important to note that more than half of the articles (51%) did not report VPCs or provide variance estimates of unconditional models to make calculations of VPCs possible. There are two likely explanations for VPCs not being reported. First, researchers in some instances used a modeling approached that did not include levels above the student (e.g. McCormick et al. Citation2016, Pässler and Hell Citation2020, Schulte and Stevens Citation2015) these articles may be identified on in the column ‘Levels of Nesting Addressed’. Second, researchers using latent approaches do not regularly consider VPCs as part of their analysis. Of the reviewed articles only one that used a latent approach reported VPCs (Hallinger and Heck Citation2010). However, there were studies included in the review where it would be expected that researchers provide VPCs and did not.
Table 2. Variance partition coefficients by outcome and level modeled.
Studies that modeled only schools
Of the researchers who did provide VPC estimates 46% (13 studies) only included the school level in their modeling approach. In these studies, school level VPCs ranged from 2% to 67% of variance in student achievement across multiple outcomes. It is important to note that much of the variation in this range of VPCs is due to differences in outcomes examined and modeling approaches selected by the researchers. However, these VPCs are included to demonstrate that there is variability associated with school level membership regardless of modeling approach or outcome examined.
Studies that modeled only classrooms
Eight of the reviewed studies provided classroom or teacher level VPCs which ranged from 1.4% to 35.9% of variance across student outcomes. Like the previously noted studies which examined only schools as the upper-level nesting structure, these studies demonstrate that classroom level variability is present regardless of outcome or modeling approach.
Studies that included more than one upper-level nesting structure
In addition to previously mentioned studies, some studies we examined included more than one upper-level nesting structure. In five studies researchers provided both classroom and school level VPCs and in two instances researchers reported school and a higher level of nesting (e.g. neighbourhood and state). Of the studies that reported VPCs at multiple levels variability in student outcomes was present at all levels regardless of the tested outcome. In one study, the classroom and school level VPCs were nearly identical (Jenson et al. Citation2010), yet in other cases the classroom accounted for more variance in student achievement (e.g. Desimone et al. Citation2013, Droop et al. Citation2016), while the school level account for more variance in student achievement than classrooms in other studies (e.g. Heck and Hallinger Citation2014).
Discussion
The current study sought to better understand how applied researchers are addressing the issue of shifting upper-level nesting structures in multiyear educational studies. A thorough literature review identified 59 articles published in the previous decade that met all inclusion criteria.
Regarding the first research question, what methods are contemporary researchers using to model nested multi-year longitudinal educational data? Specifically, have recently developed methods been adopted by applied researchers? The current review provides evidence that researchers are not consistent in the methods they use examine growth and change with shifting upper-level memberships over time. While nearly 86% of the studies took a multilevel approach to examining student growth over time, 65% of those studies did not examine a level higher than the student level or relied on a first class/school approach that did not account for shifting upper-level nesting structures. This finding suggests that researchers may not be familiar with or understand the importance of applying methods that account for shifting nesting structures over time in the assessment of student growth.
Additionally, there is inconsistency in what information is reported regarding the modeling approach used and how that information is reported. For example, only two studies indicated that they specifically selected the upper-level nesting structure at the initial time point. The remaining studies that took a ML-GCM approach did not state what time point the upper-level nesting structure was associated with. Generally, when nesting is only considered at a single time point it can be assumed that it is the initial time point or final time point membership that is being considered. However, greater clarity from researchers on specifically what time point upper-level membership is being considered would be helpful for transparency. Further, while the review found that all studies reported some information about sample sizes and the origin of the data, little else was consistent. For example, most studies did not report the number of clusters in the data. This was surprising particularly in cases where the authors used upper-level nesting structures in the modeling of student achievement. Additionally, a majority (53%) of studies did not report VPCs or provide unconditional variance estimates for the calculation of VPCs. Finally, it is important to note that researchers’ ability to report on these factors is dependent on collecting sufficient data which requires thoughtful planning from the outset of the study.
The second research question sought to understand the extent to which researchers are acknowledging the issue of shifting upper-level nesting structures? What modeling approaches are they taking to address shifting upper-level nesting structures? Noting that our study selection was aimed toward finding studies where it would likely be necessary to address shifting upper-level nesting structures, it is discouraging that half of studies (51%) failed to acknowledge this challenge. However, encouragingly, we did find that about half of the reviewed studies (49%) acknowledged that shifting upper-level nesting structures presented a challenge to analyzing student growth or change. Further, of those 49% who did acknowledge the challenge, 79% of those made an attempt to address this challenge. While the majority of the studies addressed shifting upper-level nesting structures by using a cross-classified approach, we were only able to identify a single study that incorporated both cross-classification and multiple membership in the estimation of variability attributable to shifting upper-level nesting structures (Ortega et al. Citation2018). What remains unclear is under what sample and cluster size conditions is estimating a cross-classified model sufficient to estimate shifting upper-level variability, or rather, when is it necessary to apply a more complex approach such as the CCMM-GCM. Future studies should use simulation and secondary data analysis to investigate these questions.
To address the third research question, does variability exist at upper-levels regardless of student outcomes, modeling approach, or levels modeled, we examined VPCs across outcomes and nesting levels. We found this provided some insight into the importance of accounting for classroom specifically. First, the current study adds evidence that classroom level variance explains variability in student growth beyond that explained by the school membership. For example, in models where both school and classroom level variance estimates were included in the unconditional model, classrooms explained variance in student achievement beyond what was explained by school membership. Second, in two studies that used a cross-classified approach the VPCs associated with classroom change over time explained more than 50% of the variance in student achievement (Ortega et al. Citation2018, Swanson et al. Citation2017). Finally, two studies reported that they dropped the school level from their model because it explained little variance beyond what was explained by the classroom (Droop et al. Citation2016, Tong et al. Citation2017). However, both studies indicated that this may have been caused by the small number of classrooms per school. Considering the evidence provided above, failing to model the variance in student achievement growth attributable to annual classroom change may impact the estimations of student achievement growth.
At present there is a growing literature on the problematic nature of ignoring school mobility in the estimation of student achievement growth (e.g. Cafri et al. Citation2015, Grady and Beretvas Citation2010, Leroux and Beretvas Citation2018, Luo and Kwok Citation2012). However, a similar literature investigating annual classroom change does not currently exist. Yet, if the former issue presents problems in cases with more than 5% mobility (Luo and Kwok Citation2012), clearly the latter must be at least equally problematic in the context of students changing classrooms every year (100% mobility). Further, the problematic nature is evidenced in how diverse the approaches are that researchers use when they do model annual classroom change. As exemplified in one of the reviewed studies, ‘The class level was not included in the models because in many schools that have more than one class per grade, the pupil composition of each class changed each school year. If we had included a class level, we would have had to consider these changes in class composition over time. This would have resulted in very complex models with many cross-classifications’ pg. 830 (Belfi et al. Citation2014). As highlighted in this statement, the methods currently available to applied researchers are not aligned with the complexity of the data they hope to analyze. While methods such as the cross-classified multiple membership growth curve model have been explored in the methodological literature (Grady and Beretvas Citation2010), we were able to find only a single study to have applied such a method (Ortega et al. Citation2018). Further, there does not appear to be a common understanding of when it is appropriate or necessary to model at the classroom level or whether modeling at the classroom level alone can account for school level variance in student achievement growth.
Regarding specific VPCs, there were a few outliers within the findings that warrant some brief discussion. For example, two studies reported VPCs >0.5 meaning that more than 50% of the variability between students on those outcomes was attributed to the upper-levels. However, these large VPCs were likely the result of study specific designs. Rambo-Hernandez and colleagues (Citation2019), for example, reported VPCs of 0.56 for math and 0.58 for reading. Such high VPCs were a product of the type of study they conducted which examined ‘excellence gaps’ between schools in 35 states. As such, the focus of their study was between school differences which may increase the percentage of variability attributed to the school level. Additionally, choice of selected subsamples played a large role in the size of the VPCs. Both Judge (Citation2013) and Dağli and Jones (Citation2013) examined data starting at the kindergarten time point from the Early Childhood Longitudinal Study 1998-1999. However, their respective selected sub-samples of students resulted in between-school VPCs of .02 and 0.673 in reading.
In total, our findings suggest that educational researchers appear to have adapted to the need to account for the nested nature of student data. Yet there remains a gap in the adoption of methods to account for shifting upper-level nesting structures in multi-year educational studies. Additionally, when researchers do attempt to account for shifting upper-level nesting structures, the most common method used appears to be the cross-classified approach. Finally, evidence suggests that ignoring classroom level memberships and accounting for nesting exclusively at the school level may underestimate the amount of variability in student achievement attributable to upper-levels.
Limitations
Although we have attempted to identify all relevant articles, we acknowledge that the search terms and strategy used are not perfect and we may not have captured all relevant studies. Further, it is possible that in some instances we may misunderstand or misinterpret some of the research for this synthesis and we take full responsibility for any misrepresentations present in this review.
Additionally, it is possible that expanding this review to include the secondary years of schooling may have revealed more use of cross-classified or multiple membership models as students generally attend school in multiple classrooms during the day in secondary settings and thus researchers interested in secondary education may be more accustomed to accounting for the effects of more than one classroom.
While it was of interest to include information about VPCs in this study as we sought to examine the variability attributed to classrooms and schools both independently and together, the data we gathered has two limitations. First, the comparison of variability attributed to specific levels resulted in different outcomes across different studies. As such, the VPCs as presented in are wide ranging and are not directly comparable to each other. Rather they are presented to provide the reader with some context for the range of variability VPCs have at different upper-levels. Second, we are not able to make any causal claims regarding the upper-levels modeled and the different VPCs reported.
Conclusions and future directions
The current study provides evidence for how researchers are modeling student achievement over time. However, many questions persist within the methodological literature concerning when it is necessary to model shifting upper-level nesting structures and how to accomplish such modeling with precision. Based on the findings from the current study, methodological research should further investigate the impact of ignoring annual classroom change in both existing datasets and through simulations. Additionally, a meta-analytic study should be conducted to investigate the potential effects VPCs present in the assessment of student achievement growth over time.
Disclosure statement
No potential conflict of interest was reported by the author(s).
References
- Barker, K.M., et al., 2020. Cross-classified multilevel models (CCMM) in health research: a systematic review of published empirical studies and recommendations for best practices. SSM - population health, 12 (December), 100661. doi:10.1016/j.ssmph.2020.100661.
- Bauer, D.J., et al., 2013. Analyzing repeated measures data on individuals nested within groups: accounting for dynamic group effects. Psychological methods, 18 (1), 1–14. doi:10.1037/a0030639.
- *Belfi, B., et al., 2014. Inequality in language achievement growth? An investigation into the impact of pupil socio-ethnic background and school socio-ethnic composition. British educational research journal, 40 (5), 820–846. doi:10.1002/berj.3115.
- *Belfi, B., Haelermans, C., and De Fraine, B., 2016. The long-term differential achievement effects of school socioeconomic composition in primary education: a propensity score matching approach. British journal of educational psychology, 86 (4), 501–525. doi:10.1111/bjep.12120.
- Beretvas, S.N., 2008. Cross-classified random effects models. In: A. A. O’Connell, and D. B. McCoach, eds. Multilevel modeling of educational data. Quantitative methods in education and the behavioral sciences: issues, research, and teaching. Information Age Publishing.
- *Blanton, M., et al., 2019. Does early algebra matter? The effectiveness of an early algebra intervention in grades 3 to 5. American educational research journal, 56 (5), 1930–1972. doi:10.3102/0002831219832301.
- Browne, W.J., Goldstein, H., and Rasbash, J., 2001. Multiple membership multiple classification (MMMC) models. Statistical modelling, 1, 103–124.
- *Bulotsky-Shearer, R.J., and Fantuzzo, J.W., 2011. Preschool behavior problems in classroom learning situations and literacy outcomes in kindergarten and first grade. Early childhood research quarterly, 26 (1), 61–73. doi:10.1016/j.ecresq.2010.04.004.
- Cafri, G., Hedeker, D., and Aarons, G.A., 2015. An introduction and integration of cross-classified, multiple membership, and dynamic group random-effects models. Psychological methods, 20 (4), 407.
- Chung, H., et al., 2018. The impact of sample size in cross-classified multiple membership multilevel models. Journal of modern applied statistical methods, 17 (1), jmasm.eP2491. doi:10.22237/jmasm/1542209860.
- Chung, H., and Beretvas, S.N., 2012. The impact of ignoring multiple membership data structures in multilevel models. British journal of mathematical and statistical psychology, 65 (2), 185–200. doi:10.1111/j.2044-8317.2011.02023.x.
- *Csizmadia, A., and Ispa, J.M., 2014. Black-White biracial children's social development from kindergarten to fifth grade: links with racial identification, gender, and socioeconomic status. Social development, 23 (1), 157–177. doi:10.1111/sode.12037.
- *Dağli, Ü.Y., and Jones, I., 2013. The longitudinal effects of kindergarten enrollment and relative age on children’s academic achievement. Teachers college record: The voice of scholarship in education, 115 (3), 1–40. doi:10.1177/016146811311500308.
- *Desimone, L.M., Smith, T.M., and Phillips, K.J.R., 2013. Linking student achievement growth to professional development participation and changes in instruction: A longitudinal study of elementary students and teachers in title I schools. Teachers college record: The voice of scholarship in education, 115 (5), 1–46. doi:10.1177/016146811311500508.
- *Droop, M., et al., 2016. Long-term effects of strategic Reading instruction in the intermediate elementary grades. Journal of research on educational effectiveness, 9 (1), 77–102. doi:10.1080/19345747.2015.1065528.
- *Dumas, D., et al., 2019. Preschool mathematics intervention Can significantly improve student learning trajectories through elementary school. Aera open, 5 (4), 233285841987944–15. doi:10.1177/2332858419879446.
- *Foorman, B.R., et al., 2010. Reading first in Florida: five years of improvement. Journal of literacy research, 42 (1), 71–93. doi:10.1080/10862960903583202.
- *Friedel, J.M., et al., 2010. Changes in efficacy beliefs in mathematics across the transition to middle school: examining the effects of perceived teacher and parent goal emphases. Journal of educational psychology, 102 (1), 102–114. doi:10.1037/a0017590.
- *Gadaire, D.M., Henrich, C.C., and Finn-Stevenson, M., 2017. Longitudinal effects of parent–child interactions on children’s social competence. Research on social work practice, 27 (7), 767–778. doi:10.1177/1049731516632592.
- *Gallant, D.J., 2013. Using first-grade teacher ratings to predict third-grade English language arts and mathematics achievement on a high-stakes statewide assessment. International electronic journal of elementary education, 5 (2), 125–142.
- Goldstein, Harvey. 2011. Multilevel statistical models. 4th ed. Wiley.
- Goldstein, H., Burgess, S., and McConnell, B., 2007. Modelling the effect of pupil mobility on school differences in educational achievement. Journal of the royal statistical society series A: statistics in society, 170 (4), 941–954. doi:10.1111/j.1467-985X.2007.00491.x.
- Grady, M.W., and Beretvas, S.N., 2010. Incorporating student mobility in achievement growth modeling: a cross-classified multiple membership growth curve model. Multivariate behavioral research, 45 (3), 393–419. doi:10.1080/00273171.2010.483390.
- *Graves, S.L., and Ye, F.F., 2017. Are special education labels accurate for black children? racial differences in academic trajectories of youth diagnosed with specific learning and intellectual disabilities. Journal of black psychology, 43 (2), 192–213. doi:10.1177/0095798416636280.
- *Grillich, L., et al., 2016. Effectiveness evaluation of a health promotion programme in primary schools: A cluster randomised controlled trial. Bmc public health, 16 (1), 679. doi:10.1186/s12889-016-3330-4.
- Grimm, Kevin J., Nilam Ram, and Ryne Estabrook. 2017. Growth modeling: structural equation and multilevel modeling approaches. Guilford Press.
- *Hallinger, P., and Heck, R.H., 2010. Leadership for learning: does collaborative leadership make a difference in school improvement? Educational management administration & leadership, 38 (6), 654–678. doi:10.1177/1741143210379060.
- *Heck, R.H., and Hallinger, P., 2014. Modeling the longitudinal effects of school leadership on teaching and learning. Journal of educational administration, 52 (5), 653–681.
- *Heck, R.H., and Reid, T., 2020. School leadership and school organization: Investigating their effects on school improvement in Reading and math. Zeitschrift für Erziehungswissenschaft, 23 (5), 925–954.
- *Hong, S., and You, S., 2012. Understanding Latino children’s heterogeneous academic growth trajectories: latent growth mixture modeling approach. The journal of educational research, 105 (4), 235–244. doi:10.1080/00220671.2011.584921.
- *Huang, F.L., and Invernizzi, M.A., 2012. The association of kindergarten entry age with early literacy outcomes. The journal of educational research, 105 (6), 431–441. doi:10.1080/00220671.2012.658456.
- *Huang, F.L., Moon, T.R., and Boren, R., 2014. Are the Reading rich getting richer? Testing for the presence of the Matthew effect. Reading & writing quarterly, 30 (2), 95–115. doi:10.1080/10573569.2013.789784.
- *Hughes, J.N., Kwok, O.-M., and Im, M.H., 2013. Effect of retention in first grade on parents’ educational expectations and children’s academic outcomes. American educational research journal, 50 (6), 1336–1359. doi:10.3102/0002831213490784.
- *Jenson, J.M., et al., 2010. Preventing childhood bullying: findings and lessons from the denver public schools trial. Research on social work practice, 20 (5), 509–517. doi:10.1177/1049731509359186.
- *Johnson, U.Y., and Hull, D.M., 2014. Parent involvement and science achievement: a cross-classified multilevel latent growth curve analysis. The journal of educational research, 107 (5), 399–409. doi:10.1080/00220671.2013.807488.
- *Judge, S., 2013. Longitudinal predictors of Reading achievement among at-risk children. Journal of children and poverty, 19 (1), 1–19. doi:10.1080/10796126.2013.765629.
- *Judge, S., and Watson, S.M., 2011. Longitudinal outcomes for mathematics achievement for students with learning disabilities. The journal of educational research, 104 (3), 147–157. doi:10.1080/00220671003636729.
- *Keles, S., et al., 2018. The longitudinal association between internalizing symptoms and academic achievement among immigrant and non-immigrant children in Norway. Scandinavian journal of psychology, 59 (4), 392–406. doi:10.1111/sjop.12454.
- Lai, M.H.C., and Kwok, O.-m., 2017. A model for time-varying cumulative classroom/teacher effects on students’ growth. Society for research in educational effectiveness conference, 8.
- *LeBoeuf, W.A., and Fantuzzo, J.W., 2018. Effects of intradistrict school mobility and high student turnover rates on early Reading achievement. Applied developmental science, 22 (1), 43–57. doi:10.1080/10888691.2016.1211481.
- Leroux, A.J., and Beretvas, S.N., 2018. Estimation of a latent variable regression growth curve model for individuals cross-classified by clusters. Multivariate behavioral research, 53 (2), 231–246. doi:10.1080/00273171.2017.1418654.
- *Li, J., and O’Connell, A.A., 2012. Obesity, high-calorie food intake, and academic achievement trends Among U.S. school children. The journal of educational research, 105 (6), 391–403. doi:10.1080/00220671.2011.646359.
- Liberati, Alessandro, Douglas G. Altman, Jennifer Tetzlaff, Cynthia Mulrow, Peter C. Gøtzsche, John P. A. Ioannidis, Mike Clarke, P. J. Devereaux, Jos Kleijnen, and David Moher. 2009. “The PRISMA statement for reporting systematic reviews and meta-analyses of studies that evaluate health care interventions: explanation and elaboration.” Plos medicine 6 (7): doi:10.1371/journal.pmed.1000100.
- *Liu, Y., Liu, H., and Hau, K.-T., 2016. Reading ability development from kindergarten to junior secondary: Latent transition analyses with growth mixture modeling. Frontiers in psychology, 7, 1659. doi:10.3389/fpsyg.2016.01659.
- *Lloyd, J.E., Li, L., and Hertzman, C., 2010. Early experiences matter: lasting effect of concentrated disadvantage on children's language and cognitive outcomes. Health & Place, 16 (2), 371–380. doi:10.1016/j.healthplace.2009.11.009.
- *Lochman, J.E., et al., 2012. Coping Power dissemination study: intervention and special education effects on academic outcomes. Behavioral disorders, 37 (3), 192–205. doi:10.1177/019874291203700306.
- *London, R.A., and Castrechini, S., 2011. A longitudinal examination of the link between youth physical fitness and academic achievement. Journal of school health, 81 (7), 400–408. doi:10.1111/j.1746-1561.2011.00608.x.
- *Lopes, V.P., et al., 2011. Motor coordination as predictor of physical activity in childhood. Scandinavian journal of medicine & science in sports, 21 (5), 663–669. doi:10.1111/j.1600-0838.2009.01027.x.
- Luo, W., and Kwok, O.-m., 2012. The consequences of ignoring individuals' mobility in multilevel growth models. Journal of educational and behavioral statistics, 37 (1), 31–56. doi:10.3102/1076998610394366.
- Mainhard, Tim, Sophie Oudman, Lisette Hornstra, Roel J. Bosker, and Thomas Goetz. 2018. “Student emotions in class: The relative importance of teachers and their interpersonal relations with students.” Learning and instruction 53: 109–119. doi:10.1016/j.learninstruc.2017.07.011.
- McCoach, D., and Betsy, K., 2010. Using time-varying covariates in multilevel growth models. Frontiers in psychology, doi:10.3389/fpsyg.2010.00017.
- *McCormick, M.P., et al., 2016. Do effects of social-emotional learning programs vary by level of parent participation? evidence from the randomized trial of INSIGHTS. Journal of research on educational effectiveness, 9 (3), 364–394. doi:10.1080/19345747.2015.1105892.
- *McDermott, P.A., Rikoon, S.H., and Fantuzzo, J.W., 2014. Tracing children’s approaches to learning through Head Start, kindergarten, and first grade: Different pathways to different outcomes. Journal of educational psychology, 106 (1), 200–213. doi:10.1037/a0033547.
- *McDermott, P.A., Rikoon, S.H., and Fantuzzo, J.W., 2016. Transition and protective agency of early childhood learning behaviors as portents of later school attendance and adjustment. Journal of school psychology, 54, 59–75. doi:10.1016/j.jsp.2015.10.003.
- McNeish, D.M., and Stapleton, L.M., 2016. The effect of small sample size on two-level model estimates: a review and illustration. Educational psychology review, 28 (2), 295–314. doi:10.1007/s10648-014-9287-x.
- Mehta, Paras. 2013. “N-Level structural equation modeling.” In Applied quantitative analysis in education and the social sciences. Eds. Petecher, Y., Schatschneider, C., & Compton, D. L. Routledge.
- Moerbeek, M., 2004. The consequence of ignoring a level of nesting in multilevel analysis. Multivariate behavioral research, 39 (1), 129–149. doi:10.1207/s15327906mbr3901_5.
- *Moller, S., et al., 2013. Collective pedagogical teacher culture and mathematics achievement: differences by race, ethnicity, and socioeconomic status. Sociology of education, 86 (2), 174–194. doi:10.1177/0038040712472911.
- *Morgan, P.L., et al., 2016. Science achievement gaps begin very early, persist, and are largely explained by modifiable factors. Educational researcher, 45 (1), 18–35. doi:10.3102/0013189X16633182.
- *Morgan, P.L., Farkas, G., and Wu, Q., 2011. Kindergarten children’s growth trajectories in reading and mathematics: who falls increasingly behind? Journal of learning disabilities, 44 (5), 472–488. doi:10.1177/0022219411414010.
- *Ogg, J., and Anthony, C.J., 2020. Process and context: Longitudinal effects of the interactions between parental involvement, parental warmth, and SES on academic achievement. Journal of school psychology, 78, 96–114. doi:10.1016/j.jsp.2019.11.004.
- *Ortega, L., Malmberg, L.-E., and Sammons, P., 2018. Teacher effects on Chilean children’s achievement growth: a cross-classified multiple membership accelerated growth curve model. Educational evaluation and policy analysis, 40 (3), 473–501.
- Palardy, G.J., 2010. The multilevel crossed random effects growth model for estimating teacher and school effects: issues and extensions. Educational and psychological measurement, 70 (3), 401–419. doi:10.1177/0013164409355693.
- *Park, S., and Holloway, S.D., 2017. The effects of school-based parental involvement on academic achievement at the child and elementary school level: a longitudinal study. The journal of educational research, 110 (1), 1–16. doi:10.1080/00220671.2015.1016600.
- *Pässler, K., and Hell, B., 2020. Stability and change in vocational interests from late childhood to early adolescence. Journal of vocational behavior, 121 (September), 103462. doi:10.1016/j.jvb.2020.103462.
- Petscher, Y., and Schatschneider, C., 2019. Using n -level structural equation models for causal modeling in fully nested, partially nested, and cross-classified randomized controlled trials. Educational and psychological measurement, 79 (6), 1075–1102. doi:10.1177/0013164419840071.
- PRISMA-P Group, et al., 2015. Preferred reporting items for systematic review and meta-analysis protocols (PRISMA-P) 2015 statement. Systematic reviews, 4 (1), 1.
- *Rambo-Hernandez, K.E., and McCoach, D.B., 2015. High-Achieving and average students’ Reading growth: contrasting school and summer trajectories. The journal of educational research, 108 (2), 112–129. doi:10.1080/00220671.2013.850398.
- *Rambo-Hernandez, K.E., Peters, S.J., and Plucker, J.A., 2019. Quantifying and exploring elementary school excellence gaps across schools and time. Journal of advanced academics, 30 (4), 383–415. doi:10.1177/1932202X19864116.
- Raudenbush, S.W., and Bryk, A.S., 2002. Hierarchical linear models: applications and data analysis methods. 2nd ed. Sage.
- *Ready, D.D., 2013. Associations between student achievement and student learning: implications for value-added school accountability models. Educational policy, 27 (1), 92–120. doi:10.1177/0895904811429289.
- *Rugutt, J.K., and Nur-Awaleh, M.A., 2011. Mathematics learning patterns across two groups of African American students: a multilevel approach. International journal of learning, 21.
- *Salvas, M.-C., et al., 2011. Interplay between friends' aggression and friendship quality in the development of child aggression during the early school years. Social development, 20 (4), 645–663. doi:10.1111/j.1467-9507.2010.00592.x.
- *Schulte, A.C., and Stevens, J.J., 2015. Once, sometimes, or always in special education: mathematics growth and achievement gaps. Exceptional children, 81 (3), 370–387. doi:10.1177/0014402914563695.
- *Smyth, E., 2020. Shaping educational expectations: the perspectives of 13-year-olds and their parents. Educational review, 72 (2), 173–195. doi:10.1080/00131911.2018.1492518.
- *Swanson, H.L., 2015. Growth in working memory and inhibition predicts literacy in English language learners: a cross-sectional and longitudinal study. Memory (Hove, England), 23 (5), 748–773. doi:10.1080/09658211.2014.927504.
- *Swanson, H.L., Orosco, M.J., and Kudo, M.F., 2017. Do specific classroom Reading activities predict English language learners’ later Reading achievement? Reading & writing quarterly, 33 (3), 199–210. doi:10.1080/10573569.2016.1145563.
- *Taylor, I.M., Spray, C.M., and Pearson, N., 2014. The influence of the physical education environment on children’s well-being and physical activity across the transition from primary to secondary school. Journal of sport and exercise psychology, 36 (6), 574–583. doi:10.1123/jsep.2014-0038.
- *Tong, F., et al., 2017. Investigating the impact of professional development on teachers’ instructional time and English learners’ language development: a multilevel cross-classified approach. International journal of bilingual education and bilingualism, 20 (3), 292–313. doi:10.1080/13670050.2015.1051509.
- Tranmer, M., Steel, D., and Browne, W.J., 2014. Multiple-Membership multiple-classification models for social network and group dependences. Journal of the royal statistical society series A: statistics in society, 177 (2), 439–455. doi:10.1111/rssa.12021.
- Van den Noortgate, W., Opdenakker, M.-C., and Onghena, P., 2005. The effects of ignoring a level in multilevel analysis. School effectiveness and school improvement, 16 (3), 281–303. doi:10.1080/09243450500114850.
- *Wei, X., Blackorby, J., and Schiller, E., 2011. Growth in Reading achievement of students with disabilities, ages 7 to 17. Exceptional children, 78 (1), 89–106. doi:10.1177/001440291107800106.
- *Williamson, G.L., Fitzgerald, J., and Stenner, A.J., 2014. Student Reading growth illuminates the common core text-complexity standard. The elementary school journal, 115 (2), 230–254. doi:10.1086/678295.
- *Williford, A., et al., 2016. The effect of bullying and victimization on cognitive empathy development during the transition to middle school. Child & youth care forum, 45, 525–541. doi:10.1007/s10566-015-9343-9.
- *Zarra-Nezhad, M., et al., 2019. Supportive parenting buffers the effects of low peer acceptance on children’s internalizing problem behaviors. Child & youth care forum, 48, 865–887. doi:10.1007/s10566-019-09510-y.