
 ?Mathematical formulae have been encoded as MathML and are displayed in this HTML version using MathJax in order to improve their display. Uncheck the box to turn MathJax off. This feature requires Javascript. Click on a formula to zoom.
ABSTRACT
A 4 degrees of freedom ship performance prediction model is used to compare wind-assisted ship propulsion technologies: the Flettner rotor, a wingsail and the DynaRig concept. An Aframax Oil Tanker on a route between Gabon and Canada is used in a case study to compare the three technologies using actual information for the voyage. The fuel savings for were calculated and they varied between 5.6% and 8.9%; the Flettner rotor showed the largest fuel savings. A parametric study of the Flettner rotor technology was carried out to research how its dimensions and operation conditions for two ship types on two voyages influence the fuel savings. The results show that fuel savings were achieved by several percentages. It is shown that it is necessary to select and operate the Flettner rotor according to its ship type, speed, voyage routes and corresponding weather conditions to achieve as large fuel savings as possible.
1. Introduction
1.1. Background and motivation
Targeting to achieve both 2°C and 1.5°C framing of climate change, a rapid and sustained emissions reductions across all industrial sectors is required, and corresponding carbon dioxide budgets have been stated (UNEP Citation2014). Meanwhile, there is a rapidly increasing global demand of shipping transport, around 4% per year since the 1990s (UNCTAD Citation2013). Currently, over 90% of the world's trade is carried by sea. According to the IMO greenhouse gas study in 2014 (IMO Citation2014), maritime carbon dioxide emissions are expected to increase by 50% to 250% between 2012 and 205, which indicates a big challenge to meet the carbon dioxide budgets for shipping sector.
Considering the rapid increase of carbon emissions from shipping activities, the first maritime energy efficiency regulations has entered into force the 1st January 2013 (IMO Citation2011). All the ships of 5000 gross tonnage and above are required to record and report their fuel oil consumption, which has been made mandatory in the amendment of MARPOL Annex VI and has come into force on 1st March 2018 (IMO Citation2016).
In order to increase energy efficiency and decrease the emissions from shipping activities, the utilisation of renewable energy by applying innovative technologies has proposed as a promising direction. Especially the wind energy has a big advantage in practical shipping activities as it is always available in open sea compared to the other renewable solutions (Talluri et al. Citation2016). Clauss et al. (Citation2007) concluded that sail technologies enable up to 15% fuel savings at a speed of 15 knots for some analysed ship types annually. Schlaak et al. (Citation2009) studied the potential fuel savings by using a kite for a multi-purpose freighter. The study presented potential fuel savings of 1% to 21% at the speed of 15 knots and 4% to 36% at the speed of 13 knots. Therefore, wind-assisted ship propulsion (WASP), as one of the few ship technologies potentially offering double-digit fuel and emissions savings, is believed to be an important renewable energy source for the future shipping industry.
There are many WASP technologies available in the market. However, the ship owners and operators are interested to know the actual fuel savings for specific ship and specific voyage routes by installing specific wind-assisted ship propulsion technologies and how to improve their performance in operation. This study presents a performance comparison of three WASP technologies which have been researched and proposed as promising candidates (Nelissen et al. Citation2016): the Flettner rotor, the DynaRig and a wingsail. Combined with the recorded actual weather conditions, specific ship voyage information and noon reports, the total heavy fuel oil consumptions with and without these sail technologies have been simulated and compared using a ship performance simulation model proposed by Tillig et al. (Citation2017) and further developed in Tillig and Ringsberg (Citation2019). In order to further investigate the Flettner rotor size effect, the Flettner rotor rotating speed effect, installed location (on-board) effect on fuel savings, dimensions, etc., a parametric study is presented for two ship types on two ship routes.
2. Description of the Flettner rotor, DynaRig and wingsail technologies
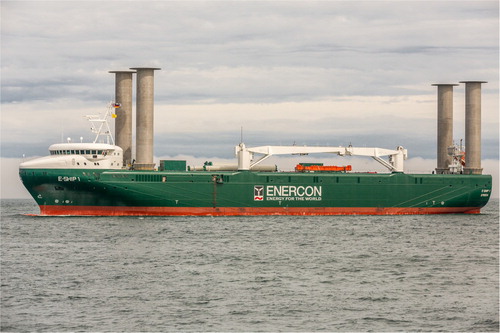
The Flettner rotor is an electrical powered rotating cylindrical structure, with one end vertically installed on the deck. By utilising the Magnus effect, the forward thrust is generated while the cylinder is spinning across the wind. Mittal and Kumar (Citation2003), Craft et al. (Citation2012) and Karabelas et al. (Citation2012) studied the aerodynamic performance of the Flettner rotor using computational fluid dynamics (CFD) simulations. Based on the CFD simulation results, Traut et al. (Citation2014) proposed a performance model to simulate the power savings contributed by Flettner rotors. In their case study, a 5500 DWT cargo ship with three Flettner rotors (27 m in height and 4 m in diameter) installed onboard could save up to 50% of the power required by the main engine. In another study, the classification society Lloyd's Register followed up the performance and handling test of the Integrated Greenwave MK1 Rotor assembly on a Panamax Bulk Carrier (Hirdaris and Cheng Citation2012). For a 1/85th scale model for a 182 m waterline bulk carrier fitted with the Greenwave Flettner rotor, the performance and handling tests indicated that the Flettner rotor was capable to provide 50% of the required thrust in light winds and 100% of the required thrust in moderate winds. In addition, the 10500 DWT Cargo Ship Enercon E-Ship 1, presented in , came into commercial operation in 2010. Four 25 m high, 4 m in diameter rotors are installed onboard. According to the recorded fuel consumption with motor powered only and with sail-rotor operation, up to 22.9% fuel consumption have been saved on the voyage between Emden and Portugal (Schmidt Citation2013). In 2015, two Norsepower rotors 18 m in height and 3 m in diameter were retrofitted on the 9700 DWT Ro-Ro Carrier M/V Estraden. It was verified by the company Norsepower and the ship owner that 5% fuel savings on yearly basis have been saved (www.norsepower.com).
Figure 1. Photograph of Enercon E-Ship 1 (Schmidt Citation2013). (This figure is available in colour online.)
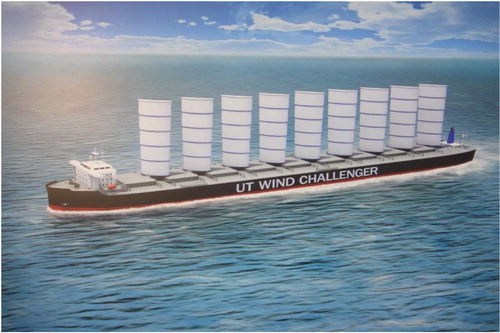
The profile of a wingsail, especially the thickness of the aerofoil shape, is able to generate a strong lift effect and provide a strong propulsive force while decreasing the induced drag that slows down the speed of a ship. Its operating principle is to maximise the aerodynamic lift force by rotating to the optimum angle of wind attack, which is quite similar to that of an aerofoil. As the mast can rotate 360 degrees, the wingsail works in different wind angles, even upwind and be able to manoeuvre gently and safely. The WindShip project (Rosander and Bloch Citation2000) proposed a new rigid wingsail concept. A 50000 DWT Product Carrier was selected as the case ship, and a velocity prediction programme (VPP) was developed to predict the speed, the drift and rudder angles for given wind directions, wind speeds and propeller loadings. Within some strong windy areas, compared to an equal-sized conventional Product Carrier, around 10% fuel savings was achieved by using the wingsail technology. However, it has also been noticed that the fuel savings could be marginal at high average voyage speed within less windy area. In the Wind Challenger project (Ouchi et al. Citation2013), another concept of wingsail was studied for the 180000 DWT Bulk Carrier UT Wind Challenger, see . An energy prediction programme (EPP) was developed to predict the operational performance. On the voyage between Yokohama (Japan) and Seattle (US) up to 22% fuel savings were calculated under constant speed. Viola et al. (Citation2015) proposed a wingsail concept for the KVLCCM hull. Based on CFD simulations of aerodynamic forces and moments, under certain ship and wind speeds, approximately 10% thrust requirement from main engine was reduced by using the proposed wingsails.
Figure 2. Illustration of the UT Wind Challenger concept (Ouchi et al. Citation2013). (This figure is available in colour online.)
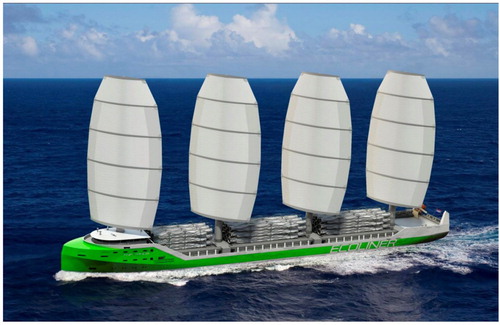
Many innovative features have been deployed with modern soft sail, such as the Pinta-Rig, DynaRig, Delta wingsail and Fastrigs. The self-sustained and easy-to-use DynaRig has especially become a popular soft sail technology. As the mast is lightly guyed and able to spin on itself, the manoeuvres of DynaRig are quite safe and secured. Compared to wingsail, its lift coefficients are normally lower, but greater lift forces are commonly generated by utilising the larger surface areas; DynaRig is less efficient in upwind. Surplus (Citation2011) proposed a concept of zero carbon emissions ship for a 3000 DWT coastal sailing vessel. By utilising the DynaRig technology, approximately 60% of the total required thrust comes from the DynaRig. Dykstra Naval Architect (Citation2019) has proposed a sailing 8000 DWT Multi-purpose Cargo Vessel called Ecoliner, see . Based on CFD simulations and weather routing programmes, the performance of the Ecoliner has been compared with that of a comparable motor ship under given estimated time of arrival (ETA). At the design speed of 12 knots, up to 35% of fuel savings and 22% less operational costs can be achieved for the Ecoliner. Considering all depreciation and other capital costs after 10 years of operation, the Ecoliner has a 3% benefit compared to a similar conventional vessel (Van Hasselt and Feenstra Citation2015).
Figure 3. Illustration of the Ecoliner concept (Dykstra Naval Architect Citation2019). (This figure is available in colour online.)
3. Wind-assisted ship performance simulation model
Based on a generic energy systems model proposed by Tillig et al. (Citation2017) and Tillig and Ringsberg (Citation2019), the performance prediction model for ships at sea (ShipJOURNEY) is further developed by integrating a sail module in this study, ShipSAIL. In an overview, ship profiles, voyage routes, operational conditions and sail technologies are the essential inputs to run ShipJOURNEY, and the voyage time and main engine fuel consumption are the major outputs. A schematic flowchart of ShipJOURNEY is presented in .
Figure 4. Schematic flowchart of ShipJOURNEY.
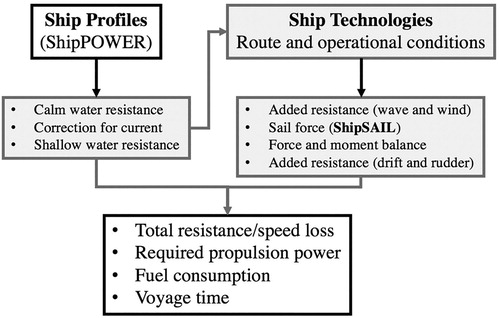
The ShipJOURNEY is a 4 degrees of freedom balance model where the surge, sway, roll and yaw are balanced for the ship (Tillig and Ringsberg Citation2019). The first function component of ShipJOURNEY is ShipPOWER, which can predict the calm water resistance, shallow water resistance, propulsive factors, propeller design, propeller performance curves, engine data based on basic ship information inputs, such as ship type, design speed, basic dimensions, propeller RPM and number of blades, engine RPM etc.; see Tillig et al. (Citation2017) and Tillig and Ringsberg (Citation2019) for details. The second function component of ShipJOURNEY is to simulate the route, the weather conditions in the waypoints, the operational conditions (e.g. constant target speed; fixed journey time; constant power and constant RPM). The third function component (module) of ShipJOURNEY is to simulate sail technologies, named as ShipSAIL in this study.
In ShipSAIL, the thrust and heel coefficients under varying wind speeds and angles of specific Flettner rotor, wingsail, and DynaRig have been converted from the corresponding lift coefficient (CL), drag coefficient (CD), thrust force (T), angle (α) between lift force (L) and drag force (D), as presented in . The equations to calculate CD and CL and are presented in Equations (1) and (2).(1)
(1)
(2)
(2)
Figure 5. Schematic of forces and apparent wind velocity.
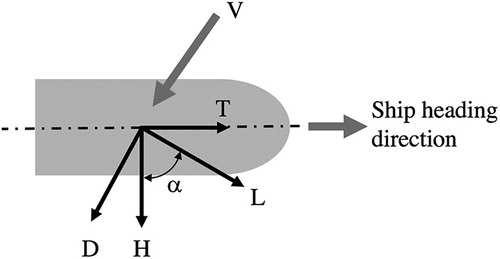
The polar diagrams for the three WASP technologies are presented in Section 4. Then the thrust force (T) and side force from heel (H) are calculated based on the thrust coefficient (CT), heel coefficient (CH), apparent wind velocity (V), air density (ρ) and the sail area (S) according to Equations (3) and (4).(3)
(3)
(4)
(4)
In order to balance the force and moment generated from the sails, the required rudder angle and corresponding added resistance are also included in the simulation model. The drift added resistance caused by heel force is also accounted for. Taking the commercial ship voyage records (noon reports: route and operational conditions) as inputs, the fuel consumptions with the three sail technologies and without sails are compared in case studies presented in Sections 4 and 5.
4. Case study ships and wind-assisted ship propulsion technologies
Section 4.1 presents the case study ships used in the comparison of the three wind-assisted ship propulsion technologies and in the parametric study of the Flettner rotor. In Section 4.2, the dimensions and characteristics of the three WASP technologies are presented. The results from the comparisons and the parametric study are presented in Section 5.
4.1. Case study ships
An Aframax Oil Tanker was chosen as the case study vessel in the comparison of the three wind-assisted propulsion technologies and the parametric study of the Flettner rotor. The profile of this oil tanker as defined in the ship performance simulation model was 250 m in length, 40 m in beam and 14 m in design draft. A Handysize Bulk Carrier was also included as a case study vessel in the parametric study of the Flettner rotor. The profile of this bulk carrier was 180 m in length, 28 m in beam and 10 m in design draft. Both of these two ships operate on Atlantic Ocean routes, but due to the confidentiality agreements with the ship owners further details of the ships are not able to be provided. The data needed to model a ship and a voyage to make a ship performance simulation has been presented in detail in Tillig et al. (Citation2017) and in Tillig and Ringsberg (Citation2019).
4.2. Dimensions and characteristics of the three WASP technologies
The dimensions and characteristics of the three WASP technologies were selected based on findings in the literature and contacts made with the suppliers. They were also chosen to be appropriate for the case study vessels in the current investigation. The profile of the reference DynaRig was set to 1000 m2 based on data in Van Hasselt and Feenstra (Citation2015), and previous studies on a 884 m2 DynaRig in SSPA (Citation2013) and a 1200 m2 in Van Hasselt and Feenstra (Citation2015). In the proposed ShipSAIL model, the thrust and heel coefficients of this DynaRig were calculated and they are presented in and . The DynaRig was positioned midships of the ship.
Figure 6. Polar diagram of the thrust coefficient (CT) vs. the apparent wind direction for the 1000 m2 DynaRig. (This figure is available in colour online.)
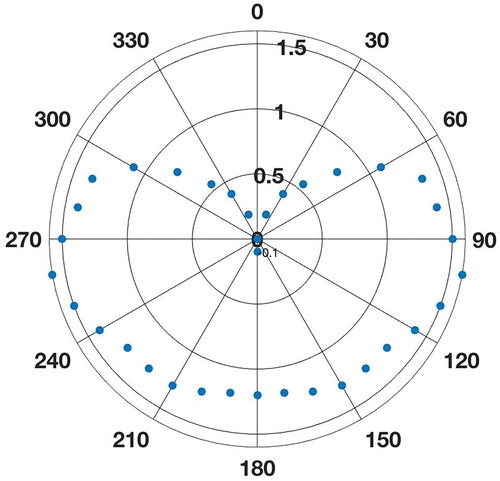
Figure 7. Heel coefficient (CH) vs. the apparent wind direction for the 1000 m2 DynaRig. (This figure is available in colour online.)
A wingsail with a total sail area of 1000 m2 was chosen as the reference wingsail, and its area was set to match the area of the DynaRig. It has a height of 50 m and a chord length of 20 m; see Nelissen et al. (Citation2016) for details. In the proposed ShipSAIL model, the thrust and heel coefficients of this wingsail were calculated and they are presented in and . The wingsail was positioned midships of the ship.
Figure 8. Polar diagram of the thrust coefficient (CT) vs. the apparent wind direction for the 1000 m2 wingsail. (This figure is available in colour online.)
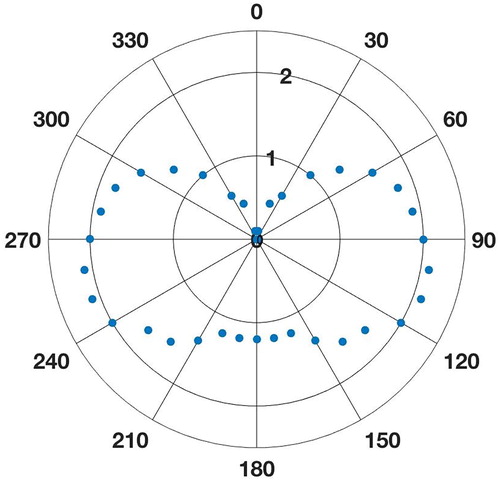
Figure 9. Heel coefficient (CH) vs. the apparent wind direction for the 1000 m2 wingsail. (This figure is available in colour online.)
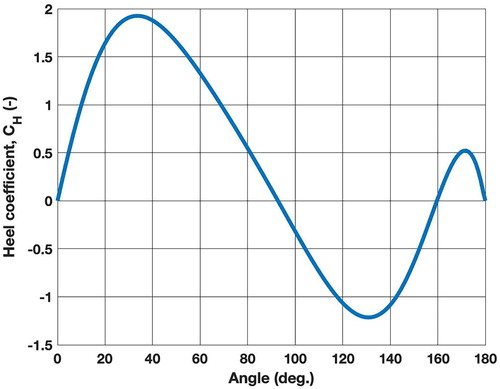
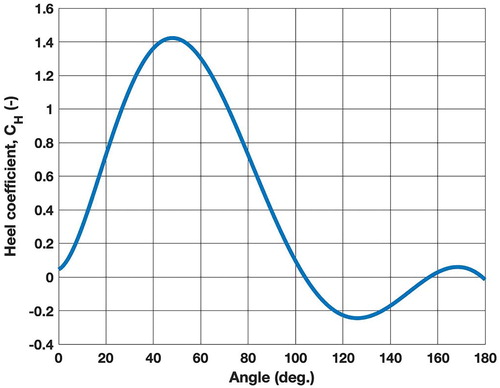
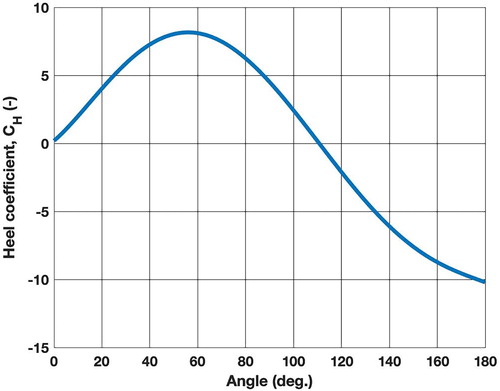
The Flettner rotor utilises the Magnus effect (see Section 2) and is very different from the DynaRig and wingsail concepts. One of its advantages is the small space this technology requires on deck in comparison with the other two sail technologies; thus, it is difficult to compare the sail area of the Flettner rotor to the sail areas of the DynaRig and wingsail technologies. In this investigation, for the current case study ships, the dimensions of the Flettner rotor were designed to be 18 m in height, 3 m in diameter of its cylinder, and 6 m in diameter of the disc installed in the top of the rotor. Thus, the total surface area of the rotor is 509 m2 and the projected area is 108 m2. The spinning speed of the rotor was set to maximum of 600 RPM. Note that the RPM was allowed to be lower than this value for low wind speeds to ensure that the operation of the Flettner rotor was as optimal as possible. The simulation model of the Flettner rotor, which among others includes its dimensions and RPM in the calculation of the lift and drag forces, was taken from Allenström et al. (Citation2012), who carried out experiments, different numerical simulations and CFD analyses in their assessment of Flettner rotors’ performance. The required power to rotating the rotor was also included in the simulation model. In the proposed ShipSAIL model, the thrust and heel coefficients of this Flettner rotor were calculated and they are presented in and for 600 RPM. The rotor was positioned midships of the ship.
Figure 10. Polar diagram for the thrust coefficient (CT) vs. the apparent wind direction for the case study Flettner rotor. (This figure is available in colour online.)
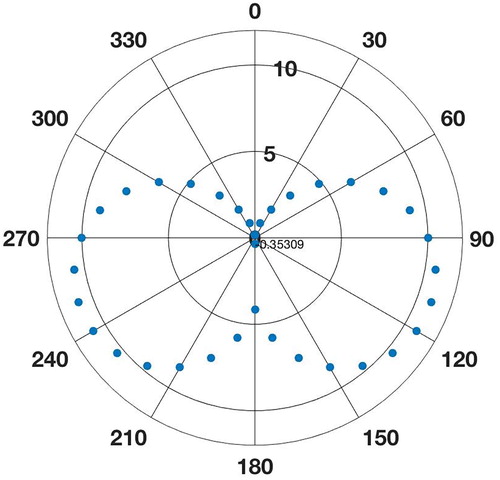
Figure 11. Heel coefficient (CH) vs. the apparent wind direction for the case study Flettner Rotor. (This figure is available in colour online.)
5. Results
This section presents the results from the comparison of the three WASP technologies on two different routes (Sections 5.1 and 5.2) using the Aframax Oil Tanker case study vessel. These routes were the real routes for this vessel when operating without a sail technology installed onboard. The recorded actual weather conditions were used in the simulations and no difference was made between simulations without and with a sail technology onboard. However, smart routing for more favourable wind conditions when a sail technology is installed onboard is likely to increase the fuel savings even more than what is presented in the results of this study; see Bentin M et al. (Citation2016) for such a study. Also, simulations with different weather and seasons using statistical data is not included in this study – it is presented in the study by Tillig et al. (Citation2019). In Section 5.3, the results from the parametric study of the Flettner rotor are presented for both the Aframax Oil Tanker and the Handysize Bulk Carrier case study vessels on the same two routes.
5.1. Case study 1 – Cape Lopez (Gabon) to Point Tupper (Canada)
In the first case study, the route between Cape Lopez (Gabon) and Point Tupper (Canada) was selected, see . Within the 4908 nautical miles voyage, the achieved speed (without wind-assisted propulsion) of the Aframax Oil Tanker was 15.7 knots. Under the recorded weather conditions used in this study, the power contributed by utilising the wingsail, DynaRig and Flettner rotor technologies were simulated in ShipSAIL. Then based on the ShipJOURNEY, the Total Fuel Consumption (TFC) with wind-assisted propulsion technologies was simulated and compared with that without a sail, as shown in . As presented in , the voyage time was 313 h without sail and the total heavy fuel oil consumption was 966.7 t. The simulations with the three sail technologies were set to have the same ETA of 313 h. The Flettner rotor showed the largest fuel savings, followed by the wingsail and the DynaRig. Note that all three sail technologies show fuel savings, which would have been even higher if the ETA would have been longer.
Figure 12. Route between Cape Lopez (Gabon) and Point Tupper (Canada). (This figure is available in colour online.)
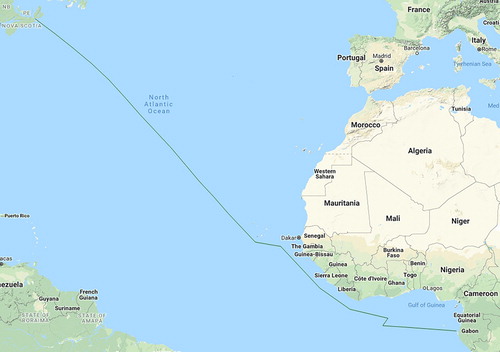
Table 1. Fuel consumption comparison for the route between Cape Lopez (Gabon) and Point Tupper (Canada).
5.2. Case study 2 – Angra dos Reis (Brazil) to Rotterdam (the Netherlands)
In the second case study, the route between Angra dos Reis (Brazil) and Rotterdam (the Netherlands) was selected for study, see . Within the 5677 nautical miles voyage, the achieved speed of the Aframax Oil Tanker without sail was 15.5 knots. Under the recorded weather conditions used in this study, the power contributed by utilising the wingsail, DynaRig and Flettner rotor technologies were simulated in ShipSAIL. Then based on the ShipJOURNEY, the TFC with wind-assisted propulsion technologies was simulated and compared with that without a sail, as shown in . As presented in , the voyage time was 367 h without sail and the total heavy fuel oil consumption was 1162.1 t. The simulations with the three sail technologies were set to have the same ETA of 367 h. Also here, the Flettner rotor showed the largest fuel savings, followed by the wingsail and the DynaRig.
Figure 13. Route between Angra dos Reis (Brazil) and Rotterdam (the Netherlands). (This figure is available in colour online.)
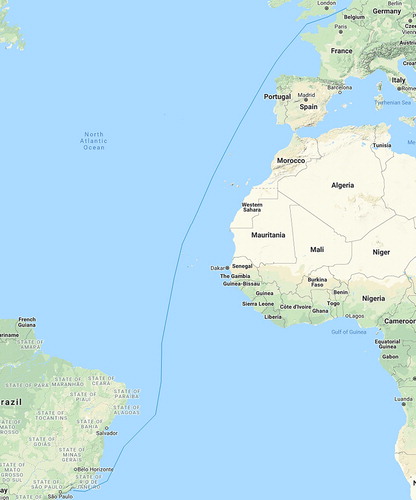
Table 2. Fuel consumption comparison for the route between Angra dos Reis (Brazil) and Rotterdam (the Netherlands).
Based on the results in Case study 1 and Case study 2, the Flettner rotor and the wingsail contribute to significant fuel savings for the Aframax Oil Tanker. For the 14 days voyage in the first case study, there are 85.2 and 86.1 t fuel savings achieved by using the wingsail or the Flettner rotor, respectively. For the 16 days voyage in the second case study, there are 70.6 and 107.9 t fuel savings achieved by using the wingsail or the Flettner rotor, respectively.
It should be emphasised that the simulations were carried out in both studies for real operation conditions using the recorded environment data for the wind speed and direction, wave height and direction, and ocean currents. All three wind-assisted sail technologies show the potential to considerable fuel savings, especially with the Flettner rotor and the wingsail concepts. As an example, the Aframax Oil Tanker is annually in operation for 260 days on average. Thus, by utilising the wingsail or the Flettner rotor technology, there is a potential to save 1144 and 1755 t of heavy fuel oil, respectively. It should also be noted that the three sail technologies were put midships in the simulation model, which is not the optimal location from a sailing dynamics perspective. A better positioning of each of the three sail technologies would have resulted in even higher fuel savings; see Section 5.3 for an example with the Flettner rotor.
The Flettner rotor contributed the most to fuel savings with the least sail area. Currently, there is a lot of research work and application carried out on Flettner rotor concepts; see e.g. www.norsepower.com. However, there is also potential to further reduce the fuel consumption by selecting and operating a sail technology that match for specific commercial ship. Therefore, a parametric study was carried out to investigate how to improve the performance of the Flettner rotor by varying its profiles and operations.
5.3. Parametric study of the Flettner rotor technology
In order to investigate the fuel savings decided by the profiles and operations of the Flettner rotor, a parametric study focusing on the fuel savings linked to different rotor sizes, RPM of the rotor, installed position of the rotor, and ship speed effect have been carried out. The parametric study was carried out on the two case study ships – the Aframax Oil Tanker and the Handysize Bulk Carrier – for the two voyage routes presented in Sections 5.1 and 5.2 (i.e. Route 1 and Route 2) based on the available ship noon reports. The parametric study was divided into 9 cases:
Case A: Flettner rotor in reference operating condition.
Case B: change of the installed location of the rotor compared to A.
Case C: change of the maximum rotating RPM of the rotor compared to A.
Case D: increase of the average voyage speed by 0.5 knot compared to A.
Case DR: without Flettner rotor, increase of the average voyage speed by 0.5 knot compared to G.
Case E: decrease of the average voyage speed by 1.5 knots compared to A.
Case ER: without Flettner rotor, decrease of the average voyage speed by 1.5 knots compared to G.
Case F: increase of the diameter and height of the rotor (while keeping the aspect ratio as 6) compared to A.
Case (G): reference case, without Flettner rotor.
5.3.1. The Aframax Oil Tanker
For the Aframax Oil Tanker on Route 1 and Route 2, the results of the parametric study are presented in and , respectively. The fuel saving percentage compared to Case G (without Flettner rotor) is presented in .
Figure 14. Fuel saving percentage compared to Case G on Route 1 and Route 2 for the Aframax Oil Tanker.
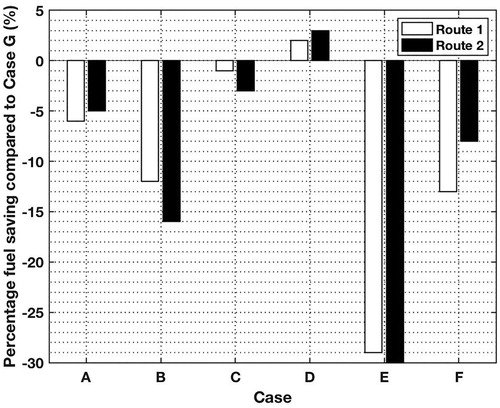
Table 3. Parametric study of the Flettner rotor for the Aframax Oil Tanker on Route 1.
Table 4. Parametric study of the Flettner rotor for the Aframax Oil Tanker on Route 2.
According to the results presented in , for Route 1 and Route 2 respectively, 6% and 5% fuel savings can be achieved of utilising the Flettner rotor by comparing Case A and Case G. In a comparison of Case A and Case B, it can be noticed that the fuel savings have been dramatically improved by installing the rotor in the fore part of the ship instead of in the mid part. By comparing Case A and Case C, the fuel savings with the rotor have dramatically decreased due to low rotating speed. By comparing Case A, Case D and Case E, the ship speed has a stronger effect on fuel savings compared to the rotor itself. By comparing Case A and Case F, the ‘larger’ rotor has obviously improved the fuel savings for the Aframax Oil Tanker.
The parametric study of the Flettner rotor for the Aframax Oil Tanker clearly indicates the sensitivity of different parameters of the Flettner rotor to fuel savings. The fuel savings contributed by the rotor increased by installing the rotor in the fore part of ship instead of mid part, keeping the high rotating speed of the rotor and enlarging the size of the rotor while keeping the aspect ratio as 6. The total fuel savings are obviously improved by slowing down the ship speed as the fuel consumption has a stronger sensitivity to ship speed other than the rotor itself. Even the average speed is only increased by 0.5 knot, the extra required fuel will cover the fuel savings achieved by the Flettner rotor.
5.3.2. The Handysize Bulk Carrier
For the Handysize Bulk Carrier on Route 1 and Route 2, the results of the parametric study for the Flettner rotor are presented in and . The fuel saving percentage compared to Case G (without Flettner rotor) is presented in .
Figure 15. Fuel saving percentage compared to Case G on Route 1 and Route 2 for the Handysize Bulk Carrier.
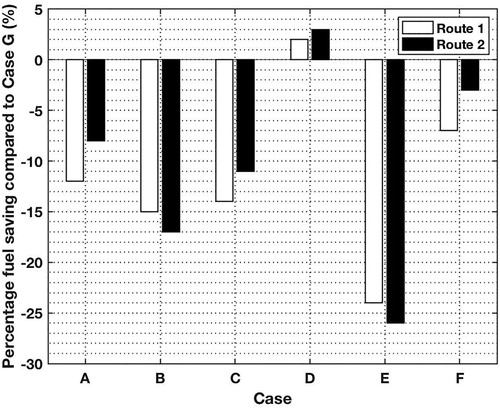
Table 5. Parametric study of the Flettner rotor for the Handysize Bulk Carrier on Route 1.
Table 6. Parametric study of the Flettner rotor for the Handysize Bulk Carrier 1 on Route 2.
According to the results presented in , on Route 1 and Route 2, respectively, there are 12% and 8% fuel savings of using the Flettner rotor by comparing Case A and Case G for the Handysize Bulk Carrier. Compared to that of the Aframax Oil Tanker, the Flettner rotor has a better performance in fuel savings for the smaller Handysize Bulk Carrier. A comparison of Case A and Case B shows that there are 3% and 9% fuel savings by installing the rotor in the fore part of the ship instead of in the mid part. By comparing Case A and Case C, the fuel savings from the rotor increase by 2% and 3% further by keeping a low rotating speed. The lower rotating speed contributes to a better performance for the Handysize Bulk Carrier in this case, which indicates that the fuel savings by using the Flettner rotor is not maximised by increasing the rotating speed, the power to spinning the rotor also matters.
By comparing Case A, Case D and Case E, the ship speed determines the fuel savings over the effect of the rotor, which are also agrees with the parametric study for the Aframax Oil Tanker. By comparing Case A and Case F, the larger rotor did not improve the fuel savings for the Handysize Bulk Carrier on the studied routes, which is not in agreement with the results from the Aframax Oil Tanker. The results indicate that the fuel savings by using the Flettner rotor is not maximised by enlarging the rotor, the extra added resistance caused by the ‘larger’ rotor also needs to be considered. Therefore, it is necessary to design the profiles and operations of Flettner rotors for specific commercial ships.
6. Conclusions
In this study, the fuel saving performance of three wind-assisted ship propulsion technologies – the Flettner rotor, the DynaRig and a wingsail – for an Aframax Oil Tanker was simulated and compared on two actual voyages on two different routes. The results show that all three sail technologies contribute to fuel savings between 5.6% and 8.9%. The Flettner rotor contributed the most to fuel savings with the least sail area on the studied routes.
A parametric study of the Flettner rotor sail technology was presented to analyse the sensitivity in Flettner rotor dimensions, operations, and positioning of the rotor. The study was carried out on two ships on two routes. The results show that the Flettner rotor has a better performance for the smaller Handysize Bulk Carrier in comparison with the Aframax Oil Tanker, especially when the rotor is installed in the fore part of these two ships. Ship speed has a stronger effect on fuel savings compared to that of the rotor. However, the higher spinning speed and bigger sizes (keeping the same aspect ratio) of the rotor is not always positive to fuel savings. Therefore, it is necessary to select and operate the Flettner rotor according to its ship type, speed, voyage routes and corresponding weather conditions.
The study shows that wind-assisted ship propulsion technologies can reduce the fuel consumption of commercial ships with several percentages. The amount of fuel savings depends on large number of factors. However, comparative studies such as the current investigation, using a ship performance simulation model, are important in the decision-making which technology to choose and test in full-scale for a specific ship type and route.
Acknowledegments
The authors are grateful to PhD student Fabian Tillig on Chalmers University of Technology, Department of Mechanics and Maritime Studies, for sharing the ShipCLEAN code that enabled the ship performance simulations presented in the study.
Disclosure statement
No potential conflict of interest was reported by the authors.
ORCID
Jonas W. Ringsberg http://orcid.org/0000-0001-6950-1864
Additional information
Funding
References
- Allenström B, Li DQ, Ran H. 2012. EffShip WP6 – system impact when using wind, wave and solar energy. Report No. RE40095426-01-00-A. SSPA Sweden AB, Gothenburg, Sweden.
- Bentin M Z, Schlaak M D, Freye D, Elsner R, Kotzur S. 2016. A new routing optimization tool-influence of wind and waves on fuel consumption of ships with and without wind assisted ship propulsion systems. Transp Res Procedia. 14(1):153–162. doi: 10.1016/j.trpro.2016.05.051
- Clauss GF, Siekmann H, Tampier BG. 2007. Simulation of the operation of wind-assisted cargo ships. Hauptversammlung der Schiffbautechnischen Gesellschaft, 21–23 November 2007, Berlin, Germany. p. 1–12.
- Craft TJ, Iacovides H, Johnson N, Launder BE. 2012. Back to the future: Flettner-Thom rotors for maritime propulsion? In Proceedings of the 7th International Symposium on Turbulence, Heat and Mass Transfer (THMT12); Sep 24–27; Palermo, Italy. doi:10.1615/ICHMT.2012.ProcSevIntSympTurbHeatTransfPal.1150.
- Dykstra Naval Architects. 2019. WASP (Ecoliner). Amsterdam (Netherlands): Dykstra Naval Architects; [accessed 2019 Feb 1]. http:// http://www.dykstra-na.nl/designs/wasp-ecoliner.
- Hirdaris SE, Cheng YF. 2012. The role of technology in green ship design. In Proceedings of the 11th International Marine Design Conference (IMDC 2012); Jun 11–14; Glasgow (UK). doi:10.13140/RG.2.1.4242.0564.
- International Maritime Organization (IMO). 2011. Amendments to the Annex of the protocol of 1997 to amend the International Convention for the Prevention of Pollution from Ships 1972 as modified in the protocol of 1978 relating thereto (Inclusion of regulations on energy efficiency for ships in MARPOL Annex VI). MEPC 62/24/Add.1, Annex 14; [accessed 2019 Feb 1]. http://www.imo.org.
- International Maritime Organization (IMO). 2014. Third IMO GHG Study 2014; [accessed 2019 Feb 1]. http://www.imo.org.
- International Maritime Organization (IMO). 2016. Marine Environment Protection Committee (MEPC), 70th session; October 24–28; [accessed 2019 Feb 1]; http://www.imo.org.
- Karabelas SJ, Koumroglou BC, Argyropoulos CD, Markatos NC. 2012. High Reynolds number turbulent flow past a rotating cylinder. Appl Math Model. 36(1):379–398. doi:10.1016/j.apm.2011.07.032.
- Mittal S, Kumar B. 2003. Flow past a rotating cylinder. J Fluid Mech. 476(476):303–334. doi:10.1017/S0022112002002938 doi: 10.1017/S0022112002002938
- Nelissen D, Traut M, Köhler J, Mao W, Faber J, Ahdour S. 2016. Study on the analysis of market potentials and market barriers for wind propulsion technologies for ships. Publication code 16.7G92.114; CE Delft (Netherlands); [accessed 2019 Feb 1]. http://www.cedelft.eu.
- Ouchi K, Uzawak K, Kanai A, Katori M. 2013. Wind challenger the next generation hybrid sailing vessel. In Proceedings of the Third International Symposium on Marine Propulsors (SMP’13); May 5–8; Launceston (Tasmania, Australia). p. 562–567.
- Rosander M, Bloch O. 2000. Modern windships. Technical Report, Pelmatic Knud E. Hansen; [accessed 2019 Feb 1]. https://www2.mst.dk/udgiv/publications/2000/87-7944-019-3/pdf/87-7944-020-7.pdf.
- Schlaak M, Kreutzer R, Elsner R. 2009. Simulating possible savings of the Skysails-system on international merchant ship fleets. Int J Marit Eng. 151(A4):25. doi:10.3940/rina.ijme.2009.a4.161.
- Schmidt A. 2013. Enercon E-ship 1: a wind-hybrid commercial cargo ship. In Proceedings of the 4th Conference on Ship Efficiency; Sep 23–24; Hamburg (Germany).
- SSPA. 2013. EffShip WP6: system impact when using wind, wave and solar energy; [accessed 2019 Feb 1]. http://www.effship.com.
- Surplus DC. 2011. B9 ships: sail and virtual bio-methane powered coastal vessels. In Proceedings of the International Conference on Technologies, Operations, Logistics and Modelling for Low Carbon Shipping (LCS 2011); Jun 22–24; Glasgow (Scotland, UK).
- Talluri L, Nalianda DK, Kyprianidis KG, Nikolaidis P, Pilidis T. 2016. Techno economic and environmental assessment of wind assisted marine propulsion systems. Ocean Eng. 121(1):301–311. doi:0.1016/j.oceaneng.2016.05.047 doi: 10.1016/j.oceaneng.2016.05.047
- Tillig F, Ringsberg JW. 2019. A 4 DOF simulation model developed for fuel consumption prediction of ships at sea. Ships Offsh Struct. (Suppl 1). doi:10.1080/17445302.2018.1559912.
- Tillig F, Ringsberg JW, Mao W, Ramne B. 2017. A generic energy systems model for efficient ship design and operation. IMechE, Part M. J Eng Marit Environ. 231(2):649–666. doi:10.1177/1475090216680672.
- Tillig F, Ringsberg JW, Psaraftis HN, Zis T. 2019. ShipCLEAN – an integrated model for transport efficiency, economics and CO2 emissions in shipping. In Proceedings of the 2nd International Conference on Modelling and Optimization of Ship Energy Systems (MOSES 2019); May 8–10; Glasgow, Scotland (UK).
- Traut M, Gilbert P, Walsh C, Bows A, Filippone A, Stansby P, Wood R. 2014. Propulsive power contribution of a kite and a Flettner rotor on selected shipping routes. Appl Energy. 113(1):362–372. doi:10.1016/j.apenergy.2013.07.026.
- UNCTAD. 2013. Trade and Development Report 2013. United Nations Conference on Trade and Development, Review of Maritime Transport, United Nations: New York, 2014.
- UNEP. 2014. The emissions gap report 2014. Nairobi (Kenya): United Nations Environment Programme (UNEP).
- Van Hasselt R, Feenstra B. 2015. Sail into a sustainable future – factsheets hybrid shipping; [accessed 2019 Feb 1]; http://www.nsrsail.eu/wp-content/uploads/2015/06/Factsheet-Brochure_SAIL_2015.pdf.
- Viola IM, Sacher M, Xu J, Wang F. 2015. A numerical method for the design of ships with wind-assisted propulsion. Ocean Eng. 105(1):33–42. doi:10.1016/j.oceaneng.2015.06.009.