
 ?Mathematical formulae have been encoded as MathML and are displayed in this HTML version using MathJax in order to improve their display. Uncheck the box to turn MathJax off. This feature requires Javascript. Click on a formula to zoom.
ABSTRACT
This research fills the gap in understanding fluid–structure interaction (FSI) from wave diffraction forces on CALM buoys and cylindrical structures, based on the hydrodynamics with connections. Recently, there is an increased application of (un)loading marine hoses for Catenary Anchor Leg Moorings (CALM) buoy systems in the offshore industry due to the need for more flexible marine structures that are cost-saving, easier to install, and service. However, different operational issues challenge these hoses, like during hose disconnection. Also, the fluid behaviour was investigated based on the analytical and numerical models. The numerical modelling involves the boundary element method (BEM) and Orcaflex line theory. Hydrodynamic analysis is conducted on the disconnection-induced load response of marine bonded hoses during normal operation and accidental operation under irregular waves. A comparative study on hose performance during normal operation and accidental operation is also presented. Results of statistical analysis on CALM buoy system shows good motion characteristics.
Highlights
Analytical solution on wave diffraction forces on CALM buoy systems.
Understanding the fluid–structure interaction from wave diffraction forces.
Wave load and flow angle analysis as hydrodynamic loads on hose profiles under irregular waves.
Novelty in hydrodynamics on Lazy-S and Chinese-lantern configurations under normal and accidental operations.
Wave diffraction analysis, and validation using statistical analysis in ocean environment.
1. Introduction
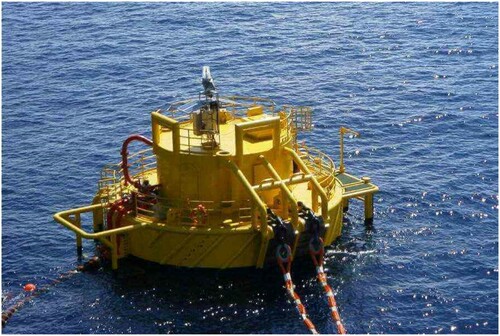
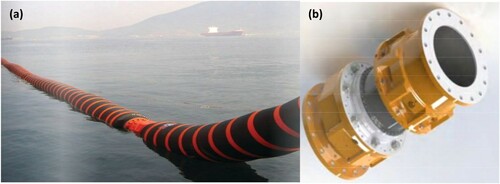
In recent times, there has been an increasing trend in the application of marine bonded hoses in the ocean engineering and marine industry. This has resulted from the need for more flexible marine structures, easier to install, easier to service, and more cost-effective structures. Oil prospecting companies lost revenue due to the recent crash in oil price in 2016, which was similar to the one that occurred during the Gulf war in 1991 and following the recent COVID-19 pandemic in 2020. As such, the oil/offshore operators need to adapt more exploration activities with less cost. This adaptation subsequently influenced the increase in the application of these marine bonded hoses. These marine hoses have a short service life of about 25 years, although they are pretty reliable and, therefore, highly utilized. Some studies on the stiffness behaviour of hoses and CALM buoy motion are presented in the literature (Amaechi, Wang, Hou, et al. Citation2019; Amaechi, Ye, Hou, et al. Citation2019; Amaechi Citation2021a, Citation2021b, Citation2021c, Citation2021d; Amaechi, Wang, et al. Citation2021a, Citation2021b). Also, buoy attachments can induce load response, such as the marine bonded hoses and mooring lines. These marine bonded hoses are designed for high-pressure ratings of 9 and 21 bar capacities. They have applications for loading and offloading purposes (Amaechi Citation2021e; Amaechi, Chesterton, Butler, et al. Citation2021a, Citation2021b; Amaechi, Wang, et al. Citation2021c). The material development of marine tubular structures includes composite materials on composite risers (Amaechi and Ye Citation2017; Amaechi, Gillet, Hon, et al. Citation2019; Amaechi, Gillett, Odijie, et al. Citation2019; Amaechi, Odijie, Etim, et al. Citation2019; Amaechi, Odijie, Sotayo, et al. Citation2019; Amaechi Citation2021f, Citation2021g, Citation2021h; Ye et al. Citation2021), and on marine hoses (EMSTEC Citation2016; Trelleborg Citation2016, Citation2018; Yokohama Citation2016; Continental Citation2020). Marine hoses are classified as single carcass and double carcass (Amaechi Citation2021e, Citation2021i, Citation2021j, Citation2021k, Citation2021l; Amaechi, Chesterton, Butler, et al. Citation2021a, Citation2021b). The primary function of marine hoses includes loading, transporting, transporting, discharging or offloading operations in the oil field (Bai and Bai Citation2005; Guo et al. Citation2005; Palmer and King Citation2008; Amaechi, Wang, Hou, et al. Citation2019). A typical CALM buoy hose system is shown in .
Figure 1. An operational floating CALM Buoy showing attached hawsers and floating hoses (Courtesy: CultofSea). (This figure is available in colour online.)
Generally, CALM buoys are offshore structures that display six degrees of freedom (6DoF) motions (Berteaux Citation1976; Duggal and Ryu Citation2005; Ryu Citation2006; Bluewater Citation2009, Citation2011; Wang and Sun Citation2015) and are usually restrained using mooring lines (Ricbourg Citation2006; Wichers Citation2013; Amaechi, Wang, Hou, et al. Citation2019; Amaechi, Ye, Hou, et al. Citation2019). They are also used in ocean environments, and their motions could be induced by water waves (Chakrabarti Citation1972, Citation1975, Citation2001, Citation2005; Hirdaris et al. Citation2014; Sarpkaya Citation2014; Chandrasekaran Citation2015). Wave forces on offshore structures such as semisubmersibles (Zou et al. Citation2008, Citation2013, Citation2014; Bhosale Citation2017; Odijie, Quayle, Ye, et al. Citation2017; Odijie, Wang, Ye, et al. Citation2017; Amaechi, Odijie, Wang, et al. Citation2021; Amaechi, Wang, Ye, et al. Citation2021d, Citation2021e, Citation2021f) and Wave Energy Converters (WEC) structures (Pecher et al. Citation2014; Gu et al. Citation2018; Doyle and Aggidis Citation2019, Citation2021) are computed by considering both the inertial component and the drag component of the body as represented in Morison’s equation (Morison Citation1950; Zhang et al. Citation2015; Odijie Citation2016; Amaechi, Wang, Hou, et al. Citation2019). The complexities associated with the incident, scattered and diffusion wave potentials have been a subject of discussion in the offshore industry for quite some time. Useful applicable theories have been postulated to resolve some of these problems in these works (Odijie Citation2016; Amaechi Citation2021i) and journal articles (Amaechi, Wang, Hou, et al. Citation2019; Amaechi Citation2021a; Amaechi, Wang, Ye, et al. Citation2021a, Citation2021b). These forces direct some stress effects and lead to some motion instabilities due to complex potentials on the material (Brown Citation1985a, Citation1985b; Brown and Elliott Citation1987, Citation1988; Esmailzadeh and Goodarzi Citation2001). Some comparative studies have also been conducted based on configurations (Pecher et al. Citation2014; Amaechi, Ye, Hou, et al. Citation2019; Amaechi Citation2021a; Hasanvand and Edalat Citation2021). Hasanvand and Edalat (Citation2021) presented a comparative investigation on CALM and SALM terminals for operational and non-operational systems using the Persian Gulf Sea, by combining the techniques in the WEC model by Pecher et al. (Citation2014) and CALM buoy model by (Amaechi, Wang, Hou, et al. Citation2019; Amaechi, Ye, Hou, et al. Citation2019). Hasanvand and Edalat (Citation2020, Citation2021) observed that the tensions generated at the PLEM of the SALM were less than the tension for the CALM terminal, and that for both cases, the connection point should be one critical consideration. Stability and wave forces are also important as they could also direct some bending forces on hoses, and deformations on these offshore structures. As such, the need to investigate the motion characteristics of the floating structure, the hydrodynamic performance, and the structural component comes up based on earlier studies (MacCarny and Fuchs Citation1954; Garrison Citation1974, Citation1975, Citation1979, Citation1984; Isaacson Citation1977, Citation1979; Lighthill Citation1979; Molin Citation1979; Rahman Citation1984, Citation1997). There are recent investigations on the hydrodynamic performance and wave-structure interaction (WSI) of offshore structures (Kannah and Natarajan Citation2006; Konovessis et al. Citation2013; Gao et al. Citation2015; Nallayarasu and Senthil Kumar Citation2017; Jiang et al. Citation2020; Poguluri and Cho Citation2020). Poguluri and Cho (Citation2020) presented a numerical and analytical investigation on wave interaction for a vertical slotted barrier based on computational fluid dynamics (CFD) using turbulent Reynolds-averaged Navier-Stokes (RANS) model, as a complementary approach to computing the hydrodynamic performance. Konovessis et al. (Citation2013) presented an investigation on the stability of offshore floating offshore structure generally while Esmailzadeh and Goodarzi (Citation2001) focused on CALM systems by presenting an analytical investigation on the stability of CALM floating offshore structures. The latter considered the governing equations for the motion of floating structures based on nonlinear parametric ordinary differential equations of second-order and obtained conditions by applying Schauder’s fixed-point theorem. Huseby and Grue (Citation2000) conducted an experiment on higher-harmonic wave forces acting on a vertical cylinder for periodic Stokes waves on wave slope up to 0.24. Wang and Sun (Citation2013). presented an analytical investigation on the wave exciting forces acting on CALM buoy having skirts with experimental validation and found that the skirts affect it, particularly the exciting wave forces (Newman Citation1967, Citation1996; Vugts Citation1968; Milgram and Halkyard Citation1971; Mavrakos and Grigoropoulos Citation1994). The model was developed using earlier experiments on truncated cylinders (Faltisen et al. Citation1995; Hai-tao et al. Citation2003; Zheng and Zhang Citation2016; Li and Liu Citation2019) and vertical cylinders (Jacobsen Citation1949; Chakrabarti Citation1972; Raman and Venkatanarasaiah Citation1976; Raman et al. Citation1977; Chau and Taylor Citation1992; Feng et al. Citation2020), similar to other studies on hydrodynamic loadings (Sabuncu and Calisal Citation1981; Yeung Citation1981; Bhatta and Rahman Citation1995, Citation2003; Bhatta Citation2007; Venugopal et al. Citation2008; Zhou et al. Citation2014) and wave diffraction (Mei Citation1978; Wu Citation1991; Bhatta Citation2007; Liu et al. Citation2016). Bhatta and Rahman (Citation1995) studied the wave diffraction and radiation by a floating vertical truncated cylinder and investigated the wave forces and moment. Malenica and Molin (Citation1995) presented on third-harmonic wave diffraction acting on a vertical cylinder, by using Green’s function. Huang and Taylor (Citation1996) presented some analytical modelling on second-order wave diffraction acting on a truncated cylinder that is circular and under monochromatic waves and predicted locations for maximum elevation from the free surface based on linear wave theory and the nonlinear theories. Newman (Citation1963, Citation1967) presented the wave forces on large structures, drift force and moments on ships in waves, before later presenting an investigation on the second-order wave forces acting on a vertical cylinder (Newman Citation1996) and considered the finite depth formulation of MacCarny and Fuchs (Citation1954) by using Bessel and Hankel functions. Different forces and loads act on offshore buoys. Zhou et al. (Citation2014) investigated on the wave and current induced seabed response on submarine pipelines. Sagrilo et al. (Citation2002) presented a coupled dynamic technique on CALM systems based on diffraction equation and diffraction/radiation theory, and the study presented some profiles on assessment of the tension for the connections. Culla et al. (2007) presented a statistical moment prediction for a moored floating body that oscillated under irregular waves as a reference on CALM systems, using CPSP and SLSP perturbation methods. Generally, these studies are needed for accessing the strength and stability of various offshore structures, hull designs and components. Slender body connections mostly consider Morison’s theory, such as composite marine risers (Wang and Sun Citation2015; Pham et al. Citation2016; Amaechi and Ye Citation2017; Amaechi, Gillet, Hou, et al. Citation2019; Toh et al. Citation2018), bundled hybrid offset riser (BHOR) systems (Bai and Bai Citation2005; Webster et al. 2011; Dareing Citation2012, Citation2019; Sparks Citation2018) and marine bonded hoses (Amaechi and Ye Citation2017; Amaechi, Gillet, Hou, et al. Citation2019; Amaechi, Wang, Hou, et al. Citation2019; Amaechi, Ye, Hou, et al. Citation2019; Gao et al. Citation2016, Citation2017, Citation2018, Citation2021). Generally, marine hoses are also layered structures, that are well bonded and have a helix reinforcement which is usually made of steel. Different types of marine bonded hoses include floating hoses, submarine hoses, reeling hoses and water hoses. These marine hoses are dependent on the support of an existing marine structure, such as the Single Anchor Leg Mooring (SALM) buoy, Catenary Anchor Leg Mooring (CALM) buoy, Floating Production Storage and Offloading (FPSO) or FSO tanker. However, these marine hose structures are connected using different configurations on single point moorings (SPM) terminals. Currently, there are different configurations, such as the Lazy-S, Steep-S, Chinese lantern, Conventional Multi-Buoy Mooring (CMBM) and the tandem mooring. Due to these different configurations and applications of these marine hoses, there are usually different operations and factors that result in hose failures and thus reduce the service life of the marine hoses. These include the impact of harsh waves and weather (environmental conditions), the hose-line clashing with another hose, the impact from an FPSO or a tug boat, the fail-safe failure during hose disconnection, the impact of marine hose on the mooring lines, the damage on the liner of the marine hoses, the disconnection-induced load creating large hose pressure, failure of the hose end valve (HEV), and failure of the marine breakaway coupling (MBC). There is a gap in the effect of disconnection on marine bonded hoses but this has also been an issue, as reported in the CALM buoy incidents (ABCNews Citation2005; Jean et al. Citation2005). An example is the Girassol buoy whereby there was premature rupture of Girassol buoy’s mooring chains encountered an early fatal fracture despite being in operation for about 6 months which was attributed to the first free link of the mooring chain been out of plane thereby resulting to bending fatigue while still positioned in the fairlead of the chain support (Jean et al. Citation2005; Edward and Kr. Dev Citation2021), and this affected the system as an integrity check had to be carried out on the entire CALM buoy hoses. In another study by O’Sullivan (Citation2002, Citation2003), some challenges on the prediction of different loads and responses that can interact thereby influencing the motion of offloading systems and particularly deep water CALM buoys were presented but the hose disconnection was not studied. Several researchers have investigated the mathematical, numerical and experimental model tests on marine bonded hoses. Some studies on the performance behaviour of marine bonded hoses conducted theoretically show that hoses respond to different loadings such as vertical bending forces (Quash and Burgess 1979; Brown 1984; Brown and Elliott Citation1988; O’Donoghue 1988; O’Donoghue and Halliwell Citation1990; Zhou et al. Citation2018; Gao et al. Citation2021). Some earlier investigations include small-scale model tests (Pinkster & Remery 1975; Quash & Burgess 1979) and large scale tests (Brady et al. Citation1974; Brady et al. Citation1974; Saito et al. 1980; Young et al. 1980; Tschoepe and Wolfe 1981; Lebon and Remery 2002). More recent investigations have involved more numerically investigations (Roveri et al. Citation2002; Lassen et al. Citation2014; Amaechi, Wang, Hou, et al. Citation2019; Edward and Kr. Dev Citation2021) and experimental validations (Cozijn and Bunnik Citation2004; Cozijn, Uittenbogaard, Brake, et al. Citation2005; Duggal and Ryu Citation2005; Le Cunff et al. Citation2007, Citation2008). Gao et al. (Citation2021) and Zhou et al. (Citation2018) presented theoretical analysis on the reinforcement layers of marine bonded hoses with spiral stiffeners subjected to internal pressure. Gao et al. (Citation2018) presented an experimental and numerical analysis on marine composite rubber hoses that are ring-stiffened under internal pressure. Some other works include parametric studies on marine bonded hoses under internal pressure, multiscale modelling, progressive damage and compressive-tensile fatigue of the cords
(Tonatto, Forte, et al. Citation2017; Tonatto, Tita, et al. Citation2017; Tonatto et al. Citation2016, Citation2018; Tonatto et al. Citation2019; Tonatto et al. Citation2020). Based on the load response, Lassen et al. (Citation2014) presented numerical modelling of marine bonded hoses with experimental tests on the helix and load-induced response. Amaechi et al. (Citation2019) presented a submarine hose model using the finite element model in Orcaflex and the hydrodynamic model in ANSYS AQWA and validated the model analytically. However, these studies did not also consider any accidental operation. Thus, this present study contributes to the knowledge by investigating the disconnection of these marine hoses and their load response effect under different wave loadings, configurations, and environmental conditions.
In this article, numerical and analytical solutions to wave diffraction forces on CALM buoy hose system with disconnection-induced load response during different operations have been conducted. The hydrodynamic analysis is carried out on the disconnection-induced load response of marine bonded hoses during normal operation and accidental operation under irregular waves. The marine hoses investigation is conducted on the CALM buoy system carried out on Chinese Lantern and Lazy-S configurations. In Section 2, some mathematical theories and governing equations include wave theory, boundary element method (BEM) and catenary equations. In Section 3, numerical modelling carried out is presented including the materials and methodology applied. In Section 4, the results and discussion are presented on this study. This study also investigates the loads' response on marine bonded hoses attached to a CALM buoy, under disconnection-induced loads. A comparative study on normal operation and accidental operation is also presented, with details on the hose performance, and some statistical analysis on hose parameters for the CALM buoy hose system.
2. Theoretical modelling
In this section, some theory and the governing equations in this study are presented.
2.1. Theory and governing equations
2.1.1. Wave theory
The governing equations used in the Orcaflex algorithm are based on applying Newton’s 2nd law of motion, Morison’s equation, JONSWAP spectrum equation, hydrodynamic equations, Navier-Stokes, and buoy stability equations. For irregular waves, the flow considered is turbulent, therefore neglecting the forces due to elasticity and the surface tension.
JONSWAP wave spectrum accounts for any imbalance in the energy flow within the wave system. Equations (50) is from Pierson–Moskowitz spectrum (Pierson and Moskowitz Citation1964), which is then applied as the JONSWAP spectrum (Hasselmann Citation1973). It was modified to take care of regions with geographical boundaries to limit the fetch regarding wave generation. The JONSWAP relationship is given as follows:
(1)
(1)
where denotes the angular frequency,
denotes the peak angular frequency, η denotes the incident wave amplitude, g denotes gravitational constant, γ denotes the peak enhancement factor, while the other parameters σ, σ1, σ2 are data items used by the solver. These are also dependent on the significant wave height, Hs and the period at zero-crossing, Tz.
Based on the forces on the risers, Morison’s equation was used, as it considers the wave forces moving onto a cylinder due to the body’s relative motion when immersed in the fluid (Morison Citation1950). This is represented as the summation of the Froude–Kyrov force FFK, the hydrodynamic force of the fluid, FH, and the drag force, FD. Morison’s equation is expressed in the following equation:
(2)
(2) where V is the volume of the body, Vr is the relative velocity of fluid particles, A is the area of the body, Ca is the added mass coefficient, Cd is the drag coefficient, Cm is the inertial force coefficient and D is the diameter of the body. The equation can be simplified, as the fluid force is equal to the sum of the drag force and the force of inertia, thus Equation (3);
(3)
(3)
The global design conducted in this investigation was carried out under irregular waves, and the damping was calculated as presented in the revised Morison Equation (Morison Citation1950).
(4)
(4)
2.1.2. Boundary element method
Two sets of numerical models were utilized in the present research; a finite element model (FEM) cum a hydrodynamic model based on the BEM which was formulated using potential flow theory, developed in ANSYS AQWA (ANSYS Citation2017a, Citation2017b). While the FEM uses differential equations in its solutions, BEM uses integral equations in its solutions. BEM is used because of the integral functions and source potentials, thus it reduces the integral equations. Secondly, the BEM considers only the surface of the body during meshing, and reduces the dimensions by first-order. This reduces the size of the problem and is convenient for solving finite elements occupied within infinite space, as such far distances are not considered. The motion responses and force parameters for this CALM buoy were calculated using this model. The body’s motion is relative to the submerged volume of the CALM buoy, which is the wetted surface, sw. As the CALM buoy hull oscillates, there are changes in the surface area, and it experiences some deformation (Odijie and Ye Citation2015a, Citation2015b; Odijie Citation2016; Amaechi, Wang, Hou, et al. Citation2019; Amaechi Citation2021a). However, to explain the dynamic effect of fluid–structure interactions on the stability (balance) and strength (deformation) of floating bodies like CALM buoys, a complete overview of diffracted and radiation wave conditions is needed. In this analysis, hydrodynamic relationships were used to evaluate flow pressure and force quantities and to correlate different variables and correlations. These are founded on the fluid’s source potential resolution of a free-floating body having 6DoF. When considering an impermeable CALM buoy hull having an incompressible, irrotational and inviscid fluid, the velocity field of the fluid flow domain satisfies the Laplace definition expressed in Equation (5); where denotes the velocity potential and
demotes the Laplace operator.
(5)
(5)
Considering the rectangular coordinate system (x.y,z), the Laplace identity in Equation (5) becomes:
(6)
(6)
While, in a cylindrical or polar coordinate system (r,θ,z), the Laplace identity in
(7)
(7)
Based on the application of the boundary conditions at the seafloor, at any submerged surface of the buoy’s hull, and the free surface, then Equation (8) can be obtained as computed (for instance, choosing the seafloor).
(8)
(8)
Bernoulli’s equation correlates the fluid’s velocity potential of a flowing stream to the hydrodynamic pressure (Phyd) given in the relationship in Equation (9);
(9)
(9) where h denotes the draft height (that is the height of the buoy’s hull from its submerged area), t denotes time and
denotes the seawater density.
The complexities associated with resolving velocity potential around the boundaries described in the equations above can be resolved using various wave theories. The total wave potential is expressed as a sum of the incident, diffraction, and radiation wave potentials in linear normal wave theory (Airy wave), as given in Equation (10);
(10)
(10) where φR denotes the radiation potential, φS denotes the scattered wave potential and φI denotes the incident wave potential.
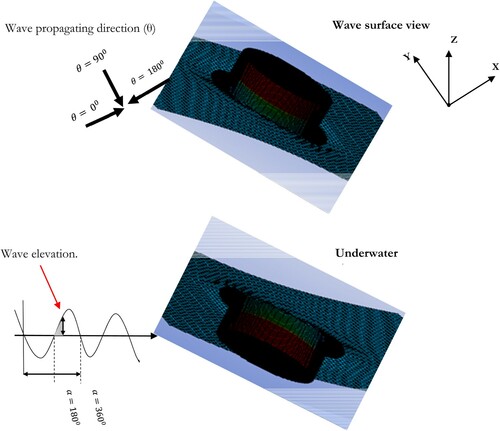
On the XY plane, both the regular wave and the irregular wave have an elevation that forms an angle. The ‘wave direction’ is the term used to describe this angle, as illustrated in .
Figure 2. Wave definition on a floating CALM buoy. (This figure is available in colour online.)
2.1.3. Hydrodynamic equations
Along the horizontal plane, the hydrodynamic force that acts on a body is represented in Equation (11), can be mathematically written as;
(11)
(11)
where {x} denotes the motion vector, [K] denotes the stiffness matrix, [C] denotes the structural damping matrix, [M] denotes mass matrix of the hull while {Fhyd} denotes the hydrodynamic force vector (Odijie and Ye Citation2015a; Odijie Citation2016; Amaechi, Wang, Hou, et al. Citation2019).
Since the hydrodynamic exciting forces are a product of the wave potential, which is a function of incident waves for each unit amplitude, they were derived from the wave exciting force.
(12)
(12)
The expression for the wave exciting forces is represented in Equation (12), where{W} denotes the velocity field vector of the steady flow; fw denotes the wave oscillating frequency, ui denotes the incident diffraction wave potentials per unit amplitude; ui denotes the diffraction wave potentials per unit amplitude; ρ denotes the density of sea water; and i denotes DoF.
2.1.4. CALM Catenary equations
The governing equation used in the calculation of the statics for the mooring lines is the Catenary equation. It is also applied in other applications like Steel Catenary Risers (SCR) and cable structures (Irvine Citation1981; Bai and Bai Citation2005; Amaechi, Wang, Hou, et al. Citation2019). In the case of mooring lines, which suspends from the PC Semi to the anchor on the seabed, and thus take up a catenary shape that is approximate, and is defined by the following Equation (13), where w denotes weight per unit length and H denotes the tension along the horizontal component.
(13)
(13)
(14)
(14)
(15)
(15)
(16)
(16)
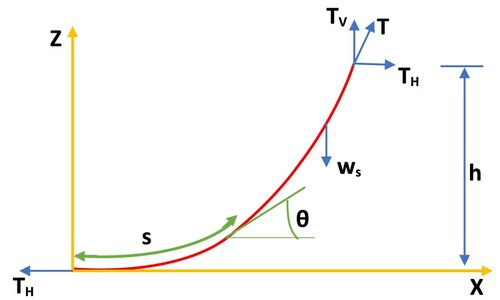
The catenary equations for CALM systems is presented in Equations (13)–(19), where h (or z) denotes the height above seabed, s denotes the arc length, x denotes the section length of the mooring cable, ws denotes the submerged weight, TH denotes the tension along the horizontal component, Tv denotes the tension along the vertical component, T denotes the tension component along the plane, V denotes the body’s volume and W denotes the body’s weight. The schematic of the catenary mooring system of the CALM Buoy is illustrated in .
(17)
(17)
(18)
(18)
(19)
(19)
Figure 3. Schematic of Catenary Mooring system of CALM Buoy under static state. (This figure is available in colour online.)
2.1.5. Marine hose and riser equations
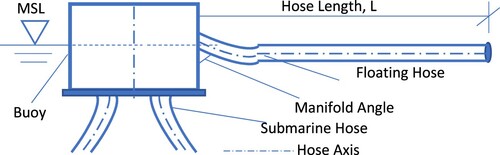
Considering the motion of the hose to be in the direction perpendicular to the Mean Water Level (MWL), then the equation of motion in Equation (20) exists, as presented by Bishop & Johnson (Citation2011), where the load, Q depends on the weight of the hose, w and the radius of the hose, r located on the sea of sea depth, h and EIz is the bending stiffness of a general section of hose.
(20)
(20)
Considering a short segment of the hose-string, as given in , it can be easily deduced from the governing differential equations (Sparks Citation2007; Dareing Citation2012). The resultant force, T0 is located at point A on the arc length, s. The horizontal force, H0 is from the origin, O of the Cartesian Coordinate system and the vertical force is V0. The external pressure Po, acts on the body of the hose whilst the external force, Fo acts at the top section of the hose string. Due to the motion of the hose string being different for each time duration, thus it will make different angles between the axis of the hose string and horizon, θ(i=1,2,3,..n). The amount of times it uses for a full wave cycle is given by n. Betwixt the horizontal and the resultant force’s direction makes an angle given by θ0. The submarine hose being modelled is considered as a beam under tension, as shown .
Figure 4. Schematic of short segment of riser hose string. (This figure is available in colour online.)
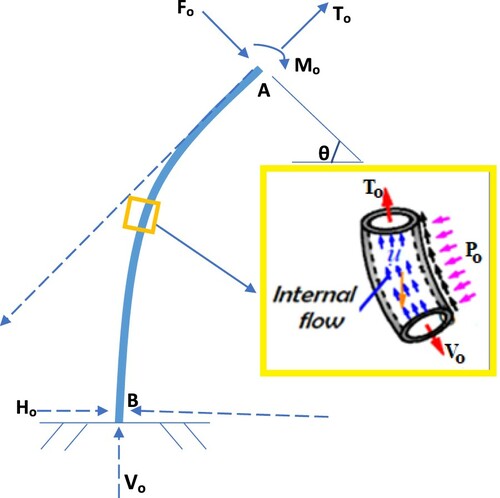
Figure 5. Submarine hose segment showing spline line and nodes. (This figure is available in colour online.)
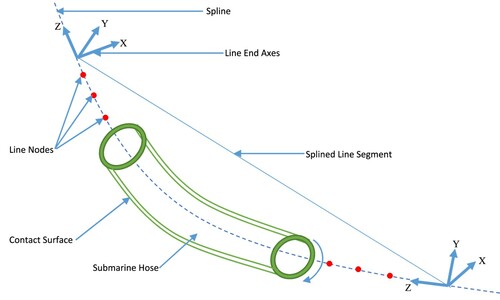
Hose curvature is given by the inverse of the minimum bending radius (MBR), as
(21)
(21)
The limit of permission for the bending radius is subject to the stiffness, EI, becomes
(22)
(22)
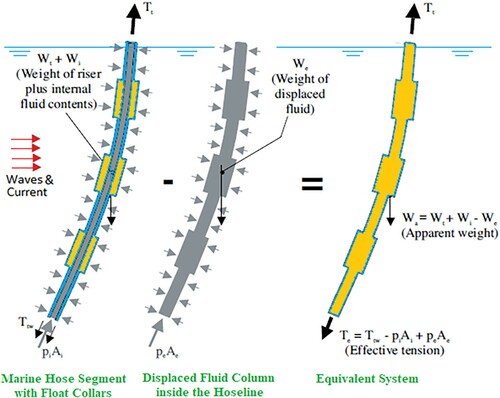
Based on the hose content or marine riser content, the pressure field acting on the internal fluid column is closed and in equilibrium with the weight of the internal fluid. The lateral pressures acting on the pipe wall are equal and opposite to those acting on the internal fluid. Hence, by superposition and addition of the two force systems, those lateral pressures are eliminated. However, the supposedly axial tension in the fluid column denoted as – piAi remains; where pi is the internal pressure and Ai is the internal cross-sectional area of the pipe (Sparks Citation2007, Citation2018). This leads to the equations for the effective tension Te and apparent weight wa of the equivalent system.
When external pressure pe is also present, it can be approached in a similar fashion. Both lateral pressure effects are removed by adding the force systems acting on the pipe section and the internal fluid, then subtracting the force system operating on the displaced fluid. When external pressure pe is also present, it is approached similarly, as depicted in and .
Figure 6. The equivalent force system of Marine Risers/Hoses for internal fluid and external fluid flows. (This figure is available in colour online.)
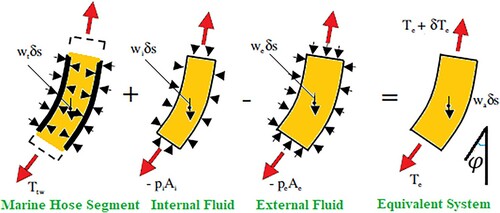
Figure 7. Schematic of force loads and pressures acting along a hose-string segment or a long riser segment. (This figure is available in colour online.)
The force systems operating on the pipe section and the internal fluid are added together, and then the force systems are subtracted. In and , and wt denotes the equivalent system’s weight, we denotes the weight of the displaced fluid column, wa denotes the weight of the internal fluid column while wi denotes the weight per unit length of the tube.
The effective tension, denotes the axial tension calculated at any point of the riser by considering only the top tension and the apparent weight of the intervening riser segment (Sparks Citation2007, Citation2018; Dareing Citation2012, Citation2019; Amaechi et al. Citation2019). The equations for the effective tension Te can be expressed as in Equations (23) and (24).
(23)
(23)
(24)
(24)
For the apparent weight wa that can then be represented by Equation (74)
(25)
(25)
The resolution of forces along the axial direction of an element of length ds, can be represented as:
(26)
(26)
Considering the resolution of forces along the vertical plane of an element of length ds at small angles to the vertical, yields:
(27)
(27)
2.1.6. Orcaflex line theory
The Line theory as depicted in the line theory model in was applied for the Finite Element Model (FEM) in Orcaflex 11.0f. It was modelled by utilising the nodes on the hoses and mooring lines, as shown in . It applies some discretization for the CALM buoy, to ensure less computational time and resources (Orcina Citation2014, Citation2020, Citation2021; Amaechi, Wang, Hou, et al. Citation2019; Amaechi, Ye, Hou, et al. Citation2019).
Figure 8. Orcaflex line model (Adapted with permission, Courtesy: Orcina Citation2014, Citation2020). (This figure is available in colour online.)
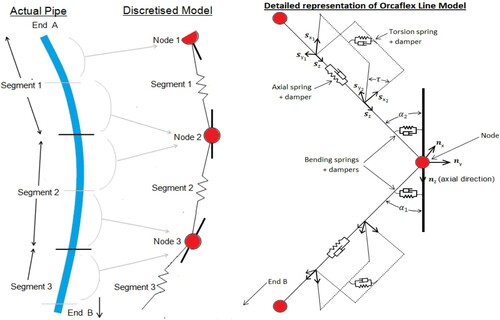
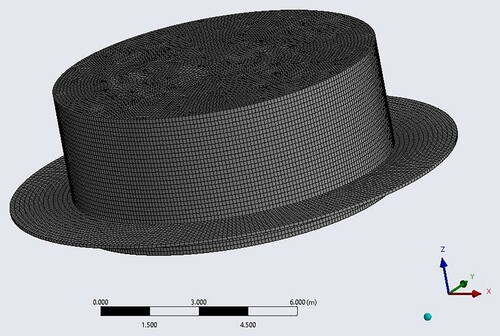
Figure 11. Hydrodynamic Panel Model of CALM buoy (in ANSYS AQWA R2 2020). (This figure is available in colour online.)
2.2 Analytical model
The analytical model for the CALM buoy having skirt is depicted in . Based on the problem formulation, the floating buoy of mass m is considered having a draft denoted as T, radius of the buoy denoted as a1 and radius of the buoy’s skirt is a2. The water depth is denoted as d, and is assumed to be constant. The skirt has a thickness that is equal to S2-S1, where S2 denotes the distance between the top of the skirt and the seabed, while S1 denotes the distance between the bottom of the skirt and the seabed.
Figure 9. Illustration of CALM buoy with skirt and wave diffraction. (This figure is available in colour online.)
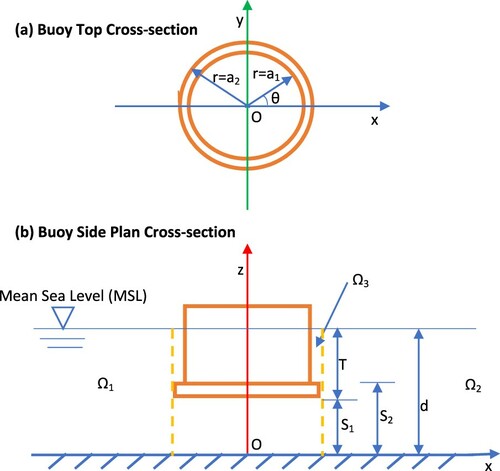
Some assumptions that were considered include that the fluid is inviscid, incompressible and irrotational flow. For the model, two reference frames acting from the origin locus at the seabed, were considered. These are the cylindrical polar coordinates (r,θ,x) and the cylindrical cartesian coordinates (x,y,z), acting along the vertical axis in z-direction and the horizontal axis in x-direction. To appreciate the force field induced on the buoy by considering a regular wave having a wave height H, and propagates along the horizontal plane in the x-axis with wave frequency ω. Thus, the total velocity potential can be represented using cylindrical polar coordinates (r,θ,x), for the diffracted waves and the incident waves, as:
(28)
(28)
However, the wave frequency is related by dispersion with the wave number k as in:
(29)
(29)
Where the value of , k denotes the wave number and g denotes the acceleration due to gravity.
The velocity potential can be represented from solving the Laplace equation and obtaining the solution for the entire fluid domain which will satisfy the following boundary domains:
(30)
(30)
(31)
(31)
(32)
(32)
(33)
(33)
An additional boundary condition considered is the radiation condition for the outgoing waves on the CALM buoy system, thus:
(34)
(34)
To linearize the problem, the fluid pressure p(r,θ,z,t) can be obtained by applying the unsteady linearized Bernoulli’s Equation, where ρ denotes the seawater density and t is the time for the wave oscillation in the polar coordinate.
(35)
(35)
The resultant wave excitation moment and the resultant wave excitation forces that acts upon the floating CALM buoy can be written as
(361)
(361)
(37)
(37)
(38)
(38)
Herewith, the CALM buoy’s mean wetted surface denoted by SB, the vertical position of the Centre of Gravity (CoG) is denoted by zg, the x- component of the outward unit normal vector is denoted by nx while the z-component of the outward unit normal vector is denoted by nz.
As depicted in , the fluid domain has been subdivided into three fluid regions represented by Ω1, l=1, 2, 3, as depicted in . The relationship for the velocity potential φ1, that satisfies the Laplace Equation and Equations (30), (31), and (34) can be written to be:
(39)
(39)
Within the exterior fluid region Ω1, the velocity potential around can be written as:
(40)
(40) whereby
represents the Bessel function of first kind and order m;
represents the modified Bessel function of the second kind of order m, while
represents its first derivative;
represents the Hankel function of first kind of order m, while
represents its first derivative.
It is noteworthy to state that = -ik, whereby
satisfies the expression in Equation (41):
(41)
(41)
Within the interior fluid region Ω2, the solution for the velocity potential can be written as
(42)
(42)
(43)
(43) where
denotes the modified Bessel function of first kind and order m.
Thus, within the fluid region Ω3, the velocity potential can be written as
(44)
(44)
(45)
(45)
Whereby represents the Hankel function of second kind of order m, and
represents its derivative.
The boundary conditions for continuity of the potential function at , are given as
(46)
(46)
(47)
(47)
Considering the both the conditions that are needed for the continuity of the velocity in addition to the kinematical boundary conditions at , these boundary conditions can be written as
(48)
(48)
The body boundary conditions at , can be expressed as
(49)
(49)
Using the method by Wang and Sun (Citation2013), both sides of Equation (46) are multiplied by cos, Equations (47 and 49) by
and Equation (48) by
, and next integrating the resultant equations all through each of the regions of validity. Based on logistics on the numerical implementation of the method, some truncation of series to limit it is necessary. The infinite series are truncated after N1+1 terms within region Ω1, N2+1 terms within region Ω2, N3+1 terms within region Ω3, respectively. By utilising the trigonometric functions’ orthogonal characteristics, the solution can be obtained for the unknown coefficients of Amn,Bmn, Cmn, Dmn.
3. Numerical modelling
3.1 Model description
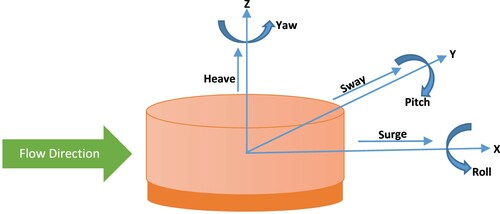
CALM buoys are offshore structures that display 6DoF, as depicted in and . CALM buoys are designed as an application of single point mooring (SPM), by considering industry specifications. For mooring of the floating structures, the design considerations used are from industry specifications API RP 2SK (API Citation2005), ABS (ABS Citation2021) and DNVGL-OS-E301 (DNV Citation2015a, Citation2015b, Citation2016). They are also used in ocean environments and their motions could be induced by water waves. The global loads are based on DNVGL (Citation2017). Wave forces on marine structures are computed by considering both the inertial component and the drag component of the body as represented in Morison’s equation. This is detailed in subsequent sections herein.
Figure 12. FEM of CALM Buoy system in Lazy-S showing nodal axes in Orcaflex. (This figure is available in colour online.)
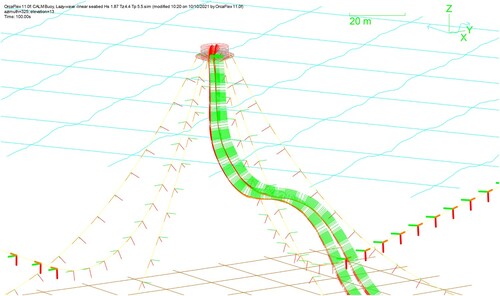
Figure 13. Motion components showing coordinates and six degrees of freedom of a floating buoy. (This figure is available in colour online.)
3.2 Methodology
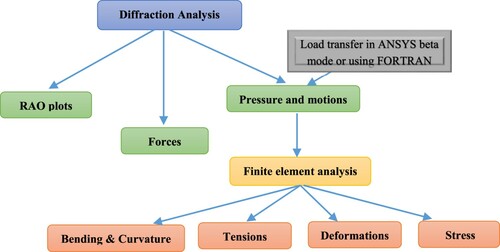
The methodology applied is a coupled dynamic modelling of ANSYS AQWA and Orcaflex, as presented. A schematic sketch of this numerical procedure is depicted in . The methodology for the analysis was performing the hydrodynamic analysis of the floating buoy using ANSYS AQWA R2 2020. The amplitude values for the motion called RAOs are then loaded into Orcaflex 11.0f. The method of analysis is based on the effect of disconnection-induced loads on the marine hoses, as such the motion of the buoy was also investigated. The numerical procedure was conducted in two stages. The first stage was the hydrodynamic analysis or diffraction analysis, and the second stage was the finite element analysis (FEA), as shown in . The model involves the generation of the RAOs and then using the fluid hydrodynamic pressure to input the RAOs. These RAOs are computed at a variation of phase angles and can be exported in two ways: either by using ANSYS AQWA beta mode or loading the generated RAOs in a text file that is scripted using FOTRAN language in ANSYS APDL. This is then loaded into the finite element analysis as a load mapping processing.
Figure 10. Schematic chart for the numerical analysis. (This figure is available in colour online.)
3.3 Panel hydrodynamic model
The modelling of hydrodynamic aspects includes the development of the panel hydrodynamic model for the CALM buoy. This has been presented in the sea environment as in . It was utilised in the hydrodynamic investigation in ANSYS AQWA R2 2020. The RAO values obtained were from a free-floating CALM buoy without any mooring lines or marine bonded hoses attached to the CALM buoy.
3.4 Finite element model
As illustrated in the line theory model in , the Line theory was applied for the Finite Element Model (FEM) in Orcaflex 11.0f. It was modelled by utilising the nodes on the hoses and mooring lines, as shown in . It applies some discretization for the CALM buoy, to ensure less computational time and resources (Orcina Citation2014, Citation2020, Citation2021). The submarine hose model was configured as Lazy-S. The statics calculation for the submarine hose was done by B-splines as presented in . The model setup for a similar study has been given in the literature (Amaechi, Wang, Hou, et al. Citation2019; Amaechi, Ye, Hou, et al. Citation2019).
3.5 Materials
The materials applied in this numerical model are presented in this sub-section.
3.5.1 Buoy
The cartesian coordinate system of the floating buoy is presented in . The buoy's body was 10m in diameter, and a draft line was considered in the modelling. The model was developed by fitting the floating characteristics of the buoy in the FEM, as shown in . The details on the buoy parameters are presented in .
Figure 14. FEM in Orcaflex showing floating buoy model with details on moorings and marine bonded submarine hoses. (This figure is available in colour online.)
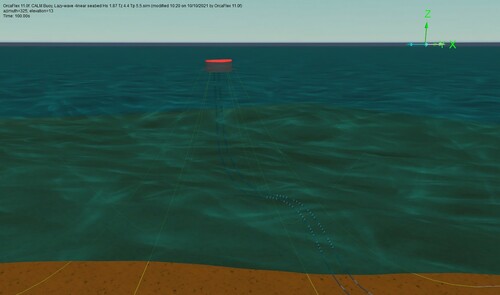
Table 1. Parameters for the Buoy.
3.5.2 FPSO tanker
The FPSO applied in this model is an FPSO tanker that can be used for offloading and discharging operations, as presented in the Orcaflex model shown in . The length of the FPSO is 103 m, and it is designed with attachments couplings for the floating hose and hawsers. Details of the FPSO parameters are presented in . The calculations on the FPSO are the primary motion for the 6DoFs, wind load, current load, 1st order wave loads, 2nd order wave drift load, wave drift damping, damping, and added mass. The hydrodynamics of the floating FPSO was designed using vessel theory (Orcina Citation2020). The ship-shaped FPSO has six degrees of freedom (6DOFs), as presented in .
Figure 15. The 6DoF motions for the FPSO. (This figure is available in colour online.)
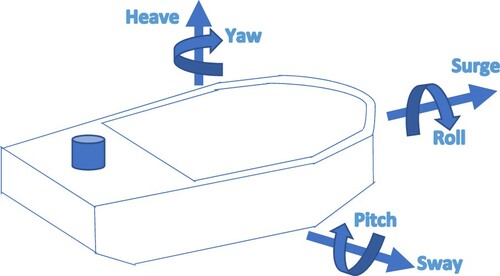
Table 2. Parameters for the FPSO.
3.5.3 Floats
The floats are made from materials that can help them to float and ensure good buoyancy. The floats were designed differently depending on the application. The float on the submarine hoses and the floating hoses were slightly different sizes but the same materials, as given in . An illustration of buoyancy floats is shown in .
Figure 16. illustration of floats on a marine bonded hose. (This figure is available in colour online.)
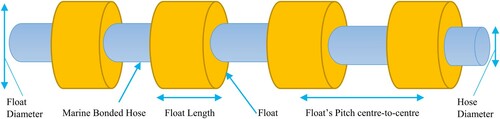
Table 3. Parameters for the Float.
3.5.4 Marine breakaway coupling (MBC)
The MBC was modelled to have three sections and was attached to the floating hose. The outer diameter (OD) of the MBC is 0.735m while the inner diameter (ID) of the MBC is 0.5 m. It was made of steel material with a material density of 7850kg/m3. MBC can be connected between two hose sections at strategic locations close to the hose end nearer to the service tanker or where needed on the marine hose, such as on reeling hoses and floating hoses (EMSTEC Citation2016; Yokohama Citation2016; GallThomson Citation2018; MarineBreakawayCouplings Citation2018; TechFlowMarine Citation2021). Typical MBC is shown in .
Figure 17. Typical: (a) Marine Breakaway Coupling on a floating hose and (b) a Petal Valve MBC (Courtesy: Gall Thomson). (This figure is available in colour online.)
3.5.5 Floating hose
The floating hose modelled in this investigation is connected to a manifold, as illustrated in . The hose has an outer diameter of 0.64 m and an inner diameter of 0.5 m, and a mass per unit length of 182.1 kg/m. It was designed using GMPHOM OCIMF (OCIMF Citation2009) and API 17K (API Citation2017) industry standards with a limit consideration on the minimum bending radius of 2.0 m. A typical floating hose is shown in (a).
Figure 18. Illustration showing loadings on the floating hose and submarine hose attached to the floating buoy. (This figure is available in colour online.)
3.5.6 Submarine hose
The submarine hoses were designed using Lazy-S configuration as depicted in . The submarine hose's inner diameter (or bore) is 0.49 m, while the outer diameter is 0.65m, as detailed in . The length of the submarine hose was 162.63 m, and connected from the Pipeline End Manifold (PLEM) to the underneath manifold of the CALM buoy, as illustrated in . The hoses were designed for fully filled conditions and tested with both seawater and oil. The seawater and the oil densities are 1025 and 825 kg/m3, respectively.
Figure 19. Hose segment of 12m in length, showing descriptions with markings. (This figure is available in colour online.)
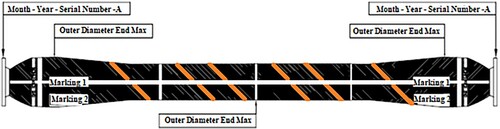
Table 4. Array of the submarine hose-string for 3 divisions (or sections).
3.5.7 Hawser
Two hawser cables were designed that connect the floating buoy to the FPSO tanker, shown in . The outer diameter 0.0765 m, with mass per unit length of 5.25 kg/m. The hawser is a thick cable because the principle behind its manufacture is with three-rope strands twisted together left-handed in three ways to have nine strands. The hawser is designed with polyamide materials. It is a thick rope with flexible properties. The weight was considered in setting up the model for the single point mooring (SPM).
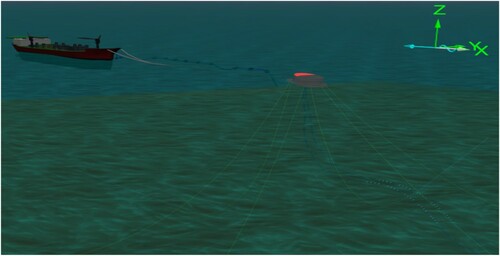
Figure 20. The FPSO tanker attached to the CALM buoy offloading system showing hose disconnect (in Orcaflex 11.0f). (This figure is available in colour online.)
3.5.8 Mooring lines
The CALM buoy model was moored using six (6) mooring lines, arranged as shown in and . The materials for the mooring lines were a composite arrangement of steel chain and polyester rope, as detailed in .
Figure 21. The arrangement of the mooring chains around the CALM buoy showing top plan view with global load linearity. (This figure is available in colour online.)
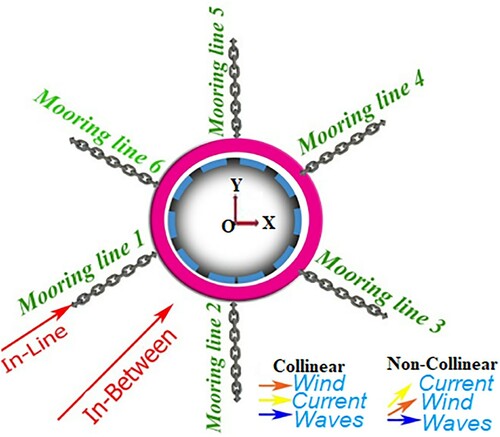
Table 5. Parameters for the Moorings.
3.6 Design parameters
The design parameters applied in this investigation are presented in this sub-section.
3.6.1 Ocean and seabed
The numerical model was designed using some ocean and seabed considerations for the model. The seabed profile is modelled as 3D flat seabed, and it is determined by using the top surface of the seabed in regards to its position with the surface of the sea called the Mean Sea Level (MSL), as shown in , and . The seabed is a function of hydraulic pressure that influences its stability, such as pore water pressure, as detailed in literature (Eshiet Citation2012; Li et al. Citation2016; Odijie Citation2016). The parameters for the seabed and the ocean in the study are given in . This method of wave computation coupled with oceanic and seabed parameters has been validated in some technical studies on different offshore structures (Odijie and Ye Citation2015a, Citation2015b; Odijie Citation2016; Amaechi, Wang, Hou, et al. Citation2019; Amaechi 2021; Amaechi, Wang, et al. Citation2021a).
Table 6. Parameters for the Ocean and Seabed.
3.6.2 Waves and wave spectrum
The numerical model was designed using some environmental considerations for the weather. The wave angles considered in this investigation were at an interval of 0°, and are as follows: 0°, 30°, 60°, 90°, 120°, 150°, 180°, as detailed in the wave parameters given in . An illustration showing the direction of waves and FPSO across the sea is presented in . The lowest frequency applied for the hydrodynamic design analysis in ANSYS AQWA was 0.06048 Hz. For the waves, the value for the peak factor was 3.3, and the wave spectrum considered was the JONSWAP spectrum, as plotted in .
Figure 22. Illustration showing the direction of waves and FPSO with respect to the sea, showing (a) the wave heading with various types of seas defined, and (b) waves on ship-shaped FPSO. (This figure is available in colour online.)
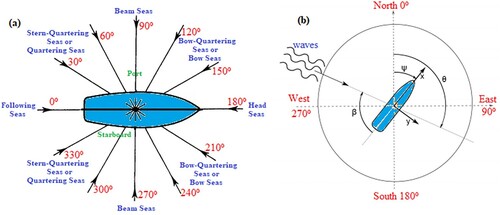
Figure 23. The sea states for the JONSWAP wave spectrum. (This figure is available in colour online.)
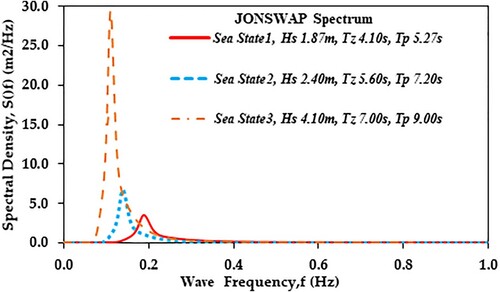
Table 7. Wave Parameters.
3.6.3 Wind and current
The present researched models were set up using some parameters in the modelling. For the wind and current, the speed of the wind was 22 m/s, while the speed of the surface current was 0.5 m/s. For the air, an air kinematic viscosity of 15.0×10⁻⁶ m2s−1 under an air density of 1.225 kg m3 (0.00123 g cm−3), as detailed in . A uniform profile for the current as presented in is utilised on the marine hose models on each of the cases investigated. (a) presents the wind load coefficient, while the current load coefficient is presented in (b).
Figure 24. The vertical profile of the Current at seabed origin. (This figure is available in colour online.)
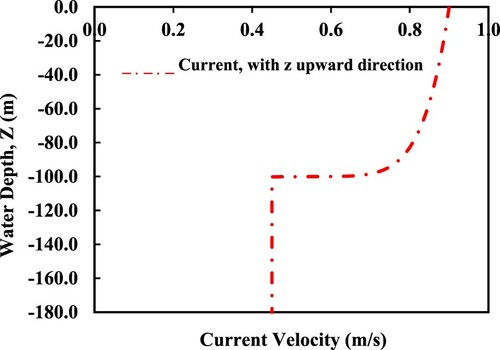
Figure 25. CALM buoy system loads showing (a) Wind load coefficient and (b) current load coefficients. (This figure is available in colour online.)
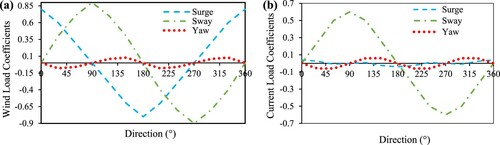
Table 8. Wind and Current Parameters.
3.7. Validation
The validation of the theory applied on this study is based on existing validated studies by the author (Amaechi, Wang, Hou, et al. Citation2019; Amaechi, Ye, Hou, et al. Citation2019; Amaechi, Wang, et al. Citation2021a). The dynamic models from Orcaflex are expected to be able to perform dynamic analysis on the hose in centennial configuration. The dynamic effects offered by Orcina's Orcaflex were examined on catenary S-lay pipeline through recently completed sea testing in field trials (Wang et al. Citation2017) and experimentally in Lancaster University wave tank (Amaechi Citation2021c, Citation2021d, Citation2021i). It was also validated numerically using confirmed static models on Lazy-S configuration (Amaechi, Wang, et al. Citation2021a), as well as on Chinese-lantern Configuration (Amaechi, Wang, Hou, et al. Citation2019). To evaluate the numerical model, a comparative analysis of a load case from the experimental test was used to validate the model and analytical model (Amaechi Citation2021c, Citation2021d).
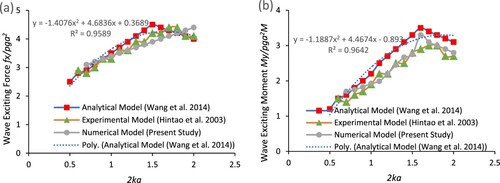
The second validation was carried out by comparing result of experiment against the analytical model in Section 2.2. To achieve this, values for N1,N2 and N3 were assumed for a finite depth d1 of 1.0m, deeper depth of 100m, and cylinder draft D of 0.3m, and the same radius of cylinder a1 of 0.13m. (a) is for the wave exciting force, while (b) is for the wave exciting moment. The analytical solution was obtain using the analytical solutions presented in Section 2. Comparing the results against experimental results (Hintao et al. 2003), the analytical results (Wang and Sun Citation2013) and the numerical results (present study) shows good agreement as observed in (a,b). Other validation methods considered are using coupled models and the parameters like effective tension and bending moment in other related studies.
Figure 26. Validation of wave diffraction on buoy showing (a) wave exciting force and (b) wave exciting moment. (This figure is available in colour online.)
4. Results and discussion
The results of this investigation and the discussion are put forward in this part of the article.
4.1 Buoy motion study
4.1.1 Statistical analysis on buoy motion response
The result of the environmental conditions given in was applied to investigate the buoy motion responses. It was conducted using the hydrodynamic RAOs generated from ANSYS AQWA, then inputted into the Orcaflex model by coupling. It can be observed that the buoy motion is dependent on the environmental conditions, as the three cases had different motion behaviour. It can be observed that the CALM buoy motion increased more in the surge motion than in the heave. Therefore, the tension magnitude of the mooring cables attached to the CALM buoy needs to be improved. However, the case3 values were generally the highest, followed by the case2 values and then the case1 values. Thus, this shows that some perturbations from the buoy motion can induce some response on the hoses, as will be shown in results in subsequent sections.
For the statistical method, two methods were applied to validate the model. They are the Pearson Correlation Coefficient and the Weibull statistical method. The application of the Pearson Correlation Coefficient to study the data from the buoy responses was possible when loaded with wave RAO loads. Pearson Correlation Coefficient is an important technique used in data mining in Ocean Engineering analysis (Mahjoobi et al. Citation2008; Moon et al. Citation2008; Gao et al. Citation2010; Wang et al. Citation2016; Ali and Prasad Citation2019). Correlation analysis is a technique used to investigate and analyse some relativity correlation of data variables, their dependence on the other, and the correlation of the direction of one variable with respect to others. Pearson correlation coefficient helps to obtain the strength, magnitude and direction correlation between the variables. This coefficient varies from -1 to 1, and values that approach close to 1 are positive correlations while the values close to -1 are the negative correlation.
The Correlation Coefficient of the buoy motions for surge, heave, roll and pitch motions are obtained for the 3 environmental conditions being investigated win the 42 cases. It was used to obtain the relationship when the buoy is loaded with wave load RAOs and when it is without wave load RAOs. Pearson Correlation Coefficient was obtained for each of the environmental conditions as presented in the literature (Amaechi, Wang, Hou, et al. Citation2019; Amaechi, Ye, Hou, et al. Citation2019). These coefficients are obtained by using the equation for Pearson correlation coefficient, given in Equation (50).
(50)
(50)
Where n denotes the sample size, denotes the average of the buoy motion without wave load RAOs,
denotes the average of the buoy motion with wave load RAOs, and r denotes the Pearson Correlation Coefficient. From , it can be seen that there is positive correlation between the buoy motions for the surge, roll and pitch while a negative correlation exists for the heave motion. This means that the motion of the buoy being predicted by the analysis will affect the hoses, despite the shallow water depth. However, the hoses need to be redesigned to cushion the heave effect from the heave motion of the buoy.
Table 9. Pearson Correlation Coefficients for the Buoy Motions.
For the Weibull statistical method, 95% confidence values of 21.8825 and 26.4572 were obtained. The 3-hour return level for the upper tail of the pitch motion (RY) is 23.4187° from the Weibull distribution. A threshold of 41 data points above the threshold of 17° with decluttering based on mean up-crossings is used. The fitted Weibull parameters obtained are presented in . The Weibull distribution tool has been used to validate the reliability of these motion results. The expression for the Weibull distribution is given by Equation (51):
(51)
(51)
Table 10. Weibull Analysis Distribution of the CALM buoy motions.
where x, α and β are numeric values; x is the value that is required to evaluate the function. From the results, it shows that the roll had the highest data points, followed by the surge motion. It was least in the heave, which means it had good stability in the heave motion.
4.1.2. Surge RAO & radiation damping on buoy
An investigation on the surge RAO and radiation damping has been carried out on three buoy models of varying skirt geometries. The skirts on the buoy presented in and were investigated for effect on the hydrodynamic behaviour using surge RAO. As shown in (a), BuoySkirt1(13.90m diameter) had the least surge RAO while BuoySkirt3 (11.90m diameter) had the highest surge RAO. Thus, the higher the skirt diameter, the lesser the surge RAO. (b) shows that BuoySkirt1was maximum at 215,191 N/(m/s). Thus, the diameter of the buoy skirt affects the surge RAO and the radiation damping. However, a detailed study on the motion response is recommended.
Figure 27. CALM buoy of skirt diameter (a) Ds1=13.90m (b) Ds2=12.90m and (c) Ds3=11.90m. (This figure is available in colour online.)
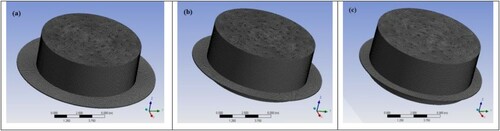
Figure 28. Influence of buoy skirt diameters. (This figure is available in colour online.)
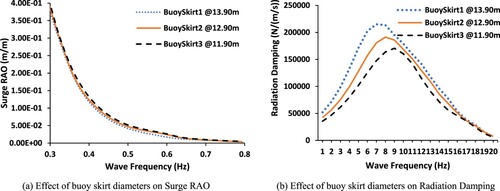
Table 11. Table showing CALM buoy skirt diameters considered.
4.2. Load response study
4.2.1. Floating hose load response in normal configuration
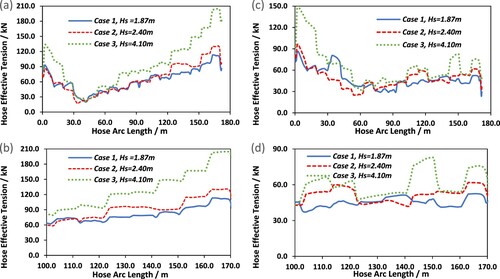
The investigation on the disconnection-induced load on the floating hose was investigated and the results are presented in . The hose bending moment in the normal operation shown in (a,b) shows a lower profile than the hose bending moment in accidental operation in (c,d). It was recorded that Case 3 has higher bending moment profile than that of Case 2, and the least bending moment is Case 1. The hose curvature in the normal operation shown in (a,b) shows a lower profile than the hose curvature in accidental operation in (c,d). It was recorded that Case3 has higher curvature profile than of Case 2, and the least curvature is Case 1. However, the curvatures obtained are still within the safe limit of less than 2.0 m as recommended in OCIMF (Citation2009) industry standard. In a similar manner, the hose effective tension in the normal operation shown in (a,b) shows a lower profile than the hose effective tension in accidental operation in (c,d). It was recorded that Case 3 has a higher effective tension profile than that of Case2, and the least effective tension is the Case1. Thus, it can be deduced that the hose performance is affected by disconnection-induced loads, however a fatigue study and local design are recommended on this to evaluate the extent of damage on the hose. It can be also be observed that the effective tension profiles at the ends are higher than at midpoints of the floating hoses, and at disconnection, the profile increases and has a transfer of tension in the opposite direction, which is typically represented as given in Section 2.5. Thus, it would be necessary to ensure that reliable and well-tested marine breakaway couplings are used during disconnection.
Figure 29. Result of the hose bending moment during (a-b) normal operation and (c-d) accidental operation. (This figure is available in colour online.)
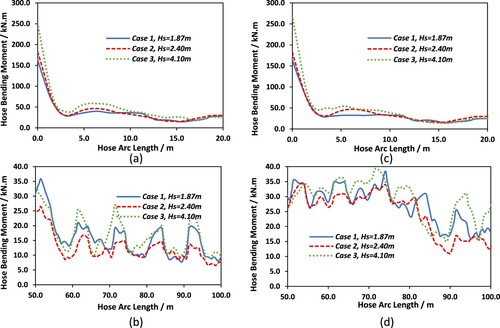
Figure 30. Result of the hose curvature during (a-b) normal operation and (c-d) accidental operation. (This figure is available in colour online.)
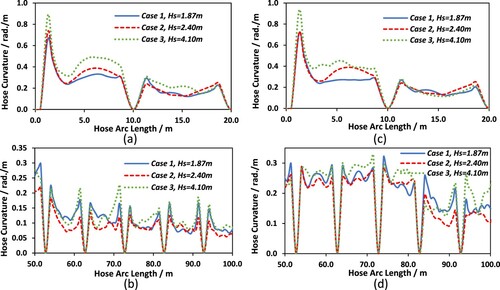
Figure 31. Result of the hose effective tension during (a-b) normal operation and (c-d) accidental operation. (This figure is available in colour online.)
4.2.2. Submarine hose load response in Chinese-lantern configuration
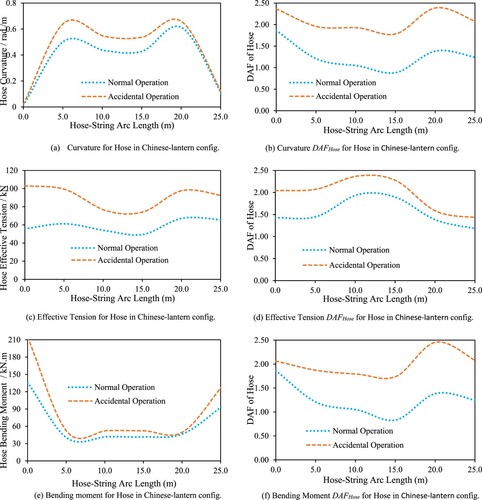
The investigation on the disconnection-induced load on the submarine hoses in Chinese lantern configuration was investigated and the results are presented in . This was also investigated by considering the DAFhose, as proposed by Amaechi, Wang, Hou, et al. Citation2019. The hose curvature for the accidental operation has higher curvature than the normal operation in (a). It was also observed in (b) that the curvature DAFhose for the normal operation is also lower than that of the accidental operation. In a similar manner, the hose effective tension for the accidental operation has higher effective tension than the normal operation in (c). It was also observed in (d) that the effective tension DAFhose for the normal operation is also lower than that of the accidental operation. Also, the hose bending moment for the accidental operation has a higher bending moment than the normal operation in (c). It was also observed in (d) that the bending moment DAFhose for the accidental operation is also higher than that of the normal operation. As such, it is necessary that a good integrity check is carried out on the submarine hoses after any accidental operation, no matter how minimal it may appear, unless it is assessed to be within safe limits. In the profiles, the Chinese-lantern configuration for the bending moment and the curvature have a slightly similar profile but different magnitudes. However, this does not ascertain the configuration that is more affected by the disconnection-induced load effect, but it indicates the presence of some load response from the marine bonded hoses. This requires further investigation on fatigue study which is recommended and investigated in another study.
Figure 32. Effect of hydrodynamic loads on the submarine hose in Lazy-S config. (This figure is available in colour online.)
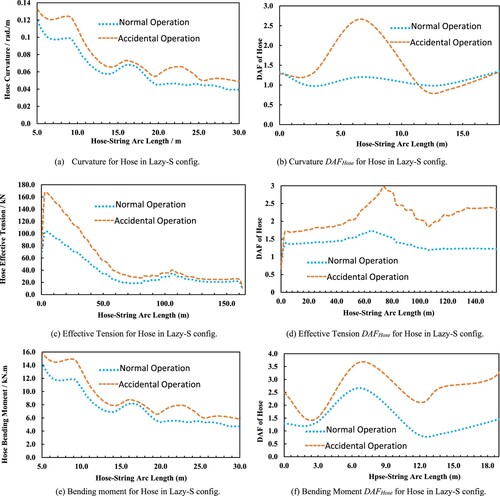
4.2.3. Submarine hose load response in Lazy-S configuration
The investigation on the disconnection-induced load on the submarine hoses in lazy-S configuration was investigated and the results are presented in . This was also investigated by considering the DAFhose, as proposed by Amaechi, Wang, Hou, et al. Citation2019. The hose curvature for the accidental operation has higher curvature than the normal operation in (a). It was also observed in (b) that the curvature DAFhose for the normal operation is also lower than that of the accidental operation. In a similar manner, the hose effective tension for the accidental operation has higher effective tension than the normal operation in (c). It was also observed in (d) that the effective tension DAFhose for the normal operation is also lower than that of the accidental operation. Also, the hose bending moment for the accidental operation has a higher bending moment than the normal operation in (c). It was also observed in (d) that the bending moment DAFhose for the accidental operation is also higher than that of the normal operation. As such, it is necessary that a good integrity check is carried out on the submarine hoses after any accidental operation, no matter the magnitude unless it is assessed to be within safe limits. In the profiles, the bending moment and the curvature have similar profiles under the lazy-S configuration but have different magnitudes (and units). However, this is different from the Chinese-lantern configuration in Section 4.2.2, where the bending moment and the curvature have inversely similar profiles and with different magnitudes and units. Although, it does not ascertain the configuration that is more affected by the disconnection-induced load effect, it indicates the presence of load response on the marine bonded hoses.
Figure 33. Effect of hydrodynamic loads on the submarine hose in Chinese-lantern config. (This figure is available in colour online.)
4.2.4. Wave load and flow angle analysis on bending moment
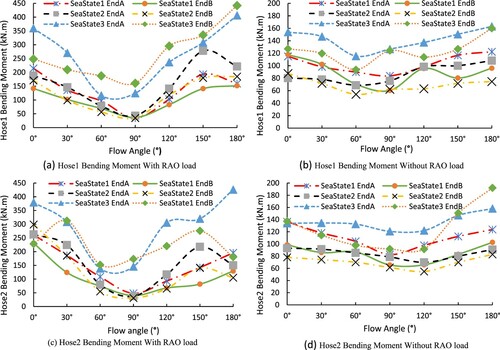
The effect of hydrodynamic loads was investigated for the submarine hoses under a water depth of 26 m, under Chinese-lantern configuration as it does not require much length in the investigation. The results presented in (a–d) show the details on the configuration, and the profiles for the bending moment at two ends – End A and End B. The maximum bending moment was recorded at the hose ends. Also, the curvature is within the limit as recommended in the industry standard by OCIMF (Citation2009). Thus, it shows that the designed submarine hose is fit for the designed application. As can be observed in , the curvature of the hose from the bending moment is within the design limit as specified in OCIMF (Citation2009). The hose curvature has been induced by the wave and current loads as well as other hydrodynamic loads. As recorded in , it can be observed that the SeaState3 reflected the highest bending moment magnitudes over the SeaState2 and SeaState1. This is due to the higher frequency of the SeaState3 and the significant wave height being of higher value than the others. A comparative study on the model by including RAOs as given in shows that the hydrodynamic load affects the performance of the marine bonded hoses. In addition, it was recorded that across the varying flow angles investigated, that the case of flow angle 180° was the highest. However, it is also relatively dependent on the RAO loads as seen too. Thus, the RAO loads and the wave angles are key parameters that influence the load response of the marine bonded hoses. As observed in the tabulated hose bending characteristics, it can be observed that the bending moment profiles shows that the hydrodynamic loads influence the motion behaviour of the submarine hoses. It is evidently clear too that the SeaState3 reflected the highest bending moment magnitudes over the SeaState2 and SeaState1. This is due to the higher frequency of the SeaState3 and the significant wave height being of higher value than the others. Based on the statistical analysis, the 90° flow angle gave the least deviation in bending moment in all the three sea states. This is due to the flow being in line with the wave direction. But for perpendicular flows in 0° and 180°, the bending moments have higher deviations. Thus, the study is highly indicative of high bending moment across the different flow angles investigated, especially along the hose arc lengths that have maximum curvatures. Thus, it is recommended to dampen the hose sections around those regions that recorded high bending moments, such as increasing the damping coefficients.
Figure 34. Curvature of submarine hose in Chinese-lantern configuration. (This figure is available in colour online.)
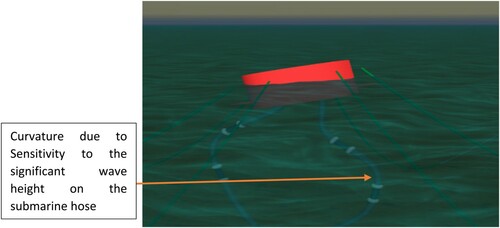
Figure 35. Influence of RAO load on bending moment of submarine hose in Chinese-lantern configuration. (This figure is available in colour online.)
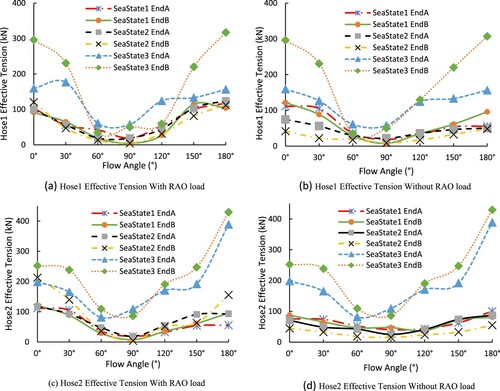
4.2.5. Wave load and flow angle analysis on effective tension
The effect of hydrodynamic loads was investigated for the submarine hoses under a water depth of 26m, under Chinese-lantern configuration as it does not require much length in the investigation. The results presented in (a–d) shows the details on the configuration, and the profiles for the effective tension at two ends – End A and End B. The maximum effective tensions were recorded at the hose ends. Also, the tension recorded is within the limit as recommended in the industry standard by OCIMF (Citation2009). Thus, it shows that the designed submarine hose is fit for the designed application. As can be observed in , the region of the hose-string that is most susceptible to high tension is close to the manifolds, as depicted. As recorded in , it was recorded that the SeaState3 reflected the highest bending moment magnitudes over the SeaState2 and SeaState1. This is due to the higher frequency of the SeaState3 and the significant wave height being of higher value than the others. Furthermore, it was recorded that across the varying flow angles investigated, that the case of flow angle 180° was the highest. However, it is also relatively dependent on the RAO loads as seen too. Thus, the RAO loads and the wave angles are key parameters that influence the load response of the marine bonded hoses. In conclusion, the effective tension plots in shows that the tension profiles reflect that the hydrodynamic loads have an effect on the submarine hoses. It is evidently clear too that the SeaState3 reflected the highest bending moment magnitudes over the SeaState2 and SeaState1. This is due to the higher frequency of the SeaState3 and the significant wave height being of higher value than the others. The hose tension has been induced by the wave and current loads as well as other hydrodynamic loads. In addition, when such happens, the hoses twist or experience some torsion which in turn induces high tension. In that light, the hoses begin to experience high fatigue from the induced loadings. Another scenario for the induced loadings is during the disconnection, where the disconnection-induced loads induce some fatigue on the marine hoses. In summary, the study is highly indicative of high tensions across the different flow angles investigated. Thus, it is recommended to reinforce those regions with reinforced ends to offset the high tensions recorded.
Figure 36. Tension region of submarine hose in Chines-lantern configuration. (This figure is available in colour online.)
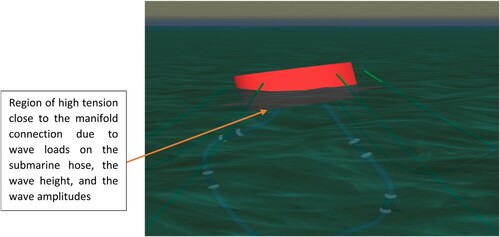
Figure 37. Influence of RAO load on effective tension of submarine hose in Chinese-lantern configuration. (This figure is available in colour online.)
4.3. Discussion
The investigation on the hydrodynamic analysis has shown the existence of disconnection-induced load response on the CALM buoy hose system and presented some comparative profiles for two different hoses- the floating hoses and the submarine hoses. It was observed that there is the presence of disconnection-induced loading from the comparative study between normal operation and accidental operation. There was also a comparison in the influence of the designs using Lazy-S and Chinese-lantern configurations on submarine hoses. It was also observed that there had different profiles that were inversely similar. Also, the magnitudes of the bending moment, curvature, and effective tensions were not the same. On the aspect of investigating the most affected configuration, it was concluded that further research on the fatigue study of the marine hoses is conducted. On the part of the statistical analysis on the submarine hoses and the buoy motion, there were good findings that suggest that the hoses were fit for use as they passed the recommendations of the industry standard (OCIMF Citation2009). In addition, the profiles presented on the wave loads and the flow angles showed that the hydrodynamic analysis on the marine bonded hoses had good correlations for the parameters investigated.
5. Conclusion
The hydrodynamic analysis on disconnection-induced load response of marine bonded hoses during normal operation and accidental operation under irregular waves has been presented in this paper. The study involves numerical investigation on the CALM buoy and the marine bonded hoses attached to it. Two hoses were applied in the model: the floating hoses and the submarine hoses. Some presentations made on the mathematical formulations include the wave theory, the BEM, hydrodynamics equations, catenary equations, and the equations on marine hoses and marine risers. Detailed numerical investigation on CALM buoys with submarine hoses in two configurations: Lazy-S and Chinese-lantern, were conducted. The hydrodynamic panel was developed in ANSYS AQWA and computed using diffraction theory and JONSWAP Wave Spectrum for the three (3) environmental conditions used (). The boundary conditions considered for the submarine hoses were attached on the PLEM and hose manifold underneath the CALM buoy. The RAOs calculated were then coupled into the Orcaflex FEM model developed based on Orcaflex Line theory. This proposed line theory uses the nodes on the hoses and mooring lines, but applies some discretization for the CALM buoy, to ensure less computational time and resources, and has been validated in an earlier study (Amaechi, Wang, Hou, et al. Citation2019).
The model highlights the following: firstly, novelty in disconnection-induced load response on marine bonded hoses under different ocean conditions and normal and accidental operations. Secondly, wave load and flow angle analysis on bending moment and effective tensions under irregular waves. Thirdly, a novelty in hydrodynamic studies on the hose disconnection studies for Lazy-S and Chinese-lantern configurations using water waves. Fourthly, the effect of different hose parameters hydrodynamic loads on hose profiles for bending moment, curvature, deflection, and effective tension on hose behaviour. Lastly, the effect of wave loads on buoy motion response from the diffraction analysis, and validation using statistical analysis. This study is important in enabling designers to design appropriately based on the hose behaviour, buoy geometry and environmental data.
The study presented a detailed investigation on the effect of disconnection-induced loads on the marine bonded hoses, and presented profiles for the normal operation and accidental operation for floating hoses and submarine hoses in Lazy-S, and for submarine hoses in Chinese-lantern configurations. It was observed that the accidental operation which was the case during disconnection of hose from the CALM buoy and the FPSO tanker showed good results as predicted. Thus, extra checks must be taken to ensure that the hoses have reliable marine breakaway couplings (MBCs) and hose end valves (HEVs). Also, it is recommended to reinforce the hoses towards ends that record very high tensions. On the buoy study, the motion was a function of the wave loads, such as in the surge RAO magnitudes. It would be recommended to have some floats around the buoy to reduce the vortex effect around it, and to reduce its damping or use strakes, and pneumatic fenders. However, further investigation using CFD is recommended. On the aspect of investigating the most affected configuration, it was concluded that further research on the fatigue study of the marine hoses is conducted. On the aspect of the statistical analysis on the submarine hoses and the buoy motion, the findings suggest that the hoses were fit for use as they passed the recommendations of the industry standard (OCIMF Citation2009). In addition, the profiles presented on the wave loads and the flow angles showed that the hydrodynamic analysis on the marine bonded hoses had good correlations for the parameters investigated. Further investigation on model tests in large scale can be conducted for the disconnection-induced load effect on a CALM buoy hose system. In addition, a detailed study on the motion response of the CALM buoy is recommended.
Acknowledgements
The author acknowledges the technical support from Lancaster University Engineering Department staff. Also, grateful to Dr. Abiodun K. Oyetunji of Lancaster University, Lancaster Environment Centre (LEC), UK, Dr. Ebube Charles Amaechi of University of Ilorin, Kwara State, Nigeria and Dr. Charles A. Odijie of MSCM Limited UK for reviewing an earlier version of this manuscript. The support team of the ANSYS and Orcaflex’s Orcina are appreciated for technical support. Lastly, the peer-review by the journal editor and the reviewers on this manuscript are immensely appreciated. Authors contribution: Conceptualization, C.V.A, J.Y; methodology, C.V.A., F.W., J.Y; software, C.V.A., F.W., J.Y; validation, C.V.A., F.W., J.Y; formal analysis, C.V.A., F.W., J.Y; investigation, C.V.A., F.W., J.Y; resources, C.V.A., J.Y; data curation, C.V.A., F.W., J.Y; writing—original draft preparation, C.V.A.; writing—review and editing, C.V.A., F.W., J.Y; visualization, C.V.A., F.W., J.Y; supervision, C.V.A., F.W., J.Y; project administration, C.V.A., F.W., J.Y; funding acquisition, C.V.A., F.W., J.Y.
Disclosure statement
No potential conflict of interest was reported by the author(s).
Data availability statement
The raw/processed data required to reproduce these findings cannot be shared at this time as the data also forms part of an ongoing study.
Additional information
Funding
References
- ABCNews. 2005. Accident prompts Navy to replace submarine hoses. Australian Broadcasting Corporation, p.1. [accessed 2021 December 22]. Available at: http://www.abc.net.au/news/2005-08-03/accident-prompts-navy-to-replace-submarine-hoses/2072338.
- ABS. 2021. Rules For Building And Classing - Single Point Moorings. New York: American Bureau of Shipping. [accessed 2021 September 21]. https://ww2.eagle.org/content/dam/eagle/rules-and-guides/current/offshore/8_rules-forbuildingandclassingsinglepointmoorings_2021/spm-rules-jan21.pdf.
- Ali M, Prasad R. 2019. Significant wave height forecasting via an extreme learning machine model integrated with improved complete ensemble empirical mode decomposition. Renew Sust Energ Rev. 104:281–295. DOI:10.1016/j.rser.2019.01.014.
- Amaechi CV, Wang F, Ye J. 2021a. Investigation on hydrodynamic characteristics, wave-current interaction, and sensitivity analysis of submarine hoses attached to a CALM buoy. J Mar Sci Eng., under review.
- Amaechi CV, Wang F, Ye J. 2021b. Numerical solutions on the motion response of a CALM buoy on understanding its fluid-structure interaction (FSI). Applied Mechanics, under review.
- Amaechi CV, Wang F, Ye J. 2021c. Experimental study on motion characterization of CALM buoy hose system under water waves. J Mar Sci Eng., under review.
- Amaechi CV, Wang F, Ye J. 2021d. An investigation on the vortex effect of a CALM buoy under water waves using Computational Fluid Dynamics (CFD). Inventions, under review.
- Amaechi CV, Wang F, Ja’e IA, Aboshio A, Odijie AC, Ye J. 2021e. A literature review on the technologies of bonded hoses for marine application. Ships Offsh Struct., under review.
- Amaechi CV, Ye J. 2021g. A review of state-of-the-art and meta-science analysis on composite risers for deep seas. Ocean Eng., under review.
- Amaechi CV. 2021h. Development of composite risers for offshore applications with review on design and mechanics. Ships Offsh Struct., under review.
- Amaechi CV. 2021i. Novel design, hydrodynamics and mechanics of marine hoses in oil/gas applications [PhD thesis]. Lancaster: Lancaster University, Engineering Department.
- Amaechi CV. 2021j. Single Point Mooring (SPM) hoses and Catenary Anchor Leg Mooring (CALM) buoys. [accessed 2021 September 1]. https://www.linkedin.com/pulse/single-point-mooring-spm-hoses-catenary-anchor-leg-calm-amaechi.
- Amaechi CV. 2021k. Experiment and finite element modelling on the load response of offshore bonded loading hoses during reeling operation, normal operation and non-operation conditions. Ocean Eng., under review.
- Amaechi CV, Chesterton C, Butler HO, Odijie CA, Gu Z, Wang F, Hou X, Ye J. 2021l. Finite element modelling on the mechanical behaviour of Marine Bonded Composite Hose (MBCH) under burst and collapse. J Mar Sci Eng., under review.
- Amaechi CV, Chesterton C, Butler HO, Wang F, Ye J. 2021a. An overview on bonded marine hoses for sustainable fluid transfer and (un)loading operations via floating offshore structures (FOS). J Mar Sci Eng. 9(11):1236. DOI:10.3390/jmse9111236.
- Amaechi CV, Chesterton C, Butler HO, Wang F, Ye J. 2021b. Review on the design and mechanics of bonded marine hoses for Catenary Anchor Leg Mooring (CALM) buoys. Ocean Eng J. 242:110062. DOI:10.1016/j.oceaneng.2021.110062.
- Amaechi CV, Gillet N, Hou X, Ye J. 2019. Composite risers for deep waters using a numerical modelling approach. Compos Struct. 210:486–499. DOI:10.1016/j.compstruct.2018.11.057.
- Amaechi CV, Gillett N, Odijie AC, Wang F, Hou X, Ye J. 2019. Local and global design of composite risers on truss SPAR platform in deep waters. Proceedings of 5th International Conference on Mechanics of Composites. Instituto Superior de Tecnico, Lisbon, Portugal, Jul 1–4; no. 20005, p. 1–3. [accessed 2021 December 22]. Available at: https://eprints.lancs.ac.uk/id/eprint/136431/4/Local_and_Global_analysis_of_Composite_Risers_MechComp2019_Conference_Victor.pdf.
- Amaechi CV, Odijie C, Etim O, Ye J. 2019. Economic aspects of fiber reinforced polymer composite recycling. Encycl Renew Sustain Mater. 2:377–397. DOI:10.1016/B978-0-12-803581-8.10738-6.
- Amaechi CV, Odijie C, Sotayo A, Wang F, Hou X, Ye J. 2019. Recycling of renewable composite materials in the offshore industry. Encycl Renew Sustain Mater. 2:583–613. DOI:10.1016/B978-0-12-803581-8.11445-6.
- Amaechi CV, Odijie CA, Wang F, Ye J. 2021. Numerical investigation on mooring line configurations of a Paired Column Semisubmersible for its global performance in deep water condition. Ocean Eng., under review.
- Amaechi CV, Wang F, Hou X, Ye J. 2019. Strength of submarine hoses in Chinese-lantern configuration from hydrodynamic loads on CALM buoy. Ocean Eng. 171:429–442. DOI:10.1016/j.oceaneng.2018.11.010.
- Amaechi CV, Wang F, Ye J. 2021a. Numerical assessment on the dynamic behaviour of submarine hoses attached to CALM buoy configured as lazy-S under water waves. J Mar Sci Eng. 9(10):1130. DOI:10.3390/jmse9101130.
- Amaechi CV, Wang F, Ye J. 2021b. Numerical studies on CALM buoy motion responses, and the effect of buoy geometry cum skirt dimensions with its hydrodynamic waves-current interactions. Ocean Eng., 244 (7): 110378. DOI:10.1016/j.oceaneng.2021.110378.
- Amaechi CV, Wang F, Ye J. 2021c. Mathematical modelling of bonded marine hoses for single point mooring (SPM) systems, with Catenary Anchor Leg Mooring (CALM) buoy application: A review. J Mar Sci Eng. 9(11):1179. DOI:10.3390/jmse9111179.
- Amaechi CV, Wang F, Ye J. 2021d. Parametric investigation on tensioner stroke analysis, recoil analysis and disconnect for the marine drilling riser of a Paired Column Semisubmersible under deep water waves. Ocean Eng., under review.
- Amaechi CV, Wang F, Ye J. 2021e. Dynamic analysis of tensioner model applied on global response of marine riser recoil and disconnect. Ocean Eng., under review.
- Amaechi CV, Wang F, Ye J. 2021f. Effect of marine riser integration for characteristic motion response studies on a Paired Column Semisubmersible in deep waters. Mar Struct., under review.
- Amaechi CV, Ye J. 2017. A numerical modeling approach to composite risers for deep waters. International Conference on Composite Structures (ICCS20) Proceedings; Paris, France: Societa Editrice Esculapo.
- Amaechi CV., Ye J 2021f. Local tailored design of deep water composite risers subjected to burst, collapse and tension loads. Ocean Eng. DOI:10.1016/j.oceaneng.2021.110196.
- Amaechi CV, Ye J, Hou X, Wang F-C. 2019. Sensitivity studies on Offshore submarine hoses on CALM buoy with comparisons for Chinese-lantern and lazy-S configuration OMAE2019-96755. 38th International Conference on Ocean, Offshore and Arctic Engineering; Jun 9–14; Glasgow, Scotland.
- ANSYS. 2017a. ANSYS aqwa theory manual, release 18.2. Canonsburg: ANSYS Inc.
- ANSYS. 2017b. ANSYS aqwa user’s manual, release 18.2. Canonsburg: ANSYS Inc.
- API. 2005. API RP 2SK- design and analysis of stationkeeping systems for floating structures, 3rd ed. Washington, DC: American Petroleum Institute (API).
- API. 2017. API 17K- Specification for bonded flexible pipe, 3rd ed. Washington, DC: American Petroleum Institute (API).
- Bai Y, Bai Q. 2005. Subsea pipelines and risers, 1st ed. Oxford: Elsevier.
- Berteaux HO. 1976. Buoy engineering, 1st ed. New York: John Wiley and Sons.
- Bhatta DD. 2007. Computation of added mass and damping coefficients due to a heaving cylinder. J Appl Math Comput. 23(1–2):127–140. DOI:10.1007/BF02831963.
- Bhatta DD, Rahman M. 1995. Wave loadings on a vertical cylinder due to heave motion. Int J Math Math Sci. 18(1):151–170. DOI:10.1155/S0161171295000202.
- Bhatta DD, Rahman M. 2003. On scattering and radiation problem for a cylinder in water of finite depth. Int J Eng Sci. 41:931–967. DOI:10.1016/S0020-7225(02)00381-6.
- Bhosale D. 2017. Mooring analysis of a Paired Column semisubmersible [BEng dissertation]. Lancaster: Lancaster University, Engineering Department.
- Bishop RED, Johnson DC. 2011. The mechanics of vibration. 1960 Reprint. London: Cambridge University Press.
- Bluewater. 2009. Buoyed up: the future of tanker loading/offloading operations. Amsterdam: Bluewater Energy Services. [Accessed 2021 July 12]. https://www.bluewater.com/wp-content/uploads/2013/04/CALM-Buoy-brochure-English.pd.
- Bluewater. 2011. Bluewater Turret buoy- technical description. Amsterdam: Bluewater Energy Services. [Accessed 2021 July 12]. https://www.bluewater.com/wp-content/uploads/2013/04/digitale-brochure-TurretBouy-Tech-description.pdf.
- Brady I, Williams S, Golby P. 1974. A study of the forces acting on hoses at a monobuoy Due to environmental conditions. Offshore Technology Conference Proceeding -OTC 2136; May 5–7, 1974, Dallas, Texas, USA: OnePetro. p. 1–10. DOI:10.4043/2136-MS.
- Brown MJ. 1985a. Mathematical model of a marine hose-string at a buoy—part 1—static problem. In: Dyke P., Moscardini A.O., Robson E.H., editor. Offshore and Coastal modelling. London: Springer; p. 251–277. DOI:10.1007/978-1-4684-8001-6_14.
- Brown MJ. 1985b. Mathematical model of a marine hose-string at a buoy—part 2—dynamic problem. In: Dyke P., Moscardini A.O., Robson E.H., editor. Offshore and Coastal modelling. London: Springer; p. 279–301. DOI:10.1007/978-1-4684-8001-6_13.
- Brown MJ, Elliott L. 1987. A design tool for static underbuoy hose-systems. Appl Ocean Res. 9(3):171–180. DOI:10.1016/0141-1187(87)90021-6.
- Brown MJ, Elliott L. 1988. Two-dimensional dynamic analysis of a floating hose string. Appl Ocean Res. 10:20–34. DOI:10.1016/S0141-1187(88)80021-X.
- Chakrabarti SK. 1972. Nonlinear wave forces on vertical cylinder. J Hydraul Div. 98(11):1895–1909. DOI:10.1061/JYCEAJ.0003468.
- Chakrabarti SK. 1975. Second-order wave force on large vertical cylinders. Journal of waterways, harbors and coastal engineering division, ASCE, Vol. 101, No. WW3, Proceedings Paper 11476, Aug. 1975, p. 311–317. DOI:10.1061/AWHCAR.0000287.
- Chakrabarti SK. 2001. Hydrodynamics of offshore structures reprint. Southampton: WIT Press.
- Chakrabarti SK. 2005. Handbook of offshore engineering - Volume 1. Oxford: Elsevier.
- Chandrasekaran S. 2015. Dynamic analysis and design of offshore structures. 1st ed. Springer.
- Chau FP, Taylor TR. 1992. Second-order wave diffraction by a vertical cylinder. J Fluid Mech. 240:571–599. DOI:10.1017/S0022112092000211.
- Continental. 2020. Continental Marine Hose Brochure. Grimsby: Dunlop Oil & Marine, Continental Contitech Oil & Gas. [Accessed 2021 November 17] https://aosoffshore.com/wp-content/uploads/2020/02/ContiTech_Marine-Brochure.pdf.
- Cozijn H, Uittenbogaard R, Brake ET. 2005. Heave, roll and pitch damping of a deepwater CALM buoy with a skirt. International Society of Offshore and Polar Engineering Conference Proceedings; Seoul, Korea (ISOPE), June 19-24, 2005, Seoul, Korea; p. 388–395. [accessed 2021 December 22]. Available at: https://www.researchgate.net/publication/267364857_Heave_Roll_and_Pitch_Damping_of_a_Deepwater_CALM_Buoy_with_a_Skirt.
- Cozijn JL, Bunnik THJ. 2004. Coupled mooring analysis for a deep water CALM buoy. Proceedings of the ASME 2004 23rd International Conference on Offshore Mechanics and Arctic Engineering. 23rd International Conference on Offshore Mechanics and Arctic Engineering, Volume 1, Parts A and B. Vancouver, British Columbia, Canada. June 20–25, 2004. pp. 663-673. ASME. https://doi.org/10.1115/OMAE2004-51370.
- Dareing DW. 2012. Mechanics of drillstrings and marine risers. New York: ASME Press. DOI:10.1115/1.859995.
- Dareing DW. 2019. Oilwell drilling engineering. New York: ASME Press. DOI:10.1115/1.861875.
- DNVGL. 2015a. DNVGL-OS-E403 Offshore loading buoys. Oslo: Det Norske Veritas & Germanischer Lloyd. [Accessed 2021 October 12]. https://rules.dnv.com/docs/pdf/DNV/os/2015-07/DNVGL-OS-E403.pdf.
- DNVGL. 2015b. DNVGL-OS-E403 position mooring, Oslo: Det Norske Veritas & Germanischer Lloyd. [Accessed 2021 October 12]. https://rules.dnv.com/docs/pdf/DNV/os/2015-07/DNVGL-OS-E301.pdf.
- DNVGL. 2016. DNVGL-OS-E403 Offshore loading units. Oslo: Det Norske Veritas & Germanischer Lloyd. [Accessed 2021 October 12]. https://rules.dnv.com/docs/pdf/DNV/OS/2016-04/DNVGL-OS-E403.pdf.
- DNVGL. 2017. DNVGL-RP-F205 global performance analysis of deepwater floating structures. Oslo: Det Norske Veritas & Germanischer Lloyd.
- Doyle S, Aggidis G. 2019. Development of multi-oscillating water columns as wave energy converters. Renew Sust Energ Rev. 107:75–86. DOI:10.1016/j.rser.2019.02.021.
- Doyle S, Aggidis GA. 2021. Experimental investigation and performance comparison of a 1 single OWC, array and M-OWC. Renew Energ. 168:365–374. DOI:10.1016/j.renene.2020.12.032.
- Duggal A, Ryu S. 2005. The dynamics of deepwater offloading buoys. In: WIT transactions on the built environment, Vol. 84, pp. 1-10. Singapore: WIT Press. DOI:10.2495/FSI050261. Available at: https://www.witpress.com/elibrary/wit-transactions-on-the-built-environment/84/15733.
- Edward C, Kr. Dev DA. 2021. Assessment of CALM buoys motion response and dominant OPB/IPB inducing parameters on fatigue failure of Offshore Mooring chains. In: Okada T., Suzuki K., Kawamura Y, editor. Practical design of ships and other floating structures. PRADS 2019. Lecture notes in civil engineering. Vol. 64. Singapore: Springer. DOI:10.1007/978-981-15-4672-3_35.
- EMSTEC. 2016. EMSTEC loading & discharge hoses for offshore moorings. Rosengarten: EMSTEC. [accessed 2021 September 29]. https://denialink.eu/pdf/emstec.pdf.
- Eshiet KII. 2012. Modelling of hydraulic fracturing and its engineering application [PhD thesis]. Leeds: School of Civil Engineering, University of Leeds.
- Esmailzadeh E, Goodarzi A. 2001. Stability analysis of a CALM floating offshore structure. Int J Non-Linear Mech. 36(6):917–926. DOI:10.1016/S0020-7462(00)00055-X.
- Faltisen OM, Newman JN, Vinje T. 1995. Nonlinear wave loads on a slender vertical cylinder. J Fluid Mech. 289:179–198. DOI:10.1017/S0022112095001297.
- Feng X, Taylor PH, Dai S, Day AH, Willden RHJ, Adcock TAA. 2020. Experimental investigation of higher harmonic wave loads and moments on a vertical cylinder by a phase-manipulation method. Coastal Eng. 160:103747. DOI:10.1016/j.coastaleng.2020.103747.
- GallThomson. 2018. Petal valve marine breakaway couplings. [accessed 2021 May 16]. https://www.yumpu.com/en/document/read/51474544/gall-thomson-petal-valve-sunflex.
- Gao N, Yang J, Zhao W, Li X. 2015. Numerical simulation of deterministic freak wave sequences and wave-structure interaction. Ships Offsh Struct. 11(8):802–817. DOI:10.1080/17445302.2015.1073864.
- Gao P, Gao Q, An C, Zeng J. 2021. Analytical modeling for offshore composite rubber hose with spiral stiffeners under internal pressure. J Reinf Plast Compos. 40(9-10):352–364. DOI:10.1177/0731684420962577.
- Gao Q, Duan M, Yang X, Shi W, Zhao D, An C, Li Z, 2017. Analysis of multi-layered fiber-wound offshore rubber hose under internal pressure. Proceedings of International Conference on Composite Structures, ICCS17 Conference, Paris, France.
- Gao Q, Li ZL, Zhao DW, Duan M, 2016. Structural behavior of offshore bonded rubber hose under torsion. In: Menglan Duan, Youngsoon Yang, editors. Proceedings of SUTTC 2016 on subsea engineering. Beijing; p. 246–257.
- Gao Q, Zhang P, Duan M, Yang X, Shi W, An C, Li Z. 2018. Investigation on structural behavior of ring-stiffened composite offshore T rubber hose under internal pressure. Appl Ocean Res. 79(1):7–19. DOI:10.1016/j.apor.2018.07.007.
- Gao YY, Yu DY, Li CL, Xu DL. 2010. Calculation of significant wave height using the linear mean square estimation method. J Ocean Univ China. 9(4):327–332. DOI:10.1007/s11802-010-1753-6.
- Garrison CJ. 1974. Hydrodynamics of large objects in the sen; part i: hydrodynamic analysis. J Hydronaut. 8:5–12. DOI:10.2514/3.62970.
- Garrison CJ. 1975. Hydrodynamics of large objects in the sea; part II: motion of freefloating bodies. J Hydronaut. 9(2):58–63. DOI:10.2514/3.63020.
- Garrison CJ. 1979. The consistent second-order theory of wave / structure interaction. Report Number FEDDOCS D 208.14/2: NPS-69-79-010. Naval Postgraduate School, Research Reports Division, Monterey, California, USA. P. 1–42. [assessed 2021 May 16] https://core.ac.uk/download/pdf/36722593.pdf.
- Garrison CJ. 1984. Nonlinear wave loads on large structures. Proceeding Third International Offshore Mechanics and Arctic Engineering Symposium. ASME, Vol. 1, pp. 128-135.
- Gu H, Stansby P, Stallard T, Moreno EC. 2018. Drag, added mass and radiation damping of oscillating vertical cylindrical bodies in heave and surge in still water. J Fluids Struct. 82:343–356. DOI:10.1016/j.jfluidstructs.2018.06.012.
- Guo B, Song S, Chacko J, Ghalambor A, 2005. Offshore pipelines. Oxford, UK: Elsevier Publishers (Gulf Professional Publishing Imprint). https://doi.org/10.1016/B978-0-7506-7847-6.X5052-5.
- Hai-tao Z, Bin T, Guang-wei L, Yi-zhu L. 2003. An experimental study of first-harmonic wave force on vertical truncated cylinder. China Offshore Platform. 18(4):12–17. in Chinese.
- Hasanvand E, Edalat P. 2020. Sensitivity analysis of the dynamic response of CALM oil terminal, in the Persian Gulf region under different operation parameters. Int J Mar Eng. 16(32):73–84. DOI:10.29252/marineeng.16.32.73. https://marine-eng.ir/article-1-794-en.pdf.
- Hasanvand E, Edalat P. 2021. A comparison of the dynamic response of a product transfer system in CALM and SALM oil terminals in operational and non-operational modes in the Persian Gulf region. Int J Coastal Offshore Eng. 5(1):1–14. http://ijcoe.org/article-1-232-en.html.
- Hasselmann K, Barnett TP, Bouws E, Carlson H, Cartwright DE, Enke K, Ewing JA, Gienapp H, Hasselmann DE, Kruseman, et al. 1973. Measurements of wind-wave growth and swell decay during the joint north sea wave project (JONSWAP). Dtsch Hydrogr Zeitschrift A. 12(80). Available at: http://resolver.tudelft.nl/uuid:f204e188-13b9-49d8-a6dc-4fb7c20562fc (Assessed on: 16th May, 2021).
- Hirdaris SE, Bai W, Dessì D, Ergin A, Gu X, Hermundstad OA, Huijsmans RH, Iijima K, Nielsen UD, Parunov J, Fonseca N, Papanikolaou AD, Argyriadis K, Incecik A. 2014. Loads for use in the design of ships and offshore structures. Ocean Eng. 78:131–174. DOI: 10.1016/j.oceaneng.2013.09.012.
- Huang JB, Taylor RE. 1996. Semi-analytical solution for second-order wave diffraction by a truncated circular cylinder in monochromatic waves. J Fluid Mech. 319:171–196. DOI:10.1017/S0022112096007306.
- Huseby M, Grue J. 2000. An experimental investigation of higher-harmonic wave forces on a vertical cylinder. J Fluid Mech. 414:75–103. DOI:10.1017/S0022112000008533.
- Irvine HM. 1981. Cable structures. MIT Press.
- Isaacson M. 1977. Nonlinear wave forces on large offshore structures. J Waterw Harb Coast Eng Div. 103(1):166–170. [accessed 2021 July 12]. https://cedb.asce.org/CEDBsearch/record.jsp?dockey=0005068.
- Isaacson M. 1979. Wave forces on compound cylinders. Proceedings of Civil Engineering in the Oceans IV. ASCE, San Francisco, pp. 518–530.
- Jacobsen LS. 1949. Impulsive hydrodynamics of fluid inside a cylindrical tank and of fluid surrounding a cylindrical pier. Bulletin of the Seismological Society of America. 39(3):189–204. DOI:10.1785/BSSA0390030189.
- Jean P, Goessens K, Hostis D. 2005. Failure of chains by bending on Deepwater mooring systems. OTC-17238-MS. paper presented at the Offshore Technology conference. Houston, Texas, USA. May 2–5, 2005. DOI:10.4043/17238-MS.
- Jiang C, Moctar O, Schellin TE, Paredes GM. 2020. Comparative study of mathematical models for mooring systems coupled with CFD. Ships Offsh Struct. 16(9):942–954. DOI:10.1080/17445302.2020.1790294.
- Kannah TR, Natarajan R. 2006. Experimental investigation of an external turret-moored FPSO system by VALM arrangement. Ships Offsh Struct. 1(3):199–212. DOI:10.1533/saos.2006.0128.
- Konovessis D, Chua KH, Vassalos D. 2013. Stability of floating offshore structures. Ships Offsh Struct. 9(2):125–133. DOI:10.1080/17445302.2012.747270.
- Lassen T, Lem AI, Imingen G. 2014. Load response and finite element modelling of bonded offshore loading hoses. Proceedings of the ASME 2014 33rd International Conference on Ocean, Offshore and Arctic Engineering; Jun 8–13, San Francisco, California, USA, Paper OMAE2014-23545. V06AT04A034. ASME. DOI:10.1115/OMAE2014-23545.
- Le Cunff C, Ryu S, Duggal A, Ricbourg C, Heurtier J-M, Heyl C, Liu Y, Beauclair O. 2007. Derivation of CALM Buoy coupled motion RAOs in frequency domain and experimental validation. Paper presented at The Seventeenth International Offshore and Polar Engineering Conference, Lisbon, Portugal, July 2007. p. 1–8. [accessed 2021 October 12] https://www.sofec.com/wp-content/uploads/white_papers/2007-ISOPE-Derivation-of-CALM-Buoy-Coupled-Motion-RAOsin-Frequency-Domain.pdf.
- Le Cunff C, Ryu S, Heurtier J, Duggal AS. 2008. Frequency-domain calculations of moored vessel motion including low frequency effect. Proceedings of the ASME 2008 27th International Conference on Offshore Mechanics and Arctic Engineering. Vol. 1: Offshore Technology. Estoril, Portugal. June 15–20, 2008. p. 689–696. ASME. [accessed 2021 October 12] https://www.sofec.com/wp-content/uploads/white_papers/2008-OMAE-57632-Low-Frequency-Domain-Calculations-of-Moored-Vessel-Motion-including-LF-Effect.pdf.
- Li AJ, Liu Y. 2019. New analytical solutions to water wave diffraction by vertical truncated cylinders. Int J Naval Archit Ocean Eng. 11:952–969. DOI:10.1016/j.ijnaoe.2019.04.006.
- Li SC, Liu HL, Li LP, Zhang QQ, Wang K, Wang K. 2016. Large scale three-dimensional seepage analysis model test and numerical simulation research on undersea tunnel. Appl Ocean Res. 59:510–520. DOI:10.1016/j.apor.2016.07.013.
- Lighthill J. 1979. Waves and hydrodynamic loading. Proceedings of Second Internnational Conference on Behaviour of Offshore structures; Vol. 1, pp. 1–40.
- Liu J, Guo A, Li H. 2016. Analytical solution for the linear wave diffraction by a uniform vertical cylinder with an arbitrary smooth cross-section. Ocean Eng. 126:163–175. DOI:10.1016/j.oceaneng.2016.09.010.
- MacCarny RC, Fuchs RA. 1954. Wave forces on piles: a diffraction theory. U.S. Army Corps of Engineers, Beach Erosion Board, Technical Memo, No. 69. [accessed 2021 May 16]. https://erdc-library.erdc.dren.mil/jspui/bitstream/11681/3444/1/BEB-TM-69.pdf.
- Mahjoobi J, Etemad-Shahidi A, Kazeminezhad MH. 2008. Hindcasting of wave parameters using different soft computing methods. Appl Ocean Res. 30(1):28–36. DOI:10.1016/j.apor.2008.03.002.
- Malenica S, Molin B. 1995. Third-harmonic wave diffraction by a vertical cylinder. J Fluid Mech. 302:203–229. DOI:10.1017/S0022112095004071.
- MarineBreakawayCouplings. 2018. The effectiveness of marine breakaway couplings in minimising risk to FPSO transfer operations: from the perspective of reeled or in-air catenary reeled configurations. Marine Breakaway Couplings White Paper. [accessed 2021 May 16]. https://www.marinebreakawaycouplings.com/wp-content/uploads/2019/01/FPSO-MBC-on-reel-whitepaper-marinebreakawaycouplings-August-2018.pdf.
- Mavrakos SA, Grigoropoulos GJ. 1994. Numerical and experimental investigation of the exciting wave loads on a vertical truncated cylinder. Transactions on Ecology and the Environment Vol. 8. WIT Press. [accessed 2021 Jul 12]. https://www.witpress.com/Secure/elibrary/papers/HY94/HY94014FU2.pdf.
- Mei CC. 1978. Numerical methods in water wave diffraction and radiation. Ann Rev Fluid Mech. 10:393–416. DOI:10.1146/annurev.fl.10.010178.002141.
- Milgram JH, Halkyard JE. 1971. Wave forces on large objects in the sea. J Ship Res. 15(2):115–124. DOI:10.5957/jsr.1971.15.2.115.
- Molin B. 1979. Second order diffraction loads upon three dimensional bodies. Appl Ocean Res. 1:197–202. DOI:10.1016/0141-1187(79)90027-0
- Moon BY, Kim SY, Kang GJ. 2008. Initial ship design using a Pearson correlation coefficient and artificial intelligence techniques. Int J Mod Phys B. 22:1801–1806. DOI:10.1142/S0217979208047444.
- Morison JR, Johnson JW, Schaaf SA, 1950. The force exerted by surface waves on piles. Petrol Trans AIME. 189:149–154. DOI:10.1016/0141-1187(79)90027-0.
- MSF. 2013. Guidelines for offshore marine operations (GOMO). London: Marine Safety Forum (MSF). [accessed 2021 Jul 12]. http://www.g-omo.info/wp-content/uploads/2016/06/201311-GOMOfinal.pdf.
- Nallayarasu S, Senthil Kumar N. 2017. Experimental and numerical investigation on hydrodynamic response of buoy form Spar under random waves. Ships Offsh Struct. 12(5):734–746. DOI:10.1080/17445302.2016.1218600.
- Newman JN. 1963. The exciting forces on fixed bodies in waves. Report No 171, David Taylor Model A Basin, Hydrodynamics Laboratory, Washington, DC.
- Newman JN. 1967. The drift force and moment of ships in waves. J Ship Res. 11(01):51–60. DOI:10.5957/jsr.1967.11.1.51.
- Newman JN. 1996. The second-order wave force on a vertical cylinder. J Fluid Mech. 320:417–443. DOI:10.1017/S0022112096007598.
- OCIMF. 2009. Guide to manufacturing and purchasing hoses for offshore moorings (GMPHOM). Livingstone: Witherby Seamanship International Ltd.
- Odijie AC. 2016. Design of Paired Column Semisubmersible hull [Ph.D. thesis]. Lancaster: Lancaster University, Engineering Department. [accessed 2021 June 14]. Available at: https://eprints.lancs.ac.uk/id/eprint/86961/1/2016AgbomeriePhD.pdf.
- Odijie AC, Quayle S, Ye J. 2017. Wave induced stress profile on a paired column semisubmersible hull formation for column reinforcement. Eng Struct. 143:77–90. DOI:10.1016/j.engstruct.2017.04.013.
- Odijie AC, Wang F, Ye J. 2017. A review of floating semisubmersible hull systems: column stabilized unit. Ocean Eng. 144:191–202. DOI:10.1016/j.oceaneng.2017.08.020.
- Odijie AC, Ye J. 2015a. Effect of vortex induced vibration on a paired-column semisubmersible platform. Int J Struct Stab Dyn. 15(8):1540019. DOI:10.1142/S0219455415400192.
- Odijie AC, Ye J. 2015b. Understanding Fluid-Structure interaction for high amplitude wave loadings on a deep-draft paired column semi-submersible platform: a finite element approach. Proceedings of the 4th International Conference on light weight design of marine structures; 9–11 November;. Glasgow, UK.
- O’Donoghue T, Halliwell AR. 1990. Vertical bending moments and axial forces in a floating marine hose-string. Eng Struct. 12(4):124–133. DOI:10.1016/0141-0296(90)90018-N.
- Orcina. 2014. Orcaflex manual, Version 9.8a. Ulverton, Cumbria: Orcina Ltd. [accessed 2021 May 16]. https://www.orcina.com/SoftwareProducts/OrcaFlex/Documentation/index.php.
- Orcina. 2020. Vessel theory: RAOs and phases. [accessed 2020 Dec 15]. https://www.orcina.com/webhelp/OrcaFlex10.3d/Content/html/VesseltheoryRAOsandphases.htm.
- Orcina. 2021. Orcaflex Documentation, Version 11.0f. [accessed 2021 May 4]. https://www.orcina.com/webhelp/OrcaFlex/Default.htm.
- O’Sullivan M. 2002. West of Africa CALM Buoy Offloading Systems. MCS Kenny Offshore Article. [accessed 2019 Jun 16]. http://www.mcskenny.com/downloads/Software - Offshore Article.pdf.
- O’Sullivan M. 2003. Predicting interactive effects of CALM buoys with deepwater offloading systems. Offshore Mag. 63(1):66–68. [accessed 2021 May 16]. https://www.offshore-mag.com/production/article/16755731/predicting-interactive-effects-of-calm-buoys-with-deepwater-offloading-systems.
- Palmer AC, King RA. 2008. Subsea pipeline engineering. 2nd ed. Oklahoma: PennWell Corporation.
- Pecher A, Foglia A, Kofoed JP. 2014. Comparison and sensitivity investigations of a CALM and SALM type mooring system for wave energy converters. J Marine Sci Eng. 2(1):93–122. DOI:10.3390/jmse2010093.
- Pham D, Sridhar N, Qian X, Sobey A, Achintha M, Shenoi A. 2016. A review on design, manufacture and mechanics of composite risers. Ocean Eng. 112:82–96. DOI:10.1016/j.oceaneng.2015.12.004.
- Pierson WJ, Jr, Moskowitz, LA. 1964. Proposed spectral form for fully developed wind seas based on the similarity theory of S. A. Kitaigorodskii. J Geophys Res. 69:5181–5190. DOI:10.1029/JZ069i024p05181.
- Poguluri SK, Cho IH. 2020. Analytical and numerical study of wave interaction with a vertical slotted barrier. Ships Offsh Struct. 16(9):1012–1024. DOI:10.1080/17445302.2020.1790299.
- Rahman M. 1984. Wave diffraction by large offshore structures: An exact second-order theory. Appl Ocean Res. 6:90–100. DOi:10.1016/0141-1187(84)90046-4.
- Rahman M. 1997. Nonlinear hydrodynamic loading on offshore structures. J. Theor Comput Fluid Dyn. 10(1):323–347. In: Advances in Fluid Mechanics III, C.A. Brebbia & M. Rahman (Editors). [accessed 2021 December 22]. https://www.witpress.com/Secure/elibrary/papers/AFM00/AFM00022FU.pdf
- Raman H, Venkatanarasaiah P. 1976. Forces due to nonlinear waves on vertical cylinders. J Waterw Port Coast Ocean Eng, Proc. ASCE 102(WW3). DOI:10.1061/AWHCAR.0000331.
- Raman H, Jothishankar N, Venkatanarasaiah P. 1977. Nonlinear wave interaction with vertical cylinder of large diameter. J Ship Res. 21(2):120–124. DOI:10.5957/jsr.1977.21.2.120.
- Ricbourg C, Berhault C, Camhi A, Lécuyer B, Marcer R, 2006. Numerical and experimental investigations on deepwater CALM buoys hydrodynamics loads. Offshore Technology Conference Proceeding (OTC) 18254; Houston, Texas, USA, OnePetro, p. 1–8. DOI:10.4043/18254-MS.
- Roveri FE, Volnei LSS, & Cicilia FB. 2002. A Case Study on the Evaluation of Floating Hose Forces in a C.A.L.M. System. In Internation Offshore and Polar Engineering Conference; Kitakyushu, Japan, May; ISOPE, Paper Number: ISOPE-I-02-030, p. 190–197. [accessed 2021 May 16]. https://onepetro.org/ISOPEIOPEC/proceedings-abstract/ISOPE02/All-ISOPE02/ISOPE-I-02-030/8329.
- Ryu S, Duggal AS, Heyl CN, Liu Y, 2006. Prediction of Deepwater Oil offloading buoy response and experimental validation. Int J Offshore Polar Eng. 16(3):1–7. [accessed 2021 May 16]. https://www.sofec.com/wp-content/uploads/white_papers/2006-ISOPE-Prediction-of-DW-Oil-Offloading-Buoy-Response.pdf .
- Sabuncu T, Calisal S. 1981. Hydrodynamic coefficients for vertical circular -cylinders at finite depth. Ocean Eng. 8:25–63. DOI:10.1016/0029-8018(81)90004-4.
- Sagrilo LVS, Siqueira MQ, Ellwanger GB, Lima ECP, Ferreira MDAS, Mourelle MM. 2002. A coupled approach for dynamic analysis of CALM systems. Appl Ocean Res. 24(1):47–58. DOI:10.1016/S0141-1187(02)00008-1.
- Sarpkaya T. 2014. Wave forces on offshore structures, 1st ed. New York: Cambridge University Press.
- Sparks CP. 2007. Fundamentals of Marine Riser Mechanics: basic principles and simplified analyses. 1st ed. Oklahoma, USA: PennWell Books.
- Sparks CP. 2018. Fundamentals of Marine Riser Mechanics: basic principles and simplified analyses. 2nd ed. Oklahoma, USA: PennWell Books.
- TechFlowMarine. 2021. Marine Coupling Systems. [accessed 2021 May 16]. http://www.techflowmarine.com/products/marine-coupling-system/ Retrieved on: 16th May, 2021.
- Toh W, Tan LB, Jaiman RK, Tay TE, Tan VBC. 2018. A comprehensive study on composite risers: material solution, local end fitting design and local design. Marine Struct. 61(2018):155–169. DOI:10.1016/j.marstruc.2018.05.005.
- Tonatto ML, Forte MMC, Amico SC. 2017. Compressive-tensile fatigue behavior of cords/rubber composites. Polym Test. 61:185–190. DOI:10.1016/j.polymertesting.2017.05.024.
- Tonatto ML, Forte MMC, Tita V, Amico SC. 2016. Progressive damage modeling of spiral and ring composite structures for offloading hoses. Mater Des. 108:374–382. DOI:10.1016/j.matdes.2016.06.124.
- Tonatto ML, Tita V, Amico SC. 2020. Composite spirals and rings under flexural loading: experimental and numerical analysis. J Compos Mater. 54(20):2697–2705. DOI:10.1177/0021998320902504.
- Tonatto ML, Tita V, Araujo RT, Forte MMC, Amico SC. 2017. Parametric analysis of an offloading hose under internal pressure via computational modelling. Marine Struct. 51:174–187. DOI:10.1016/j.marstruc.2016.10.008.
- Tonatto ML, Tita V, Forte MMC, Amico SC. 2018. Multi-scale analyses of a floating marine hose with hybrid polyaramid/polyamide reinforcement cords. Marine Struct. 60:279–292. DOI:10.1016/j.marstruc.2018.04.005.
- Tonatto MLP, Roese PB, Tita V, et al. 2019. Offloading marine hoses: computational and experimental. In: Pemberton R, Summerscales J, Graham-Jones J, editors. analyses. In: Marine Composites: Design and Performance. Cambridge, UK: Elsevier Publisher (Woodhead Publishing imprint); p. 389–416. DOI:10.1016/B978-0-08-102264-1.00014-5.
- Trelleborg. 2016. Hose assembly Handling guide. Trelleborg Fluid Handling Solutionsn p. 1–5. Clemont-Ferrand: Trelleborg. [accessed 2021 November 23]. https://www.trelleborg.com/fluidhandling/-/media/fluid-handlingsolutions/guidelines/gb/gb_guide_handling_trelleborg.pdf.
- Trelleborg. 2018. Oil & gas solutions: oil & gas hoses for enhanced fluid transfer solutions. In: Trelleborg fluid handling solutions. Oil & marine hoses: innovation and safety for oil & gas transfer systems. Clemont-Ferrand: Trelleborg; Vol. 1, p. 1–30.
- Venugopal V, Varyani KS, Westlake PC. 2008. Proceedings of the institution of Mechanical engineers, part M. J Eng Maritime Environ. 223(1):121–136. DOI:10.1243/14750902JEME124.
- Vugts JH. 1968. The hydrodynamic coefficients for swaying, heaving and rolling cylinders in a free surface. Report 112 S; 194-P/TNO, Netherlands Ship Research Centre TNO, Shipbuilding Laboratory, Delft Technological University, Netherlands. [accessed 2021 November 23]. http://resolver.tudelft.nl/uuid:5c647df4-3f70-4451-8895-13d1f08bf769.
- Wang D, Sun S. 2013. An analystical solution of wave exciting loads on CALM buoy with skirt. Appl Mech Mater. 477-478:254–258. DOI:10.4028/www.scientific.net/AMM.477-478.254.
- Wang D, Sun S. 2015. Study of the radiation problem for a CALM buoy with skirt. Ship Building China. 56(1):95–101.
- Wang F, Chen J, Gao S, Tang K, Meng X. 2017. Development and sea trial of real-time offshore pipeline installation monitoring system. Ocean Eng. 146:468–476. DOI:10.1016/j.oceaneng.2017.09.016.
- Wang LP, Chen BY, Chen C, Chen ZS, Liu GL. 2016. Application of linear mean-square estimation in ocean engineering. China Ocean Eng. 30:149–160. DOI:10.1007/s13344-016-0007-9.
- Wichers IJ. 2013. Guide to single point moorings. Houston, TX: WMooring Inc. [accessed 2021 Aug 12]. wmooring.com/files/Guide_to_Single_Point_Moorings.pdf.
- Wu GX. 1991. Hydrodynamic forces on a submerged cylinder advancing in water waves of finite depth. J Fluid Mech. 224:645–659. DOI:10.1017/S002211209100191X.
- Ye J, Cai H, Liu L, Zhai Z, Amaechi CV, Wang Y, Wan L, Yang D, Chen X, Ye J. 2021. Microscale intrinsic properties of hybrid unidirectional/woven composite laminates: part I: experimental tests. Compos Struct. 262:113369. DOI:10.1016/j.compstruct.2020.113369.
- Yeung RW. 1981. Added mass and damping of a vertical cylinder in finite-depth waters. Appl Ocean Res. 3(3):119–133. DOI:10.1016/0141-1187(81)90101-2.
- Yokohama. 2016. Seaflex Yokohama offshore loading & discharge hose. Hiratsuka City: The Yokohama Rubber Co. Ltd. [accessed 2021 May 17]. https://www.y-yokohama.com/global/product/mb/pdf/resource/seaflex.pdf.
- Yuan Z, Huang Z. 2015. Morison coefficients for a circular cylinder oscillating with dual frequency in still water: an analysis using independent-flow form of Morison’s equation. J Ocean Eng Mar Energy. 1:435–444. DOI:10.1007/s40722-015-0030-6.
- Zhang D, Paterson E. 2015. A study of wave forces on an offshore platform by direct CFD and Morison equation. E3S Web Conf. 5:04002. DOI:10.1051/e3sconf/20150504002.
- Zhang SF, Chen C, Zhang Q-X, Zhang D-M, Zhang F, et al. 2015. Wave loads computation for offshore floating hose based on partially immersed cylinder model of improved Morison formula. Opene Petrol Eng J. 8:130–137. DOI:10.2174/1874834101508010130.
- Zheng S, Zhang Y. 2016. Wave radiation from a truncated cylinder in front of a vertical wall. Ocean Eng. 111:602–614. DOI:10.1016/j.oceaneng.2015.11.024.
- Zhou XL, Wang J-H, Zhang J, Jeng D-S. 2014. Wave and current induced seabed response around a submarine pipeline in an anisotropic seabed. Ocean Eng. 75:112–127. DOI:10.1016/j.oceaneng.2013.11.016.
- Zhou Y, Duan ML, Ma JM, Sun GM. 2018. Theoretical analysis of reinforcement layers in bonded flexible marine hose under internal pressure. Eng. Struct. 168:384–398. DOI:10.1016/j.engstruct.2018.04.061.
- Ziccardi JJ, Robbins HJ. 1970. Selection of hose systems for SPM tanker terminals. Offshore Technology Conference Proceeding (OTC) 1152. Dallas, Texas, USA; OnePetro, p. 83–94. DOI:10.4043/1152-MS.
- Zou J. 2008. Dynamic responses of a dry tree semi-submersible platform with ram style tensioners in the post-katrina irregular seas. The eighteenth International Offshore and Polar Engineering Conference. International Society of Offshore and Polar engineers; Vancouver, Canada; July. [accessed 2021 May 16]. https://onepetro.org/ISOPEIOPEC/proceedings-abstract/ISOPE08/All-ISOPE08/ISOPE-I-08-031/10683 (Retrieved on: 16th May, 2021).
- Zou J, Poll P, Antony A, Das S, Padmanabhan R, Vinayan V, Parambath A. 2014. VIM model testing and VIM induced mooring fatigue of a dry tree paired-column semisubmersible platform. In Offshore Technology Conference; Offshore Technology Conference. DOI:10.4043/25427-MS.
- Zou J, Poll P, Roddier D, Tom N, Peiffer N. 2013. VIM testing of a paired column semi submersible. ASME 2013 32nd International Conference on Ocean, Offshore and Arctic engineering. p. V007T08A001-V007T08A001. American Society of Mechanical Engineers. DOi:10.1115/OMAE2013-10001.