Abstract
The 2008 election cycle signaled a recent high in Democratic voting in the State of Wisconsin. At the national level, Wisconsin awarded its electoral votes to Democrat Barack Obama. Democrats performed well at the state level too, taking control of the State Assembly, State Senate, and Governor's mansion, a first since 1986. By 2010, in the wake of the worst economic crisis since the Great Depression, voters turned their attention away from Democrats. Nationally, Democrats lost 63 seats in the House of Representatives and clung to a three seat majority in the US Senate. Wisconsin voters propelled Republicans to victory in unprecedented fashion, making it the only state in the 2010 election cycle in which one party lost majorities in both houses of the state legislature and the governorship. The purpose of this paper is to use cartographic illustrations at the county and voting district levels to provide spatial evidence of voting patterns in the State of Wisconsin. County-level analysis is provided for the 2008 presidential and the 2010 gubernatorial elections, while voting district-level analysis is conducted for the 2010 gubernatorial election. Voting district results are the smallest scale of voting results available to the public and allow a more intimate and local contextual analysis of election patterns. This study also provides a technological framework for troubleshooting election reporting methods that do not align with voting district shapefiles in a GIS format.
1. Introduction
Elections in the state of Wisconsin have produced varying results at state and national levels. At the national level, Wisconsin has conceded its electoral votes to the Democratic candidate in every presidential election since 1988. Its citizens elected Democratic US Senators in all elections between 1992 and 2010, while sending members of the Democratic and Republican parties to the US House of Representatives during the same time. At the state level, however, neither party has held complete control of the Assembly, State Senate, and Governorship for more than one election cycle since 1988.
The 2008 election cycle produced historic results in the United States. A nation upset with a faltering economic system and fatigued from a near decade-long war headed to the polls in November at levels seldom seen. Reaching turnout numbers of over 60%, voters elected Democrat Barack Obama, a man with mixed European-American and African ancestry, to the Presidency and placed the Democrats in control of both the US House of Representatives and the US Senate. In Wisconsin, similar events unfolded. Democrats gained control of the State Assembly for the first time since 1992, and maintained control of both the State Senate and the governorship, a first since 1986.
Economic conditions had not improved by the 2010 election season. Unemployment rates remained high nationally and in Wisconsin, and Republican candidates contended that they could reverse the poor economic trend and balance budgets by reducing the size of the government. The electorate took notice, and in Wisconsin, Republicans saw unprecedented increase in votes and swept elections across the state. Nationally, Wisconsin was the only state to experience a complete reversal of control in the State Senate, Assembly, and Governorship from Democrat to Republican. At the federal level, longtime Wisconsin Democratic Senator Russ Feingold was unable to shake the national momentum of the Tea Party and unexpectedly lost to its candidate, businessman and Republican Ron Johnson.
The overwhelming 2010 Republican victories in the state of Wisconsin, contrasted with the high Democratic support in 2008, illustrate the volatile character of the modern Wisconsin electorate. This behavior is reflected in protests over the nature in which Governor Scott Walker and the Republican-controlled legislature passed the Budget Repair Bill (Act 10) in February 2011, the summer 2011 recall elections of Democratic and Republican legislators, and the pending recall election of Governor Walker, Lieutenant Governor Rebecca Kleefisch, and four Republican state senators in June of 2012. The latter election has been deemed a litmus test, not only for Democrats in the November 2012 General Election, but also for labor rights. Due to the recent unpredictable nature of Wisconsin voters, geography may be the best format for understanding their behavior. Baybeck and McClurg imply, ‘Geography plays a prominent role in some explanations of political behavior’ (2005, p. 492). Specifically, Johnston, Jones, Propper, and Burgess, suggest that ‘because of the importance of local context in both the socialization of voters and the mobilization activities undertaken by political parties…where one lives can be an important predictor of how one votes’ (2007, p. 640).
The basis of the ‘local context’ idea relates to the early works of Kevin Cox. In his groundbreaking essay on ‘The Voting Decisions in a Spatial Context’, CitationCox (1969) coined the term ‘neighborhood effect’. The neighborhood, it is argued, is critical to electoral behavior because it is a conduit for social interactions where people discuss various political issues (CitationTaylor & Johnston, 1979). Johnston suggests that since most people work close to their homes and interact with neighbors having similar socioeconomic characteristics, resulting electoral maps should illustrate voting differences among groups (1974, p. 418).
Drawing from Cox's theories of the neighborhood, geographers expanded the scale of their research beyond the impacts of individual contact and towards other influences. Political geographer John Agnew termed this form of study as ‘contextual analysis’. Agnew suggests that information diffusion reflects the ‘hierarchical funneling of stimuli across geographic scales’ and influences political behavior (1996, p. 132). Information is transmitted at numerous scales, ranging from the home to neighborhoods, cities, voting districts, regions, and countries. Although each disseminates information in various ways, each has an influence on voting behavior (CitationJohnston et al., 2007). Residents at these various scales may develop a common identity that predisposes them to vote in certain ways (CitationJones, Johnston, & Pattie, 1992, p. 347).
Critics of contextual analysis suggest that a lack of empirical evidence hinders aggregation of data across scales. This argument is driving research that seeks to differentiate electoral studies that aggregate data over geographic areas from those that study voters as individuals. Some studies have concluded that neighbors do not directly influence the political decision-making of each other. However, CitationMcClurg (2006) argues that these studies fail to simultaneously measure these properties at both the spatial aggregate and the individual scales, thereby making it difficult to discern which best apply to a particular analysis. McClurg states, ‘As such, these studies often offer different interpretations of their evidence that tend to muddy, rather than clarify, the role of aggregate diversity on participation’ (2006, p. 351). CitationPattie and Johnson (2000) note that the lone, but often cited study that combines the two schools of thought was conducted by CitationHuckfeldt and Sprague (1995), who surveyed citizens in South Bend, Indiana about the role that personal interactions played in influencing political behavior. Their conclusion: People who talk together vote together. Due to the difficulty of obtaining data at individual levels, electoral geographers have approached studies of ‘local context’ through the use of aggregated voting data at smaller scales. The level of scale varies, from county and congressional district levels in the United States to parliamentary district levels in Great Britain, but most studies indicate that substantially different geographic patterns exist at various scales, particularly among voters of dissimilar cultural, racial, and/or socioeconomic backgrounds (CitationAgnew, 1996; CitationArcher & Taylor, 1981; CitationHeppen, 2003; CitationJohnston, 1974; CitationJohnston et al., 2007; CitationJones et al., 1992; CitationMcKee & Shaw, 2003; CitationPattie, 1998; CitationPattie & Johnston, 1990; CitationPattie & Johnston, 2000; CitationShelley & Archer, 1984; CitationTunstall et al., 2000; CitationWalks, 2005; CitationWard, 2002).
Aggregation over time at the voting district or ward level is often hampered by frequent changes in district boundaries or by differing reporting methods at the local level. Therefore, geographic analysis of elections at this very local scale is typically completed at the municipal level for single elections (CitationMcPhail, 1971). However, recent changes in technology, particularly in Geographic Information Systems (GIS) and increasing availability of digital data via the Internet, have made it easier to perform studies at the district or ward level. Similarly, with advances in the dissemination of census data attached to georeferenced GIS data, further interpretations can be made at the most local level of electoral aggregation.
Overall, this paper's goal is not to engage in a scholarly debate in the use of contextual analysis and neighborhood effect in the study of elections, but rather provide a technical and cartographic approach towards studying voting districts. This paper has two purposes: first, to illustrate the high degree of local context that can be obtained by mapping statewide election results at the voting district level and second, to provide a GIS-based framework for avoiding problems with contradictory reporting methods. Each will be addressed through an examination of the 2010 Wisconsin gubernatorial election.
2. Map production and analysis
The May 2010 US Supreme Court decision in support of Citizens United in the case of Citizens United v. Federal Election Commission resulted in unprecedented changes in political campaign funding and strategy. That fall, a record amount of money was spent nationwide by both major political parties and their allies to promote and disparage those running for office. These tactics, to which Wisconsin was not immune, are partially responsible for a new era in Wisconsin gubernatorial politics. Democratic governor Jim Doyle chose to not run for a third term. Republicans ran former Milwaukee County Executive Scott Walker against Tom Barrett, the popular Democratic mayor of Milwaukee. According to the CitationWisconsin Democracy Campaign (2011), new sources of campaign finance bolstered spending to $37 million, a level never seen before in the state. Twelve million dollars of this money came from outside groups whose anonymity remains protected by the Citizens United ruling. Walker spent more than $11 million dollars; Barrett, nearly $7 million. In the end, 2.13 million Wisconsin citizens voted, and Walker defeated Barrett by 124,638 votes.
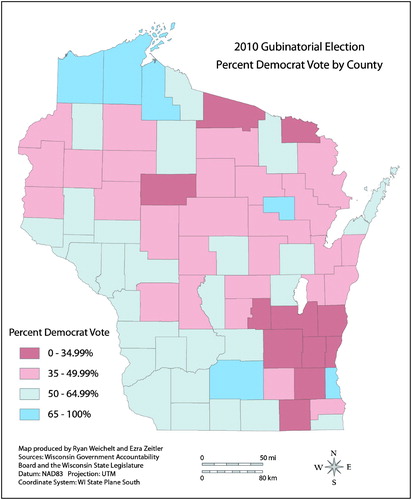
As stated in the introduction, the 2010 federal and state elections in Wisconsin signaled a recent low of Democratic support among the electorate. To illustrate these changes, we present a county-level map of votes for Barack Obama in the 2008 presidential election () and county-level map of votes for Democratic gubernatorial candidate Tom Barrett in 2010 (). Much of the state voted for Obama in 2008. The areas of strongest Democratic support include Dane, Milwaukee, Menomonee, Douglas, and Ashland Counties. Republican support was greatest in the suburban counties of southeastern Wisconsin, including Fond du Lac, Sheboygan, Dodge, Washington, Ozaukee, Waukesha, and Walworth Counties. In the 2010 Wisconsin gubernatorial election, Democrats performed strongest in the areas they had in 2008, but lost support in the north central region of the state. Republicans increased support in the same southeastern counties as well as in areas of northern Wisconsin.
Figure 1. Percent of ballots cast in favor of Democratic Presidential candidate Barack Obama in the 2008 election. Source: Wisconsin Government Accountability Board.
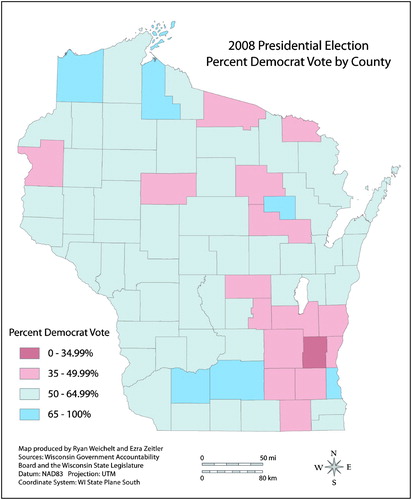
Figure 2. Percent of ballots cast in favor of Democratic gubernatorial candidate Tom Barrett in the 2010 election. Source: Wisconsin Government Accountability Board.
While county-level analysis was successful in identifying electoral regions in the state for particular counties, finer voting district results provide further evidence of a ‘local context’ in the 2010 election. The Main Map displays the results of the gubernatorial election at the voting district level that, upon further examination, also reveals distinct socio-economic and cultural patterns that exist in Wisconsin. In general, voting district size is inversely related to the total population. Therefore, voting districts that are smaller in size generally have larger population densities. Populations of voting districts range from 10 residents to a high of 4787 in the second voting district of Whitewater, a city located along the border of Jefferson and Walworth Counties in southern Wisconsin. As can be seen, sparsely populated voting districts often encapsulate an entire township in the rural areas of the state, while the city of Milwaukee alone has 314 individual voting districts.
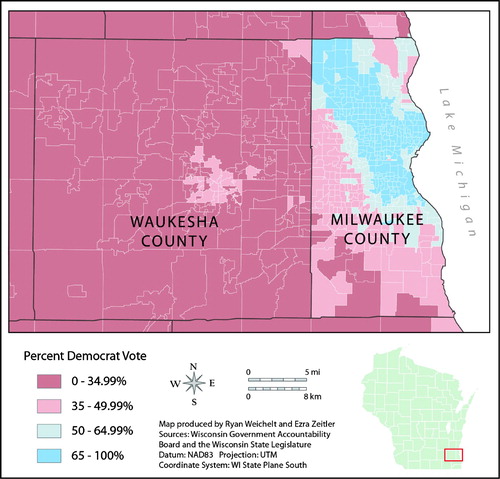
The most visible electoral divide in Wisconsin, as illustrated in the Main Map, is between rural, suburban, and urban areas. Democratic candidate Tom Barrett gained most of his support in the urban areas of the state. This is clearly evident when comparing the voting patterns in Waukesha and Milwaukee Counties. The Main Map is a close-up of this area in the state. The darkest blue area in Milwaukee County represents much of the City of Milwaukee's densely populated urban core. Democratic support declines as the distance from the urban core increases. This pattern reflects decreases in population density as well as a distinct disparity in socio-economic status that is largely driven by a history of institutionally racialized housing policies at all governmental levels (CitationMassey & Kanaiupuni, 1993). This is illustrated in Milwaukee's status as one of the most racially segregated cities in the United States (CitationSpan, 2002). Milwaukee County is the most racially diverse county in Wisconsin, and the 2010 Census indicates that about 60% of the county population was white non-Hispanic and that nearly 27% percent of the population was black (US Census, 2010). The area of strongest Democratic support in Milwaukee County is home to a high percentage of African Americans, and the proportion of whites and household income increases as the distance from this area of the county increases. To the west in Waukesha County, nearly 93% percent of the population is white and about 1% is African American (US Census, 2010). Waukesha County's median income in 2010 was more than $87,000 while Milwaukee County's was around $40,000 (US Census, 2010). The spatial patterns of electoral behavior in these Wisconsin counties supports research regarding the important role of the neighborhood effect and the use of contextual analysis to understand voting behavior.
Urban areas outside of southeastern Wisconsin also supported Barrett in 2010. This paper cannot provide evidence why these voters supported Barrett over Walker, but further contextual studies could provide specific evidence for stronger urban support for Democrats. General knowledge about these places, however, explains much of this behavior. Ardent Democratic support in Dane County is explained by its large, educated population due to the presence of the University of Wisconsin-Madison, the State Capitol and its associated governmental departments, and various high-tech industries. This trend holds true in other urban areas in Wisconsin, where universities, hospitals, and other institutions requiring a highly educated workforce exist. For example, Democratic support in areas of Eau Claire, Portage, Dunn, Douglas, Grant, Brown, and La Crosse Counties are due in part to the existence of a major public university.
Barrett also fared well in the northern counties of Ashland, Bayfield, and Douglas Counties. Many residents of these counties are blue-collar workers employed in lumbering or the public sector. Culturally, residents of European background in this area tend to be Norwegian or Finnish with strong traditions in socialist political ideologies that have typically supported Democratic candidates at all levels. Similarly, Indigenous Peoples also have a strong presence in this area. Ashland and Bayfield counties are home to two bands of the Lake Superior Tribe of Chippewa (Ojibwe): the Bad River Band in northern Ashland County and the Red Cliff Band in northern Bayfield County. Both are identified as being strongly Democratic in the Main Map.
Since earning the right to vote in federal elections of the United States in 1924, the Indigenous Peoples of Wisconsin have traditionally sided with socially and environmentally progressive political parties. As with the Bad River and Red Cliff Bands of Lake Superior Chippewa (Ojibwe), other tribal areas are easily identifiable in the Main Map by their ardent Democratic support. Menominee County, home to the Menomonee Nation, is the largest reservation in the state of Wisconsin and can be easily identified by its Democratic support. Two voting districts adjoining Menominee County to the south in Shawano County indicate the support of the Stockbridge-Munsee Band of Mohicans. Forest County, located north of Menominee County, is home to two Native American communities. The presence of the Sokaogon Chippewa Community is indicated by the dark blue voting district in the southwest corner of the county, and the light blue voting districts in eastern Forest County reflect, in part, the voting behavior of the Forest Lake Potawatomi community. The Black River Falls community of the Ho-Chunk Nation can be identified by the strong level of Democratic support in the voting districts of north central Jackson County.
2.1 Overcoming challenges in voting district reporting and GIS data
Local voting districts in Wisconsin have a degree of flexibility with regards to reporting election returns. In particular, local officials are able to aggregate the results of multiple contiguous voting districts and report them as one district. This is typical in rural areas of the state with low population densities. Every 10 years, the United States Congress mandates that state governments utilize population data from the decennial census to modify voting district boundaries in areas of significant population gain or loss. This process begins at the voting district level, where local officials determine boundaries which are reviewed and subsequently accepted by state officials.
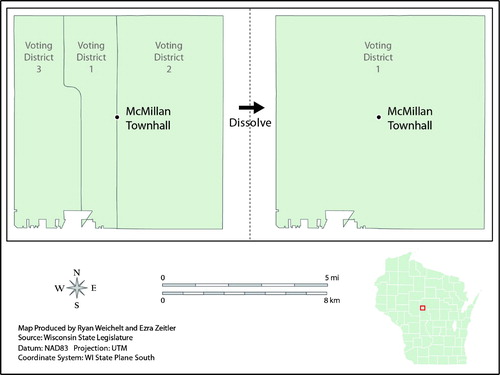
The ability of local officials to aggregate election returns resulted in hundreds of precincts that did not contain data in the voting districts GIS shapefile obtained from the CitationWisconsin State Legislature (2011). presents an example of this issue. McMillan Township, located in southwestern Marathon County in central Wisconsin, is broken into three voting districts. All voters travel to one site, the municipal town hall in the center of the township, to cast their ballots. Despite the presence of three voting districts, election returns from McMillan Township are aggregated and reported to the Marathon County Clerk as one district. These returns are then reported to the Wisconsin Government Accountability Board as McMillan Township VTD 1, 2, and 3. This method of reporting does not allow interrogation into the number of votes cast in McMillan Township's individual voting districts and, therefore, impedes the level of detailed analysis that is possible in urban and suburban environments. It also resulted in two empty voting districts in the GIS voting districts shapefile (districts 2 and 3), as all votes for McMillan Township were mapped in district 1.
Figure 3. Portion of the statewide voting district map (Main Map) that illustrates support for Democratic candidate Tom Barrett in Waukesha and Milwaukee Counties in the 2010 gubernatorial election. Source: Wisconsin Government Accountability Board and the Wisconsin State Legislature.
This issue resulted in hundreds of empty voting districts throughout the initial map, and resolving this issue was very tedious. In the shapefile provided by the Legislature, individual voting districts were given a unique identifier field labeled as JID in the data attribute file. The first step in the dissolve process involved detecting all individual voting districts in the state that had been aggregated and designating them as such in the data attribute file. The file was then opened in Microsoft Excel, where a new field was created and the aggregated voting districts without election data were given the same JID number as the district with the election returns. Using McMillan Township as an example, the JID of voting district 1, the district with the aggregated voting data, was 5507346975. The JID numbers of district 2 and 3, 5507346976 and 5507346977, respectively, were replaced with the JID of district 1. Next, the Excel file was joined to the voting district shapefile in ArcGIS and the boundaries between voting districts were removed using the dissolve tool located in the geoprocessing toolbox. This method, although time consuming, resolved the issue of empty voting districts ().
Figure 4. Visual illustration of the dissolving process in ArcGIS that creates one voting district (right) from three districts (left). This process was performed hundreds of times to match aggregated election return data provided by the Wisconsin Government Accountability Board.
3. Conclusions
CitationBaybeck and McClurg (2005) note that geography can help explain political phenomena. The maps presented in this article exhibit the ways in which local contextual studies that use small scales of analysis identify particular attributes that may help explain why groups of electors vote the way they do. As CitationHuckfeldt and Sprague (1995) determined in their South Bend study, people that talk together vote together.
Cartographic comparisons between the county-level analysis of the 2008 and 2010 elections illustrate regional variations in voting behavior at the local level in Wisconsin. Although Democratic support decreased throughout the state between 2008 and 2010, the party's strength remained consistent in the northwestern areas of the state, in Menominee County, in Milwaukee County, and around Dane County. At the same time, Republican support in most of southeastern Wisconsin held true.
The most noteworthy of observations in this research is that a significant amount of detail is uncovered by examining voting patterns at the sub-county scale. Although some manipulation of district boundaries was necessary to create the district-level map of the 2010 gubernatorial election, a clearer picture of the Wisconsin electorate results. Among the more obvious patterns observed in this map are the differences between urban and suburban areas throughout the state. The impact of adherence to traditional voting behavior among Scandinavian Americans in the far north and other rural areas is also noteworthy. Last, this map reveals the voting habits in many of the state's Native American communities. With the exception of Menominee County, the county-level maps mask strong Democratic support of the many tribes found throughout the state. Tribal voting districts were clearly identified as blue in a sea of red across northern Wisconsin.
Studies in electoral geography performed at the voting district level in the United States are rare. Reporting methods and abrupt boundary changes are most likely the culprit for this. However, studies that take advantage of advances in geospatial technology and improved accessibility to voting district results, such as this one, shed new light on voting patterns at the sub-county scale. Whether used alone or with other research methods, cartographic analysis at the voting district level provides a platform for more in-depth analysis.
Software
Election data were obtained from the Government Accountability Board (http://gab.wi.gov/elections-voting/results) as a Microsoft .xls file for county and voting district data. ArcGIS 10 was used for mapping county election results for 2008 and 2010 as well as for mapping and dissolving voting districts for the 2010 gubernatorial election. ArcGIS maps were exported to Adobe Illustrator CS5.1 for design enhancements and final layout presentation.
Supplemental Material - Map
Download PDF (6.7 MB)References
- Agnew , J. 1996 . Mapping politics: How context counts in electoral geography . Political Geography , 15 ( 2 ) : 129 – 146 . Retrieved from http://dx.doi.org/10.1016/0962-6298(95)00076-3
- Archer , J. C. and Taylor , P. 1981 . Section and party: A political geography of American presidential elections from Andrew Jackson to Ronald Regan , Chichester: John Wiley .
- Baybeck , B. and McClurg , S. D. 2005 . What do they know and how do they know it?: An examination of citizen awareness of context . American Politics Research , 33 : 492 – 520 . Retrieved from http://dx.doi.org/10.1177/1532673X04270934
- Cox , K. R. 1969 . The voting decision in a spatial context . Progress in Geography , 47 : 27 – 35 .
- Cox , K. R. 1971 . The spatial components of urban voting response surfaces . Economic Geography , 47 ( 1 ) : 27 – 35 . Retrieved from http://dx.doi.org/10.2307/143223
- Government Accountability Board: State of Wisconsin. (2011). Elections and election results [Online]. Retrieved on October 5, 2011, from http://gab.wi.gov/elections-voting/results
- Heppen , J. 2003 . Racial and social diversity and U.S. presidential election regions . The Professional Geographer , 55 ( 1 ) : 191 – 205 .
- Huckfeldt , R. and Sprague , J. 1995 . Citizens, politics and social communication: Information and influence in an election campaign , Cambridge : Cambridge University Press . Retrieved from http://dx.doi.org/10.1017/CBO9780511664113
- Johnston , R. J. 1974 . Local effects in voting at a local election . Annals of the Association of American Geographers , 64 ( 3 ) : 418 – 429 .
- Johnston , R. , Jones , K. , Propper , C. and Burgess , S. 2007 . Region, local context, and voting at the 1997 general election in England . American Journal of Political Science , 51 ( 3 ) : 640 – 654 . Retrieved from http://dx.doi.org/10.1111/j.1540-5907.2007.00272.x
- Jones , K. , Johnston , R. J. and Pattie , C. J. 1992 . People, places and regions: Exploring the use of multi-level modeling in the analysis of electoral data . British Journal of Political Science , 22 ( 3 ) : 343 – 380 . Retrieved from http://dx.doi.org/10.1017/S0007123400006426
- Massey , D. and Kanaiupuni , S. 1993 . Public housing and the concentration of poverty . Social Science Quarterly , 74 : 109 – 122 .
- McClurg , S. D. 2006 . Political disagreement in context: The conditional effect of neighborhood context, disagreement and political talk on electoral participation . Political Behavior , 28 ( 4 ) : 349 – 366 . Retrieved from http://dx.doi.org/10.1007/s11109-006-9015-4
- McKee , S. C. and Shaw , D. R. 2003 . Suburban voting in presidential elections . Presidential Studies Quarterly , 33 ( 1 ) : 125 – 144 . Retrieved from http://dx.doi.org/10.1111/j.1741-5705.2003.tb00019.x
- McPhail , I. 1971 . The vote for Mayor of Los Angeles in 1969 . Annals of the Association of American Geographers , 61 ( 4 ) : 744 – 758 . Retrieved from http://dx.doi.org/10.1111/j.1467-8306.1971.tb00823.x
- Pattie , C. J. 1998 . Classics in human geography revisited . Progress in Human Geography , 22 ( 3 ) : 407 – 413 . Retrieved from http://dx.doi.org/10.1191/030913298675222849
- Pattie , C. J. and Johnston , R. J. 1990 . Embellishment and detail? The changing relationship between voting, class, attitudes and the core. Periphery division of Great Britain 1979-1987 . Transactions of the Institute of British Geographers , 15 ( 2 ) : 205 – 226 . Retrieved from http://dx.doi.org/10.2307/622865
- Pattie , C. J. and Johnston , R. J. 2000 . “People Who Talk Together Vote Together”: An exploration of contextual effects in Great Britain . Annals of the Association of American Geographers , 90 ( 1 ) : 41 – 66 . Retrieved from http://dx.doi.org/10.1111/0004-5608.00183
- Shelley , F. M. and Archer , J. C. 1984 . Political habit, political culture, and the electoral mosaic of a border region . Geographical Perspectives , 54 ( 1 ) : 7 – 20 .
- Span , C. M. 2002 . Black Milwaukee's challenge to the cycle of urban miseducation: Milwaukee's African American immersion schools . Urban Education , 37 : 610 – 630 . Retrieved from http://dx.doi.org/10.1177/0042085902238676
- Taylor , P. J. and Johnston , R. J. 1979 . Geography of Elections , New York, NY: Holmes & Meier .
- Tunstall , H. , Rossiter , D. J. , Pattie , C. J. , MacAllister , I. , Johnston , R. J. and Dorling , D. F.L. 2000 . Geographical scale, the ‘Feel-Good Factor’ and voting at the 1997 general election in England and Wales . Transactions of the Institute of British Geographers , 25 ( 1 ) : 51 – 64 . Retrieved from http://dx.doi.org/10.1111/j.0020-2754.2000.00051.x
- US Census Bureau. (2010). Profile of general population and housing characteristics: 2010 Demographic profile [Online]. Retrieved on December 3, 2011, from http://factfinder2.census.gov/faces
- Walks , R. A. 2005 . City-suburban electoral polarization in Great Britain, 1950-2001 . Transactions of the Institute of British Geographers , 30 ( 4 ) : 500 – 517 . Retrieved from http://dx.doi.org/10.1111/j.1475-5661.2005.00185.x
- Ward , N. 2002 . Representing rurality? New labour and the electoral geography of rural Britain . Area , 34 ( 2 ) : 171 – 181 . Retrieved from http://dx.doi.org/10.1111/1475-4762.00069
- Wisconsin Democracy Campaign. (2011). Campaign finance database [Online]. Retrieved on October 10, 2011, from http://www.wisdc.org/database.html
- Wisconsin State Legislature. (2011). Wisconsin state legislature, legislative redistricting, data [Online]. Retrieved on October 6, 2011, from http://legis.wisconsin.gov/ltsb/redistricting/data.htm