Abstract
A glacial geomorphological map of the Dalijia Shan (Shan = mountain) region in the most northeastern part of the Tibetan Plateau is presented here. The map covers an area of approximately 10,730 km2 at a scale of 1:600,000. A combination of remote sensing imagery is used to identify glacial landforms within the study area including: Shuttle Radar Topography Mission (SRTM) digital elevation models (DEMs; 90 m), Advanced Spaceborne Thermal Emission and Reflection Radar (ASTER) DEMs (30 m), Landsat 7 ETM+ satellite imagery, and Google Earth™ imagery. Two types of glacial landforms are identified and mapped: glacial valleys (including cirques in some cases) and marginal moraines. These landforms comprise approximately 1.3% of the study area, indicating more restricted past glaciation than in previously mapped areas in the central and eastern Tibetan Plateau. Glacial landforms are limited primarily to the mountainous region of the study area, largely around Dalijia Peak, lending support to a hypothesis of limited glacier and ice cap expansions in this region.
1. Introduction
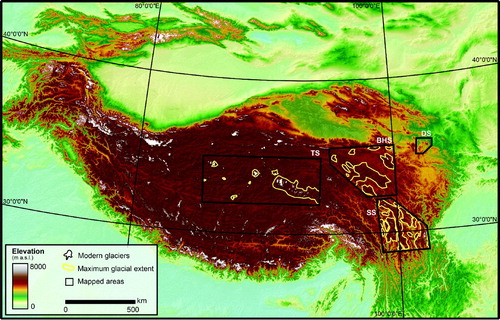
The Tibetan Plateau, covering an area of approximately 3 million km2 with an average elevation higher than 4000 m. a.s.l. (meters above sea level), plays a significant role in global and regional atmospheric circulation. Reconstructing paleoclimate changes on the Tibetan Plateau is thus of considerable importance in understanding global change, and so there is considerable interest in reconstructing Tibetan Plateau paleoclimate using proxies such as changes in glacier extent. Considerable attention has focused on the scale and timing of expansion and contraction of glaciers on the Tibetan Plateau, with ideas ranging from a plateau-wide ice sheet that was synchronous with the most recent major Northern Hemisphere glaciation (Kuhle, Citation1988, Citation2004) to much more limited glacier and ice cap expansions that were out of phase with the timing and extent of Northern Hemisphere glaciation (e.g. Derbyshire et al., Citation1991; Heyman et al., Citation2011; Lehmkuhl & Owen, Citation2005; Owen, Citation2009; Zhou, Li, Zhang, Zhao, & Cui, Citation2004). Reconstructions of glacial extents in several key regions of the Tibetan Plateau have led the scientific community to reject the hypothesis of a plateau-wide ice sheet during the last glacial maximum (e.g. Heyman et al., Citation2009, Citation2011; Lehmkuhl, Citation1998; Owen et al., Citation2005). These include reconstructions presented in a series of detailed glacial landform maps () for the Bayan Har Shan (Shan = mountain; Heyman et al., Citation2008), Tanggula Shan (Morén et al., Citation2011), and Shaluli Shan (Fu et al., Citation2012) that document a record of limited glacier and ice cap expansions. Still there are many regions of the Tibetan Plateau where the extent and timing of glaciation remains poorly documented. This paper expands the glacial landform mapping effort to the Dalijia Shan on the most northeasterly part of the Tibetan Plateau, a transition region between the Tibetan Plateau and the Loess Plateau (Li & Pan, Citation1989).
Figure 1. Map of the Tibetan Plateau highlighting modern glaciers (white polygons) and reconstructions of paleoglaciological extents (yellow outlined polygons) mapped in central and eastern regions of the Plateau. The generalized reconstructions represent the minimum extent of maximum glaciation for the Shaluli Shan (SS) presented in Fu, Heyman, Hättestrand, Stroeven, and Harbor (Citation2012), the Tanggula Shan (TS) presented in Morén, Heyman, and Stroeven (Citation2011), and the Bayan Har Shan (BHS) presented in Heyman, Hättestrand, and Stroeven (Citation2008). This study is focused on the Dalijia Shan (DS), which is currently the farthest northeastern study area on the Tibetan Plateau. Modern glacier data are from GLIMS (Citation2010).
The Dalijia Shan is currently ice free, but in the region surrounding the highest peak, Dalijia Peak (4636 m a.s.l), there are glacial features similar to those found elsewhere in high mountain ranges of the Tibetan Plateau. Previous paleoglaciological investigations in this region have been limited (Li & Pan, Citation1989; Mahaney & Rutter, Citation1992; Shen, Kang, & Zilliacus, Citation1989). Based on large-scale regional mapping Li et al. (Citation1991) suggested that there had been an ice cap on Dalijia Shan, and this was supported by detailed field mapping of landforms by Li and Pan (Citation1989). The only other studies of paleoglaciation in the region have focused on determining the relative timing of glaciations for the area immediately surrounding Dalijia Peak using methods that included correlating landforms with loess deposits in terraces along the Daxia He (He = river; Li & Pan, Citation1989; Shen et al., Citation1989) and relative dating based on analyzing amino acids and sand clast weathering in soils (Mahaney & Rutter, Citation1992).
The aim of the mapping work presented here is to provide information on the spatial distribution of glacial landforms in the Dalijia Shan region that is comparable with other results from a project to systematically map key areas of the Tibetan Plateau using consistent methods and data (Fu et al., Citation2012; Heyman et al., Citation2008; Morén et al., Citation2011; ). In addition, this work provides a foundation for related work on glacial chronology that aims to improve our understanding of the paleoglaciology of the Dalijia Shan and the northeastern Tibetan Plateau. Ultimately, this will allow for comparison of the history and glacial extent between the Dalijia Shan and other regions in the central and eastern Tibetan Plateau.
2. Physiography of the Dalijia Shan area
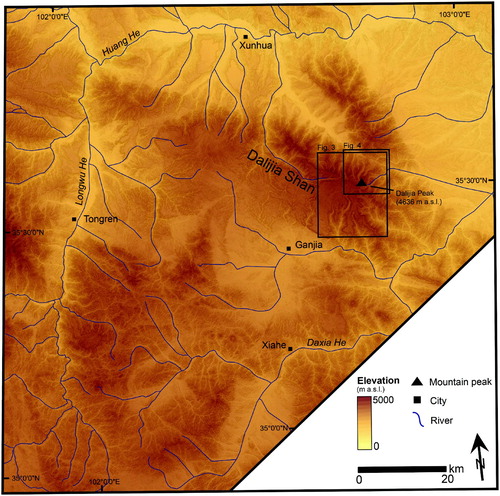
The study region covers an area of approximately 10730 km2 and is centered on the Dalijia Shan, a relatively small mountainous area between the Tibetan Plateau and the Loess Plateau ( and ). The region encompasses the area extending from the Huang He in the north, the Longwu He to the west, and the Daxia He to the south and east. Elevations range from approximately 1800 m a.s.l. in the fluvial valleys to >4600 m a.s.l. at the highest peak. The majority of the region is relatively flat at an elevation of approximately 3000 m a.s.l. and, except for the main peaks of the Dalijia Shan, has been described as a planation surface (Li & Pan, Citation1989). The bedrock consists of Precambrian crystalline complexes of granite and schist that have been intensely folded and faulted (Mahaney & Rutter, Citation1992). The climate of this region is affected by both the winter westerlies and the summer monsoons, but during glacial periods the winter westerlies become the dominant climate driver (Rost, Citation2000; Shi, Citation2002). This makes the Dalijia Shan an ideal region for comparison of glacial extent and history with other regions on the Tibetan Plateau that are mainly affected by summer monsoons.
Figure 2. Geography and topography of the Dalijia Shan region of the Tibetan Plateau (see for location). The black boxes denote the locations of the landform examples in and . ASTER GDEM (30 m) is a product of METI and NASA downloaded from: http://reverb.echo.nasa.gov/ and river data are from GIS Data Depot (http://data.geocomm.com/).
3. Methods
The glacial geomorphology was mapped using digital elevation models (DEMs). Both the Shuttle Radar Topography Mission (SRTM) DEM with 90 m horizontal resolution (Jarvis, Reuter, Nelson, & Guevara, Citation2008) and Advanced Spaceborne Thermal Emission and Reflection Radar (ASTER) with 30 m horizontal resolution (EOSDIS, Citation2009) were used in this study. Semi-transparent gray-scale images of slope were produced and draped on the DEMs to improve the topographic expression. False color composite images of bands 5, 4, and 2 were compiled using Landsat 7 ETM+ satellite imagery obtained from the Global Land Cover Facility (GLCF, Citation2011). Landforms were identified and mapped using the false color composite images and the DEMs. Google Earth™ was used for a 3-D view of the topography. The mapping was primarily conducted at a scale of 1:80,000.
4. Landform definitions and descriptions
Landform descriptions used in this study (outlined below) are based on descriptions presented in Heyman et al. (Citation2008) on the glacial morphology of the Bayan Har Shan in the northeastern Tibetan Plateau, and also in Morén et al. (Citation2011) and Fu et al. (Citation2012). Only two types of glacial landforms were identified within the study area at the map scale: glacial valleys and marginal moraines, and these are primarily limited to the region surrounding the highest mountain, Dalijia Peak.
4.1 Glacial valleys
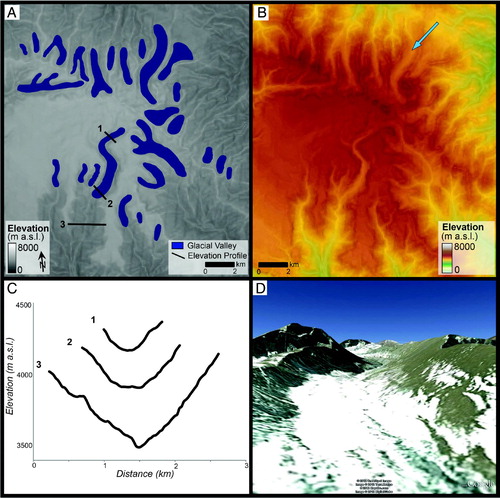
Glacial valleys were primarily defined based on the presence of a ‘U-shaped’ valley cross-section with steep, smooth valley sides and a relatively wide and flat valley bottom. These differ from fluvial valleys that are more ‘V-shaped’ with valley sides that have topographic irregularities resulting from slope processes (). Glacial valleys are up to 1.5 km wide, up to 6 km long, and range from 140 to 230 m deep with depth/width ratios of 0.15–0.21. Cirques, typically defined by a distinctive bowl shape and steep headwall, were not mapped separately because there were no cirques in the map area that were not the heads of glacial valleys, and it was not possible to consistently distinguish between the end of a cirque and the beginning of a glacial valley. However, not every glacial valley identified on the map has an associated cirque. Glacial valleys were identified primarily from the DEM (b) and in Google Earth™ imagery.
Figure 3. Glacial Valleys. (A) Mapped glacial valleys in the Dalijia Shan. Numbered transects correspond to elevation profiles in (C). (See for location). The semi-transparent gray-scale DEM (SRTM) is draped on a gray-scale slope image. (B) Semi-transparent colored DEM (SRTM) draped on a gray-scale slope image illustrating the smooth sides that characterize the glacial valleys versus fluvial valleys (same area as in panel A). (C) Elevation profiles illustrating the shift from a ‘U-shaped’ glacial valley to a more ‘V-shaped’ fluvial valley down valley where the dominant erosional imprint switches from glacial to non-glacial (fluvial). Profile locations are indicated in (A). (D). Oblique Google Earth™ image of one glacial valley. Note the ‘U-shaped’ cross-section and smooth sides. Orientation of the image is indicated by the blue arrow in (B).
4.2 Marginal moraines
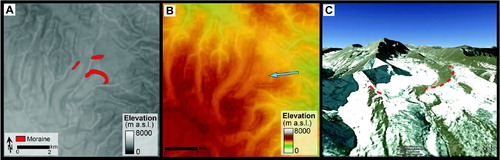
Moraines are ridge-like features composed of material deposited at the margin of a glacier and can be used to identify the maximum extent of past glaciers (). Marginal moraines are approximately 200 m wide and less than 2.0 km long (end to end). They are relatively subdued features that are difficult to identify on the DEM (a and b) and satellite imagery but can be identified using the 3-D view in Google Earth™ imagery (c).
Figure 4. Moraines. (A) Mapped moraines in the Dalijia Shan (see for location). The semi-transparent gray-scale DEM (SRTM) is draped on a gray-scale slope image. (B) Semi-transparent colored DEM (SRTM) draped on a gray-scale slope image (same area as in panel A). (C) Oblique Google Earth™ image of one moraine (red dashed line along the ridge crest). Orientation of the image is indicated by the blue arrow in (B). In the Dalijia Shan moraines are subtle features; the simplest method to identify them is by using the 3-D view in Google Earth™.
5. Map quality and completeness
This map is considered to present a complete and precise record of glacial landforms that are larger than 100–200 m in the Dalijia Shan. In order to assure consistency, landforms were mapped multiple times using the DEMs, satellite imagery, and Google Earth™. Because of the resolution of the data (90 and 30 m DEMs, 30 m satellite imagery), landforms smaller than 100 m are difficult to identify and map. The map is consistent with the field mapping of Li and Pan (Citation1989), except that an additional glacial valley has been identified, and the map presented here does not include small-scale features that are visible in the field and are thus present in the field-based map.
6. Discussion
The distribution of glacial landforms provides an estimate of the minimum extent of maximum glaciation in any area (Heyman et al., Citation2009). In the Dalijia Shan, the entire region was thoroughly searched for the presence of glacial landforms, and they were identified primarily on the high mountainous areas around Dalijia Peak, covering approximately 1.3% (∼140 km2) of the study area. The absence of glacial landforms in many parts of the study area is important for constraining paleoglaciation limits, and the lack of glacial landforms other than moraines and glacial valleys within the glaciated area provides evidence only for simple valley and outlet valley glaciation, in contrast to other areas, such as the Shaluli Shan (Fu et al., Citation2012). The lack of extensive coverage of glacial landforms is inconsistent with the hypothesis of an ice sheet that covered the entire Tibetan Plateau, a conclusion also supported by numerous other studies, reviewed in Heyman et al. (Citation2009, Citation2011).
Based on field mapping, Li and Pan (Citation1989) hypothesized that the Dalijia Shan was covered by an approximately 150 km2 ice cap during the maximum stage of the Last Glaciation. The evidence for the ice cap includes landforms identified on our map, as well as features not visible from the remote sensing such as rouche moutonnees and multiple small marginal and end moraines. Although no distinct glacial landforms in the core region of the hypothesized ice cap can be identified from the remote sensing, the presence of multiple glacial valleys with no cirque source area suggests that these were outlet valleys fed by a former ice cap. The reconstructed minimum extent of maximum glaciation including this ice cap covers <2% (∼200 km2) of the study area. Compared to the minimum extent of maximum glaciation in other mapped regions of the Tibetan Plateau (∼15% in the Shaluli Shan, ∼13% in the Tanggula Shan, and ∼32% in the Bayan Har Shan; Fu et al., Citation2012; Heyman et al., Citation2008; Morén et al., Citation2011), glaciation was much more limited in the Dalijia Shan. Not only is the extent of glaciation more limited but fewer types of glacial landforms were identified from remote sensing imagery in the Dalijia Shan region compared to the Shaluli Shan, Tanggula Shan, and Bayan Har Shan where glacial troughs, hummocky terrain, glacial lineations, scoured terrain, and meltwater channels are all identified (Fu et al., Citation2012; Heyman et al., Citation2008; Morén et al., Citation2011).
The main factors controlling this variation in glacial extent and the nature of the preserved glacial landforms are most likely differences between the study areas in hypsometry and distance to moisture sources (Derbyshire et al., Citation1991; Furbish & Andrews, Citation1984). Temperature decreases with elevation, and this has a significant impact on glacial mass balance. So locations with a hypsometry that includes extensive areas at elevations above the equilibrium line altitude will have more extensive glaciation, all other things being equal (Benn & Evans, Citation2010; Furbish & Andrews, Citation1984). The high point of Dalijia Shan is at 4636 m a.s.l., and there is a high plateau surface covering approximately 175 km2 at an elevation of about 3700–4400 m a.s.l., compared to the Shaluli Shan with a high point at 7556 m a.s.l. (Mt. Gongga) and average elevations ranging from 4000 to 5000 m a.s.l. (Fu et al., Citation2012) and the Bayan Har Shan region with a high point at 6282 m a.s.l. (Anyemaqen Shan) and average elevations range from 4000 to 5000 m a.s.l. (Heyman et al., Citation2008). Glacial mass balance is also controlled by precipitation, and in areas with low precipitation that are far from moisture sources mass balance is lower and glacier extent smaller, all other things being equal. The Dalijia Shan, located in the northeast part of the Tibetan Plateau is approximately 200–400 km further from western or southern moisture sources than the Bayan Har Shan and Shaluli Shan. Thus both the relatively low area of land at high elevations and the larger distance from moisture sources may be factors in explaining why the Dalijia Shan has a much lower percentage of glaciated area than the Bayan Har Shan to the west and the Shaluli Shan to the south.
7. Conclusions
Glacial valleys and marginal moraines in the Dalijia Shan region mapped using remote sensing imagery provide evidence for glacial modification of the landscape dominated by valley glaciers in the mountains and outlet glaciers extending from an ice cap located on the planation surface. Glacial landforms are only found in the region near Dalijia Peak, covering an area of approximately 140 km2 (∼1.3% of the study area). This limited extent of past glaciation in this region may be a result of the relatively low area of land at high elevations and the distance from moisture sources; the Bayan Har Shan to the west and the Shaluli Shan to the south both have a much larger percentage of area that was covered by glaciers (32% and 15%, respectively). In addition the absence of glacial landforms in much of this study region, along with the conclusions from previous studies to the west and south, support the hypothesis of limited high mountain glaciations during previous glacial periods on the Tibetan Plateau, and are inconsistent with a plateau-wide ice sheet hypothesis.
Software
ArcGIS 10.0/9.4 was used to process the DEMs and to perform the mapping. Satellite imagery was processed using ENVI 3.4 to produce the images used during mapping. Google Earth™ software was used for 3-D visualization. Adobe Illustrator CS4 was used to produce the final map.
Supplemental Material
Download PDF (6 MB)References
- Benn, D. I. , and Evans, D. J.A. , 2010. Glaciers & glaciation . London: Elsevier; 2010, 802 p.
- Derbyshire, E. , Shi, Y. , Li, J. , Zheng, B. , Li, S. , and Wang, J. , 1991. Quaternary glaciation of Tibet: The geological evidence , Quaternary Science Reviews 10 (1991), pp. 485–510, doi: 10.1016/0277-3791(91)90042-S.
- Earth Observing System Data and Information System (EOSDIS). (2009). Earth Observing System ClearingHouse (ECHO)/Reverb Version 10.X, Greenbelt, MD: EOSDIS, Goddard Space Flight Center (GSFC) National Aeronautics and Space Administration (NASA). Retrieved February 2012, from: http://reverb.echo.nasa.gov/reverb/#utf8=%E2%9C%93&spatial_map=satellite&spatial_type=rectangle.
- Fu, P. , Heyman, J. , Hättestrand, C. , Stroeven, A. , and Harbor, J. , 2012. Glacial geomorphology of the Shaluli Shan area, southeastern Tibetan Plateau , Journal of Maps 8 (2012), pp. 48–55, doi: 10.1080/17445647.2012.668762.
- Furbish, D. J. , and Andrews, J. T. , 1984. The use of hypsometry to indicate long-term stability and response of valley glaciers to changes in mass transfer , Journal of Glaciology 30 (105) (1984), pp. 199–211.
- GLCF. (2011). Global Land Cover Facility [Online]. Retrieved September 2011, from: http://www.landcover.org.
- GLIMS. (2010). Global Land Ice Measurements from Space. Retrieved March 6, 2012, from: http://www.glims.org/.
- Heyman, J. , Hättestrand, C. , and Stroeven, A. , 2008. Glacial geomorphology of the Bayan Har sector of the NE Tibetan Plateau , Journal of Maps 4 (2008), pp. 42–62, doi: 10.4113/jom.2008.96.
- Heyman, J. , Stroeven, A. P. , Alexanderson, H. , Hättestrand, C. , Harbor, J. , Li, Y. , Caffee, M. W. , Zhou, L. , Veres, D. , Liu, F. , and Machiedo, M. , 2009. Paleoglaciation of Bayan Har Shan, northeastern Tibetan Plateau: glacial geology indicates maximum extents limited to ice cap and ice field scales , Journal of Quaternary Science 24 (7) (2009), pp. 710–727, doi: 10.1002/jqs.1305.
- Heyman, J. , Stroeven, A. P. , Caffee, M. W. , Hättestrand, C. , Harbor, J. , Li, Y. K. , Alexanderson, H. , Zhou, L. P. , and Hubbard, A. , 2011. Palaeoglaciology of Bayan Har Shan, NE Tibetan Plateau: exposure agesreveal a missing LGM expansion , Quaternary Science Reviews 30 (2011), pp. 1988–2001, doi: 10.1016/j.quascirev.2011.05.002.
- Jarvis, A., Reuter, H. I., Nelson, A., & Guevara, E. (2008). Hole-filled seamless SRTM data V4 [Online]. Retrieved September 2011, from http://srtm.csi.cgiar.org.
- Kuhle, M. , 1988. The Pleistocene glaciation of Tibet and the onset of ice ages – An autocycle hypothesis , GeoJournal 17 (4) (1988), pp. 581–595, doi: 10.1111/j.1502-3885.2005.tb01008.x.
- Kuhle, M. , 2004. "The high glacial (Last Ice Age and LGM) ice cover in High and Central Asia". In: Ehlers, J. , and Gibbard, P. L. , eds. Quaternary glaciations – extent and chronology, Part III: South America, Asia, Africa, Australasia, Antarctica New York, NY: Elsevier . 2004. pp. 175–199.
- Lehmkuhl, F. , 1998. Extent and spatial distribution of Pleistocene glaciations in eastern Tibet , Quaternary International 45/46 (1998), pp. 123–134.
- Lehmkuhl, F. , and Owen, L. A. , 2005. Late quaternary glaciation of Tibet and the bordering mountains: a review , Boreas 34 (2005), pp. 87–100, doi: 10.1080/03009480510012908.
- Li, B. , Li, J. , Cui, Z. , Zheng, B. , Zhang, Q. , Wang, F. , Zhou, S. , Shi, Z. , Jiao, K. , and Kang, J. , 1991. Quaternary glacial distribution map of Qinghai-Xizang (Tibet) plateau , Map Scale (1991), 1:3,000,000.
- Li, J., & Pan, B. (1989). Quaternary glaciation in the Dalijia mountain on the northeast border of Qinghai-Xizang Plateau. Journal of Lanzhou University, International Field Workshop on Loess Geomorphological Processes and Hazards, 101–108. May 23–June 5, 1989..
- Mahaney, W. C. , and Rutter, N. W. , 1992. Relative ages of the moraines of the Dalijia Shan, northwestern China , Cantina 19 (1992), pp. 179–191.
- Morén, B. , Heyman, J. , and Stroeven, A. P. , 2011. Glacial geomorphology of the central Tibetan Plateau , Journal of Maps 7 (2011), pp. 115–125, doi: 10.4112/jom.2011.1161.
- Owen, L. A. , 2009. Latest Pleistocene and Holocene glacier fluctuations in the Himalaya and Tibet , Quaternary Science Reviews 28 (2009), pp. 2150–2164, doi: 10.1016/j.quascirev.2008.10.020.
- Owen, L. A. , Finkel, R. C. , Barnard, P. L. , Ma, H. Z. , Asahi, K. , Cafee, M. W. , and Derbyshire, E. , 2005. Climatic and topographic controls on the style and timing of Late Quaternary glaciation throughout Tibet and the Himalaya defined by 10Be cosmogenic radionuclide surface exposure dating , Quaternary Science Reviews 24 (2005), pp. 1391–1411, doi: 10.1016/j.quascirev.2004.10.014.
- Rost, K. T. , 2000. Pleistocene paleoenvironmental changes in the high mountain ranges of central China and adjacent regions , Quaternary International 65/66 (2000), pp. 147–160, doi: 10.1016/S1040-6182(99)00041-5.
- Shen, Y., Kang, J., & Zilliacus, H. L. (1989). Correlation of the ice age and loess deposit sequence in the region of the Mount Dalijia, Gansu, China. Journal of Lanzhou University, International Field Workshop on Loess Geomorphological Processes and Hazards, 109–119. May 23–June 5, 1989..
- Shi, Y. , 2002. Characteristics of late Quaternary monsoonal glaciation on the Tibetan Plateau and in East Asia , Quaternary International 97–98 (2002), pp. 79–91, doi: 10.1016/S1040-6182(02)00053-8.
- Zhou, S. Z. , Li, J. J. , Zhang, S. Q. , Zhao, J. D. , and Cui, J. X. , 2004. "Quaternary glaciations in China". In: Ehlers, J. , and Gibbard, P. L. , eds. Quaternary glaciations – extent and chronology, Part III: South America, Asia, Africa, Australasia, Antarctica New York, NY: Elsevier . 2004. pp. 105–113.