
Abstract
The aim of this paper is to present the spatial distribution of macroseismic intensities assigned in modified Mercalli (MM) scale, across the Greek territory. For this purpose, a digital database with more than 30,000 local seismic intensity recordings from 156 major earthquake events that affected Greece and adjacent areas during the period 1953–2011 was developed. These events have focal depths up to about 150 km and surface-wave magnitudes (Ms) greater than 4.4. Various GIS-based techniques for data analysis and map creation were applied. A number of seismic intensity maps have been produced taking into account different attributes like intensities for shallow or deep events, maximum intensities by administrative units, maximum intensity for significant earthquakes, etc. The main map produced is the national map of maximum seismic intensities for shallow earthquakes (scale 1:1.500.000). The final layout also contains the maximum seismic intensities for deep earthquakes, the tectonic lines of Greece, the earthquakes of the database as well as the seismic intensities for two significant earthquakes in the last six decades.
1. Introduction
Earthquakes account for significant numbers of human casualties and serious damages to structures. The continued probability for the occurrence of large earthquakes, together with growing population, increases the seismic risk in many communities. Seismic risk assessment can be applied to help urban planners, emergency managers, risk managers and public policy/decision makers. Thus, it is critical to understand the impact of earthquakes, to study the effect of mitigation techniques and to incorporate the results into preparedness programs and urban development plans.
Seismic intensity is a numerical value reflecting the effects of earthquakes on human, infrastructures as well as on built and natural environment. Although the development of seismological instruments and instrumental techniques has been notable in the last 100 years, seismic intensities information is a unique and valuable data source for the researcher seismologist, the structural engineer, the earth scientist and the insurance industry. Grünthal defines macroseismic intensity as an evaluation of the severity of ground shaking from an earthquake. This evaluation is based on the observed damages – effects in a limited area (Grünthal, 1998). The knowledge of macroseismic intensities and the visualization of their spatial distribution are of great importance for earthquake hazard analysis and seismic risk studies (Armas, Citation2006; Godermatz et al., Citation2003; Simeonova et al., Citation2006). To evaluate the occurrence of large earthquakes and associated seismic risk, appropriate maps have been published for several countries across the world. These maps have been constructed either on the basis of a good-quality database of original seismic intensities or on the basis of computed synthetic intensities from earthquake catalogues. Among other attempts, Fahmi and Alabbasi (Citation1989) performed seismic intensity zonation in Iraq for the time period 1905–1984. A macroseismic database for the period 1900–1999 has been created by Sovic (Citation1999) for Croatia. Schenk et al. (Citation2000) constructed an earthquake hazard map for the broader area of Czech Republic, Poland and Slovakia in terms of macroseismic intensities and in terms of peak ground accelerations. Miyazawa and Mori (2005) performed maximum intensity mapping for earthquakes in Japan from 1586 to 2004 using together historical records and instrumentally measured intensity data. An earthquake dataset in terms of macroseismic intensities has been used by Secanell et al. (Citation2004) for the purposes of analyzing the seismic hazard in Catalonia-Spain. The mapping of macroseismic intensities in previous works was based on (a) natural neighbor method (n-n method, among others Pettenati et al., Citation1999; Sirovich et al., Citation2002), (b) circular/elliptical models. (Papazachos et al., Citation1982, Citation1997; Shebalin 1974), (c) linear interpolation models (Miyazawa & Mori, 2005) and (d) local polynomials and wavelets method (Brillinger, Citation1996). Additionally, Schenkova et al. (Citation2007) proposed a method for the construction of isoseismal maps after an earthquake event with the Kriging technique.
For Greece, several intensity maps illustrating independent earthquakes are published on a regular basis by the Institute of Geodynamics in its monthly bulletins or by other researchers in the form of atlases (Papazachos et al., Citation1982, Citation1997; Schenkova et al., 2005; Shebalin, 1974). However, the only published attempt to draw a map of macroseismic intensities covering the whole country was that made by Drakopoulos and Makropoulos (1982), who provided a revised maximum intensity map of Greece for the period 1700–1981.
Papanastassiou et al. (2003) and Kalogeras et al. (2004) produced independent databases for macroseismic intensities of strong earthquakes occurring in the broader area of Greece for the needs of the Institute of Geodynamics. In an attempt to visualize the spatial distribution of macroseismic intensities, Schenkova et al. (2005) applied the Kriging method in the latter database to create isoseismal maps for four catastrophic seismic events listed: the 1956 Amorgos (Ms = 7.5), the 1965 Peloponnese (Ms = 6.1), the 1995 Kozani-Grevena (Ms = 6.6) and the 1999 Athens (Ms = 5.9) earthquakes.
The aim of this study is the direct mapping of macroseismic intensities across Greece as well as the development of automatic display methods of earthquake damage effects with the use of GIS techniques. Within this context, intensity values were used from 156 earthquakes located in the broader area of Greece, as routinely observed by the Institute of Geodynamics, National Observatory of Athens, for earthquake damage covering the time period between 1953 and 2011.
2. Material and methods
In about the last 120 years, the National Observatory of Athens (Institute of Geodynamics NOA-GI) has collected macroseismic information with regard to strong earthquakes affecting the broader area of Greece. However, this task was not systematically organized until 1950. During the 1950s, the NOA-GI established a network of villages/towns in the country, to which it distributed questionnaires immediately after each strong earthquake. The questionnaires contained important queries about earthquake effects on individuals, on the natural environment as well as on the built environment that enable a seismologist to evaluate the seismic intensity of the earthquake in all parts of the shaken area. The completed earthquake questionnaires were returned to the NOA-GI, where they were analyzed. Accordingly, the macroseismic intensities (using the Modified Mercalli (MM) Intensity Scale) were assigned on the basis of the effects on each village/town. Furthermore, isoseismal maps were produced for strong earthquakes that affected extensive areas. These descriptions and maps were produced regularly by the staff and published in the Monthly Seismological Bulletins of the NOA-GI.
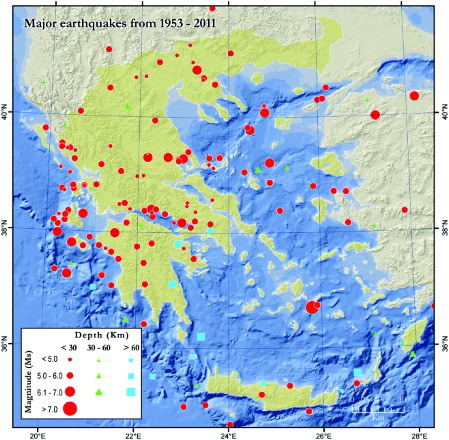
Using the data published in the monthly Bulletins of the NOA-GI Papanastassiou et al. (2003) produced a database for macroseismic intensities of strong earthquakes occurring in the broader area of Greece for the needs of the Institute, covering the period 1953–2001. In the present work, this digital database has been expanded and re-organized. In its current form, this database contains 30,310 intensity records of 156 earthquakes that occurred in Greece and adjacent areas in the period 1953–2011, with depths down to 150 Km and surface magnitudes greater than 4.4. The spatial distribution of these events is displayed in . Although some events occurred outside the Greek territory, they are included in this database, as they strongly affected many areas of Greece. Moreover, a digital database of the geographical coordinates of 3360 villages and towns receiving and responding to the said macroseismic questionnaires was organized. This database is adequate for the purpose of this study. The number of intensities is quite satisfactory; the epicenters of the used earthquakes have a good geographical coverage and satisfactory magnitude distribution, while the majority of the earthquakes have shallow depths.
Figure 1. Spatial distribution of the earthquakes used in this study.
In this work we produced seismic intensity maps of Greece (national scale), by using GIS techniques based on the digital dataset previously described. In order to create the map of maximum intensities of Greece, various methods were tested. It was possible to produce maps by taking into account different values like the maximum intensity, the mean intensity of a number of maximum values, etc. and plot them with different approaches as at every point-village, at the center of a grid (cell size 5 × 5 km) covering Greece or by administrative units (municipalities) as well as to produce different maps according to the distribution of the focal depth.
The general concept of all these methods is based on the effort to estimate values on every location (unmeasured location) of the study area according to the surrounding measured values. The general formula for the interpolators is determined as a weighted summation of the measured data:
where I(so) is the maxIntensity at the predicted location, I(si) is the measured maxIntensity at the ith location, λi is the unknown weight for the measured maxIntensity at the ith location, and N is the number of the measured values. The maxIntensity is the maximum seismic intensity value for each location for the time period under investigation.
The different techniques implemented use the technology of Geographical Information Systems (GIS), which is an advanced and efficient way to tackle and analyze spatial data. The flow diagram of presents the proposed methodology. presents the results of ordinary Kriging interpolation, for shallow events (depth ≤60 km). Kriging is a stochastic method of spatial interpolation, which has been used by other researchers to produce isoseismal maps (Schenkova et al., 2005). Ordinary Kriging is a linear interpolation approach since the estimated values are weighted linear combinations of the available data. Moreover, with ordinary Kriging the error variance is minimized. In this analysis, the spherical isotropic model with searching radius of 180 Km and smoothing factor 0.6 was implemented.
Figure 2. The flow diagram of the proposed methodology.
Figure 3. Maximum intensities map of Greece, shallow events (depth ≤60 km).
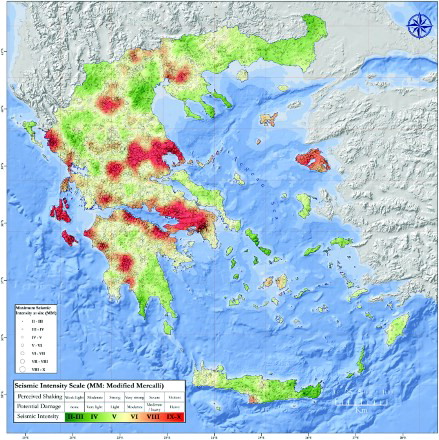
This map of maximum seismic intensities (cellsize: 250 m) was the background of the main map. Upon this background the local maximum seismic intensities were plotted by using the graduated symbols (circles) method. In the same map, a map with active faults of the Greek area (Pavlides et al., 2008) is also included as inset.
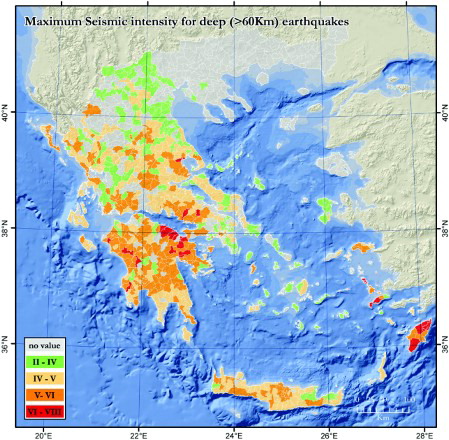
Furthermore, the creation of the maximum seismic intensity map for deep events (depth >60 km) by using Greek municipalities (named ‘Kapodistrias’ plan) as spatial reference unit was attempted. For this purpose, the maximum-recorded intensity value for point-village inside each municipality (polygon) was assigned as the representative maximum intensity value of the municipality. For shallow seismic events a large number of recordings – distributed all over the Greek territory – of maximum intensity was available. On the contrary, deep events are more or less rare in Greece in comparison with shallow events. Thus, for many areas (especially in Northern Greece) there are limited recordings of intensities for the period under investigation. Thus, in order to visualize seismic intensities for deep earthquakes we assigned the maximum recorded values to Greek municipalities and accordingly we visualized maximum intensities with a choropleth mapping approach ().
Figure 4. Maximum intensities map of Greece, deep events (depth ≥ 60 km).
3. Conclusions
As the map of maximum intensities for shallow events shows () during the past 60 years, about 80.5% of the Greek territory experienced MM intensities equal to or greater than V, while an area of 7000 km2, which corresponds to the 5% of the total area of the country, presents intensities between VII and X. Concerning the deep seismic events, for 31% of Greece, intensities greater than V have been reported ().
The spatial distribution of high values of seismic intensities is also shown in the main map. The Ionian Islands (especially Kephalonia, Zakynthos and Ithaca), Western Epirus and Western Peloponnese as well as parts of the Western and Southern Crete are the most seismically active areas of the Greek territory. These areas are located along the active subducting zone of the Hellenic arc. Additionally, significantly high macroseismic intensities for the study period characterized the Lesvos Island to the east, an extensive area around the city of Athens, a large part of Thessaly and the region around the Gulf of Corinth.
The output maps of macroseismic intensities (main map) are a compilation of the observed intensities of past earthquakes showing and as a result, the distributions of the intensities of future earthquakes may be different from these maps. However, macroseismic observations might be easily incorporated in data management systems in order to combine different information such as geological characteristics of the site, type of soil, observed ground accelerations and extract seismic hazard maps.
The compiled intensity maps (main map) expected to be a useful tool intended for the use of local practicing engineers for earthquake – resistance design procedures as rational formulation of engineering decisions in seismically active areas requires quantitative descriptions of seismicity.
Software
The processing of geographic data (spatial database construction, spatial transformations, allocation of seismic intensity measurements, georeferencing) was carried out in ArcGIS 9.3. The advanced spatial analysis (DEM creation, zonal & neighborhood statistics, spatial interpolation, etc.) was implemented in ArcGIS 9.3 with the use of the Spatial Analyst and the Geostatistical Analyst extensions. The maps were designed and created within ArcGIS 9.3 and later polished in Adobe Photoshop 7.
Main Map: Maximum Macroseismic Intensity Map of Greece for the Time Period 1953 - 2011
Download PDF (83.7 MB)Related Research Data
References
- Armas, I. (2006). Earthquake risk perception in Bucarest, Romania. Risk Analysis, 26(5), 1223–1234. doi: 10.1111/j.1539-6924.2006.00810.x
- Brillinger, D. R. (1996). Some uses of cumulants in wavelet analysis. Journal of Nonparametric Statistics, 6(2–3), 93–114. doi: 10.1080/10485259608832666
- Drakopoulos, J., & Makropoulos, K. (1982). Seismicity and seismic hazard evaluation. In: Earthquake risk reduction in the Balkan Region. UNDP Project executed by Unesco in Association with Undro (RER/79/014), Working Group A, Final Report, Seismology, Seismotectonics, Seismic Hazard and Earthquake Prediction.
- Fahmi, K. J., & Alabbasi, N. (1989). Seismic intensity zoning and earthquake risk mapping in Iraq. Natural Hazards, 1, 331–340. doi: 10.1007/BF00134831
- Godermatz, R., Nicolich, R., & Slejko, D. (2003). Seismic risk assessment and GIS technology: Applications to infrastructures in the Friuli-Venezia Giulia region (NE Italy). Earthquake Engineering and Structural Dynamics, 32, 1677–1690. doi: 10.1002/eqe.294
- Grünthal, G. 1998. European Macroseismic Scale 1998. Ed. Conceil de l'Europe, Cahiers du Centre European de Geodynamique et de Seismologie, Luxembourg, Vol.15, p. 99.
- Kalogeras, I., Kourouzidis, M., Schenková, Z., Schenk, V., & Stavrakakis, G. (2004). Macroseismic observations in Greece. Development of a database for extraction of new knowledge, The 29th General Assembly of the ESC book. The 29th General Assembly of the ESC. Abstracts book. September 12–17, 2004, Potsdam, Germany.
- Miyazawa, M., & Mori, J. (2005). Historical maximum seismic intensity maps in Japan from 1586 to 2004: Construction of database and application. Annals of Disas. Prev. Res. Inst., Kyoto Univ., No. 48C:
- Papanastassiou, D., Melis, N., & Stavrakakis, G. (2003). An atlas of macroseismic information for 140 earthquakes occurred in the area of Greece during the Period 1953-2001. National Observatory of Athens, Publ no 14, CD-Rom.
- Papazachos, B. C., Comninakis, P., Hatzidimitriou, P., Kiriakidis, E., Kiratzi, A., Panagiotopoulos, D., Papadimitriou, E., Papaioannou, Ch., Pavlidis, S., & Tzanis, E. (1982). Atlas of isoseismal maps of earthquakes in Greece 1902–1981. Publ. Geophys. Lab. Univ. Thessaloniki, , No 4, 125p
- Papazachos, B. C., Papaioannou, Ch., Papazachos, C. B., & Savvaidis, A. (1997). Atlas of isoseismal maps for strong earthquakes in Greece and surrounding area (426B.C.-1995). Publ. Geophys. Lab. Univ. Thessaloniki, , No 4, 176p
- Pavlides, S., Chatzipetros, A., & Valkaniotis, S. (2008). Active faults of Greece and surroundings. 33rd International Geological Congress, Oslo, 6-8 Aug. 2008.
- Pettenati, F., Sirovich, L., & Cavallini, F. (1999). Objective treatment and synthesis of macroseismic intensity data sets using tessellation. Bulletin of the Seismological Society of America, 89(5), 1203–1213.
- Schenk, V., Schenkova, Z., Kottnauer, P., Guterch, B., & Labak, P. (2000). Earthquake hazard for the Czech Republic, Poland and Slovakia – Contribution to the ILC/IASPEI Clobal Seismic Hazard Assessment Program. Natural Hazards, 21, 331–345. doi: 10.1023/A:1008110506690
- Schenkova, Z., Kalogeras, I., Schenk, V., Pirli, R., Kourouzidis, M., & Stavrakakis, G. (2005). Atlas of isoseismal maps of selected Greek earthquake. Evonymos Ecological Library, Athens. 100p.
- Schenkova, Z., Schenk, V., Kalogeras, I., & Pichl, R. (2007). Isoseismal maps drawing by the kriging method. J. Seismol., 11, 121–129. doi: 10.1007/s10950-006-9023-1
- Secanell, R., Goula, X., Susagna, T., Fleta, J., & Roca, A. (2004). Seismic hazard zonation of Catalonia, Spain, integrating random uncertainties. Journal of Seismology, 8, 25–40. doi: 10.1023/B:JOSE.0000009516.91044.51
- Shebalin, N. (1974). Atlas of isoseismal maps, Part III of the catalogue, UNESCO Scopje.
- Simeonova, S. D., Solakov, D. E., Laydecker, G., Busche, H., Schmitt, T., & Kaiser, D. (2006). Probabilistic seismic hazard map for Bulgaria as a basis for a new building code. Natural Hazards earth Syst. Sci., 6, 881–887. doi: 10.5194/nhess-6-881-2006
- Sirovich, L., Cavallini, F., Pettenati, F., & Bobbio, M. (2002). Natural-neighbor isoseismals. Bulletin of the Seismological Society of America, 92(5), 1933–1940. doi: 10.1785/0120010162
- Sovic, I. (1999). Croatian macroseismic database. Phys. Chem. Earth (A), 24(6), 501–503. doi: 10.1016/S1464-1895(99)00061-7