
Abstract
Carbon accounting is becoming increasingly important in the way it provides a comprehensive perspective of carbon balance from both carbon emission and carbon assimilation. Numerous previous researches have focused on carbon emission inventory, but few have put their effort in estimating the overall carbon balance as well as analyzing its spatial distribution. In this study, the fossil fuel consumption from all end-use sectors was used to estimate the carbon emission, and the carbon assimilation of vegetation was derived from Moderate Resolution Imaging Spectroradiometer net primary production. Then, the carbon emission was integrated with carbon assimilation to estimate carbon balance. The results were presented in five different maps with a scale of 1:1,480,000 and suggested that, in 2009, Wisconsin was able to assimilate its all end-use carbon emissions through the vegetation. In addition, carbon surplus and carbon deficit of Wisconsin demonstrated their respective spatial patterns. The approach can be generalized and applied to other regions to estimate carbon balance.
1. Introduction
Climate change is a hot topic nowadays and has been debated over the recent years. Carbon dioxide (CO2) accounts for nearly 75% of annual anthropogenic greenhouse gas (CitationIntergovernmental Panel on Climate Change, 2007) and has increased from a pre-industrial value of about 280–379 ppm in 2005 (CitationAlley et al., 2007). The gradual and accelerating increase of anthropogenic greenhouse gas has occurred since 1750 and is associated with the slight increase of global temperature. The average temperature of the Earth's surface increased by about 1.4°F (0.8°C) over the past 100 years, with about 1.0°F (0.6°C) of this warming occurring over just the past three decades (CitationAmerica's Climate Choices, 2011). If CO2 emissions were maintained at 1994 levels, its concentration would increase to about 550 ppm by the end of the twenty-first century (CitationChakraborty, Tiedemann, & Teng, 2000). Therefore, the reduction of CO2 emission is required to slow down the increase of global temperature. Current efforts of reducing the CO2 emission include decreasing fossil fuel consumption and increasing carbon sink through forestry activities (CitationAtazadeh, 2011). The Kyoto Protocol of 1997 set up a framework for different countries to reduce the CO2 emission in respective rates based on their development level and industrial activities since industrial revolution (CitationUnited Nations, 1998).
The U.S. Environmental Protection Agency (CitationEPA, 2009) establishes a benchmark of quantifying carbon emission from CO2 over a certain geographic area and time period, which requires methods that can demonstrate spatial distribution of carbon source and carbon sinks through vegetation. The approach of EPA's benchmark had been implemented in previous studies related to carbon emission estimation. There are, however, several issues that have remained unsolved. The first issue is that there is still a debate whether the estimation of carbon emission should be based on energy production or consumption (CitationPeters, 2008; CitationProops, Faber, & Wgenhals, 1993; CitationSteenge, 1999). Previous estimation is often based on energy production instead of consumption (CitationBlasing, Broniak, & Marland, 2005; CitationPétron, Tans, Frost, Chao, & Trainer, 2008; CitationZhao, Horner, & Sulik, 2011). The approach of estimating carbon emission based on energy production is problematic because the production and consumption of fossil fuel are often spatially disparate (CitationRose, Neff, Yarnal, & Greenberg, 2005; CitationWeber & Matthews, 2008). Therefore, the consumption-based estimation facilitates emission reduction and helps to differentiate environmental responsibility between energy producer and consumer (CitationMozner, 2013).The second issue relates to the geographic scale (CitationZhao et al., 2011). Emissions were often estimated at coarse scales such as by city, state or country boundaries, failing to provide explicit spatial interpretation within those units (CitationGregg, Losey, Andres, Blasing, & Marland, 2009; CitationSovacool & Brown, 2010). The third issue is that most of the estimations of carbon balance are still limited to several urban areas and lack of detailed empirical research that combined the interpretation from socioeconomic and ecological backgrounds (CitationPataki et al., 2009; CitationWentz, Gober, Balling, & Day, 2002; CitationZhao et al., 2011). Lastly, the estimation in most previous work did not combine all end-use sectors including industrial, commercial, residential and transportation together, but only focused on one single sector. Therefore, how the energy was consumed in different sectors is not well understood.
Carbon assimilation, on the other hand, is mostly realized via photosynthetic process. In this context, vegetation such as forest plays a very important role in the ecosystem both as a carbon sink and as a source due to their large biomass per unit of area of land (CitationGibbs, Brown, Niles, & Foley, 2007). They can sequestrate the atmospheric carbons through photosynthesis and accumulate them as organic matters (CitationZhao et al., 2011). The carbon can also be released into atmosphere through the plant respiration. Thus, the vegetation can regulate the carbon cycle of the ecosystem both as carbon storage and as a carbon source.
Carbon accounting through carbon balance analysis is very useful in a way it can evaluate carbon emission sources, provide valuable information for carbon trading and facilitate sustainable carbon management (CitationZhao et al., 2011). As an endeavor to conduct the comprehensive carbon balance analysis and explore the possibility of combining socioeconomic data with geographic information system and remote sensing data, the state of Wisconsin was selected as the study site with three primary objectives. The first goal is to investigate the sources of carbon emission from annual fossil fuel energy consumption of Wisconsin in 2009. The second is to calculate the overall carbon emission, carbon assimilation, and the balance between the two aspects on census tract scale by integrating the socioeconomic report of energy consumption and remotely sensed data. The third objective is to map the spatial distribution of carbon balance in Wisconsin and capture the spatial distribution in a way that can explicitly disclose the spatial pattern.
2. Study area and data
Located in the Midwestern USA, Wisconsin is the 23rd state with a total area of 54,157 square miles and the 20th most populous with 5,686,986 inhabitants estimated in 2010 (CitationUnited States Census Bureau, 2010). There is no coal, natural gas, or oil production in Wisconsin; thus; the state spends billions of dollars every year to purchase these energy to meet the energy demand. The energy consumption per capita of Wisconsin in 2005 ranked the 28th in the USA and 1.5 percentage point above the national average level. As of 2007, the carbon dioxide emission increased 22.5% since 1990 (CitationWisconsin Office of Energy Independence, 2009).
In order to calculate the carbon emission from the fossil fuel energy, the study used the Wisconsin Total End-Use Energy Consumption Report of 2009 from Energy Information Administration (CitationEIA, 2010a). The report provided a comprehensive description of variable energy consumption in Wisconsin from different end-use sectors. Since most carbon emission in Wisconsin was related to the utilization of fossil fuel energy, the consumptions of renewable energy such as wind, solar, nuclear and geothermal were not included in the calculation.
Net primary production (NPP) reflects the amount of carbon dioxide vegetation takes in during photosynthesis and that released during respiration. Hence, it plays an important role in interpreting carbon sequestration and climate change (CitationLi, Niu, & Li, 2005). In this study, Moderate Resolution Imaging Spectroradiometer (MODIS) 17A3 version-55 product was used to derive the NPP of Wisconsin in 2009. It is a 16-bit signed integer data set with the fill value maximum of 65,535. The annual NPP from MODIS 17A3 is presented with a 1-km resolution (CitationHeinsch et al., 2003).
In order to assign the NPP result to a specific scale, Census Tract data from Census 2010 were also used. The census tract is a small, relatively permanent geographic unit defined for the population census in the USA. The census occurs every 10 years and each census tract is either defined by local participants or delineated by the United States Census Bureau if it did not exist before due to the lack of local participants. Each tract generally covers a contiguous area with a population size between 1200 and 8000, but its spatial size varies greatly depending on the density of the settlement (CitationUnited States Census Bureau, 2009, Geographic terms and concepts-census tract).
The census tract shape file was acquired via the website of the U.S. Census Bureau. The advantage of using census tract is that the shapefile of each tract was attached with geo-spatial information and related demographic information such as population, population in different ages, numbers of housing units and average household size, which will facilitate data analysis in the following stage.
3. Method
3.1. Estimate carbon emission based on fossil fuel energy consumption
The estimation of carbon emission utilized the generalized approach (CitationNorth Carolina Division of Air Quality, 2009) by combing carbon dioxide emission factor with different energy types:(1)
where
Emission CO2 is the total CO2 emitted from all energy types (ton/year), i the energy type, coal, natural gas, petroleum, electricity from fired power station, Energy i the amount of energy type i consumed on energy basis/volume (MM Btu/Mwh), and C the carbon content factor of carbon dioxide (0.2727).
The CO2 Emission Factors for different energy type (shown in ) was determined by referring stationary combustion guide (CitationEPA, 2008, Table B-3).
Table 1. CO2 Emission Factors by energy type.
In , the measurement of heat energy in fuels (coal, natural gas, and petroleum) is expressed as British thermal unit (Btu), which is equal to 1055 J. The MM Btu represents one million Btu in the table. In the case of electricity consumption, megawatt-hour (Mwh) is used as the unit of measurement, which is equal to one million watt hour or 3600 MJ.
For interstate energy exchange such as electricity, net electricity flow was applied to the calculation by subtracting the electricity flow out of state from the electricity flow into state. The CO2 emission factor for electricity generation was 0.745 ton/Mwh in Wisconsin, which was based on the Voluntary Reporting of Greenhouse Gases Program, Average Electricity Factors by State and Region (CitationEIA, 2002). CO2 Emission Factors for petroleum products exclusive of Distillate fuel oil, Jet fuel, LPG, Motor gasoline, and Residual fuel oil were replaced with average value of different types.
Data for fossil fuel energy consumption were derived from Total End-Use Energy Consumption Report of 2009 by Energy Information Administration (CitationEIA, 2010a). To facilitate the calculation process, unit of energy (shown in ) except electricity was converted into Btu.
Table 2. Fossil fuels consumption of Wisconsin in 2009.
Wisconsin accounts for 20% of paper production nationwide, and paper is one of the leading exports that contributes to the state economy (CitationDeller, 2004). Since paper can be used in state or out of Wisconsin, the energy consumed for the exported paper products needs to be deducted from the overall energy consumption. According to the Wisconsin Blue Book (CitationWisconsin State Legislature, 2011–2012), the paper export value in 2009 was 627,308,000 dollars. In the same year, the export price index for these products was 600 dollars per metric ton (CitationRISI, 2014), so the quantity of exported paper products in 2009 was 1,045,513 tons. shows that the national average energy consumption for annual paper production activities in pulp and paper industry is estimated at the level of 1606.1 Trillion Btu (CitationInstitute of Paper Science and Technology at Georgia Institute of Technology [IPST], 2006), corresponding to the 30,671,916 tons of paper production (CitationThe U.S. Census Bureau, 2012).
Table 3. US pulp and paper industry energy distribution (after CitationIPST, 2006).
During the paper production process, three different source of energy are used: electricity, steam and direct fuel. Natural gas or oil fuel can be the heat source for the steam boilers. On the other hand, the direct fuel here is assumed to be petroleum product using 72.50 kg/MM Btu as the CO2 Emission Factors. Hence, combining and and Equation (1) will allow the calculation of carbon emission during paper production process. Alternatively, the onsite carbon emission () can be estimated from the report of Manufacturing Energy and Carbon Footprint for Forest Products Sector (CitationDepartment of Energy [DOE], 2014). The annual nationwide energy consumption for paper production is estimated around 29,421,306.3 tons.
Table 4. Energy use, loss, and CO2 emission in the forest products sector (after CitationDOE, 2014).
The estimated carbon emission used for exported paper is thus around 1,002,993.5 tons (1,045,513*29,421,306.3/30,671,916 = 1,002,993.5) when applied with the interpolation method.
The carbon emission from fossil fuel energy consumption of Wisconsin in 2009 reached 30 million tons in the estimation by applying the data in and in Equation (1). After deduction of those used for exported paper product, the overall carbon emission equals 29 million tons. According to a report from Shi (Citation2003), population has a significant impact on carbon emission. Therefore, the result of emission was disaggregated to the census tract with the population counts (Map 1).
3.2. Estimate carbon assimilation
The estimation of carbon assimilation was first derived from the NPP from the MODIS 17A3 imagery. Since the urban areas, water bodies and certain wetlands lack the vegetation presence (CitationHeinsch et al., 2003), these areas are eliminated from the MODIS imagery. MODIS product is a 16-bit signed integer data set with a data range maximum of 65,535. In order to convert the data to the unit of kgC/m2, the scale factor of 0.0001 needs to be applied. After the data conversion, zonal statistics in ArcMap was applied in order to aggregate the NPP value to the census tract. The output value in Map 2 for each census tract was assigned as the sum of pixel value located in that tract.
4. Result and discussion
4.1. Description of the map result
There is a high spatial variation of carbon emission across Wisconsin in 2009 (Map 1). When the carbon emission was aggregated to census tracts with population, the data ranged from 3645 to 73,122 tons across Wisconsin, gradually decreasing from southeast to the north and northwest.
The results of carbon assimilation (Maps 2 and 3) demonstrated different spatial patterns compared to carbon emission. It suggested that north and northwest Wisconsin process higher capability of sequestrating CO2 than the southern part of the state. This is due partly to the fact that Chequamegon–Nicolet National Forest is located in north and northwest of Wisconsin (CitationUnited States Department of Agriculture, Forest Service, 1995).
The carbon balance was calculated from the carbon emission subtracting carbon assimilation on the census tract scale. The result was presented in balance per capita (Map 4) and balance per square miles (Map 5). Map 4 is the result when the carbon balance was displayed with population selected for the normalization, while Map 5 is the result when the carbon balance was displayed with size of census tract selected for the normalization. There is a significant difference between the two images. When the result was normalized by population, the carbon surplus (emission exceeding assimilation) was concentrated in the southeast part of Wisconsin. When measured by the census tract area, the carbon surplus was linked with towns or city such as Milwaukee, Madison, Green Bay, Kenosha, Racine, and Appleton. Similar to Map 3, the regions with carbon deficit (assimilation exceeding emission) are located in the north and northwest of the state, where the national forest was situate.
4.2. Correlation between carbon accounting and socioeconomic indicators
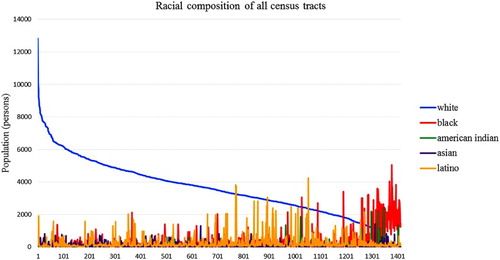
In order to explore the correlation between carbon accounting and socioeconomic indicator such as population and racial component, the total of 1415 tracts were taken from the census data.
As shows, the vast majority of ethnicities in the study area is white, followed by Latino, Black, Asian, and American Indian.
Figure 1. Racial composition of all census tracts.
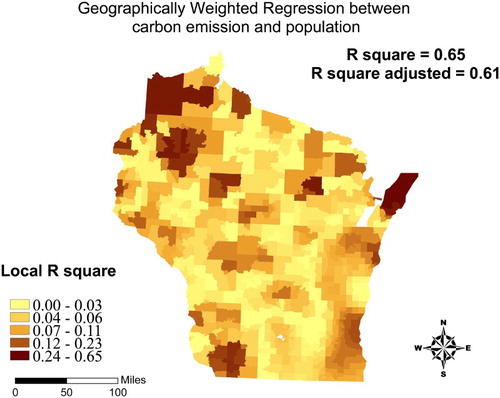
A correlation analysis was conducted between carbon emission and population in the census tract using geographically weighted regression method (). Energy consumption was set as the dependent variable and the population was set as the explanatory variable. The result suggests an overall relatively high correlation between the two components with an R2 of 0.65, which is coincident with the result from Map 1, showing that the carbon emission in Wisconsin was associated with population density and economic activity.
Figure 2. Correlation between carbon emission and population.
4.3. Source of error and uncertainty for the estimation
Uncertainty in the estimation of carbon balance comes from both carbon emission and carbon assimilation. For carbon emission, the data collected in the energy report primarily come from the survey and interview, so the reliability of the data source highly depends on the correctness of the result to the survey provided by the respondents and their understanding to the survey (CitationEIA, 2010b). Underestimated energy consumption will decrease the value of carbon emission. Similar errors also come from the estimation of the energy consumption for the exported paper product since the data are reported from multiple sources.
For carbon assimilation, the uncertainty comes primarily from the NPP analyzing. NPP can differentiate the carbon dioxide taken during the photosynthesis and released during the respiration, but it has limited capability of detecting the carbon dioxide released by other material, such as soil, litter, or deadwood. According to the report from CitationNilsson and Schopfhauser (1995), about 20% of above-ground forest biomass is eventually sequestered in soils, litter, and below-ground biomass in the absence of complete land-use conversion. Therefore, there are additional carbon sink source, such as soil, which were not identified in the analysis, and these will decrease the value of carbon assimilation and increase the value of carbon balance. In addition, because the vegetation in urban and wetland areas were eliminated from the data, the estimated carbon assimilation is lower than the actual amounts in the study area.
5. Conclusion
Through the study, it was found that Wisconsin could assimilate its all fossil fuel end-use carbon emissions (29 million tons) via the sequestration from vegetation (35 million tons) within the state according to the estimates in 2009. The carbon emission was estimated by combining fossil fuels consumption from all end-use sectors and eliminating those consumed for exported paper products, whereas the carbon assimilation was calculated via the NPP from MODIS 17A3 imagery. By integrating carbon emission and carbon assimilation, the carbon balance analysis identified that southeast Wisconsin has carbon surplus and higher carbon emission, whereas north and northwest Wisconsin have carbon deficit and lower carbon emission. The spatial pattern of carbon balance reflects the industrial activities and carbon footprint in Wisconsin. The approach in this study is applicable and can be extended to other geographic scale along with other socioeconomic data for carbon accounting analysis.
A geographic approach to carbon accounting of Wisconsin
Download PDF (7.9 MB)Acknowledgements
The authors highly appreciate Tingting Zhao and Chunrong Jia for their valuable comments and suggestions on the earlier version of the manuscript, and Michael Siegel for the suggestion for refining the map layout.
Disclosure statement
No potential conflict of interest was reported by the author(s).
References
- Alley, R., Berntsen, T., Bindoff, N. L., Chen, Z., Chidthaisong, A., Friedlingstein, P., … Wratt, D. (2007). The fourth assessment report of the intergovernmental panel on climate change: Climate change 2007: The physical science basis. Geneva: Intergovernmental Panel on Climate Change.
- America's Climate Choices. (2011). Washington, DC: The National Academies Press.
- Atazadeh, I. (2011). Biomass and remote sensing of biomass, (262 pages). InTech. doi:10.5772/939
- Blasing, T. J., Broniak, C., & Marland, G. (2005). State-by state carbon dioxide emissions from fossil fuel use in the United States 1960–2000. Mitigation and Adaptation Strategies for Global, Change, 10, 659–674. doi: 10.1007/s11027-005-6471-9
- Chakraborty, S., Tiedemann, A. V., & Teng, P. S. (2000). Climate change: Potential impact on plant diseases. Environmental Pollution, 108, 317–326. doi: 10.1016/S0269-7491(99)00210-9
- Deller, S. (2004). Wisconsin and the agricultural economy. Department of Agricultural and Applied Economic Staff Paper No.471, 1–29. Retrieved November 10, 2011, from http://www.aae.wisc.edu/pubs/sps/pdf/stpap471.pdf
- Department of Energy. (2014). Manufacturing energy and carbon footprint for forest products sector (NAICS 321, 322). Retrieved November 5, 2011, from http://www1.eere.energy.gov/manufacturing/pdfs/energy_use_and_loss_and_emissions_forest.pdf
- Energy Information Administration. (2002). Voluntary reporting of greenhouse gases program, average electricity factors by state and region. Retrieved November 15, 2012, from http://www.eia.gov/oiaf/1605/ee-factors.html
- Energy Information Administration. (2010a). Total end-use energy consumption estimates, 1960–2010, Wisconsin. Retrieved November 15, 2012, from http://www.eia.gov/beta/state/seds/data.cfmincfile¼/state/seds/sep_use/tx/use_tx_WI.html&sid=WI
- Energy Information Administration. (2010b). Consumption technical notes. Retrieved November 15, 2012, from http://www.eia.gov/state/seds/sep_use/notes/use_technotes_2010.pdf
- Gibbs, H. K., Brown, S., Niles, J. O., & Foley, J. A. (2007). Monitoring and estimating tropical forest carbon stocks: Making REED a reality. Environmental Research Letters, 2, 1–13.
- Gregg, J. S., Losey, L. M., Andres, R. J., Blasing, T. J., & Marland, G. (2009). The temporal and spatial distribution of carbon dioxide emissions from fossil fuel use in North America. Journal of Applied Meteorology and Climatology, 48, 2528–2542. doi: 10.1175/2009JAMC2115.1
- Heinsch, F. A., Reeves, M., Votava, P., Kang, S., Milesi, C., Zhao, M., … Bowker, C. F. (2003). User's guide: GPP and NPP (MOD17A2/A3) products NASA MODIS land algorithm. Retrieved November 15, 2012, from http://www.ntsg.umt.edu/sites/ntsg.umt.edu/files/modis/MOD17UsersGuide.pdf
- Institute of Paper Science and Technology at Georgia Institute of Technology. (2006). Pulp and paper industry energy bandwidth study, 1–115. Retrieved November 15, 2013, from http://energy.gov/sites/prod/files/2013/11/f4/doe_bandwidth.pdf
- Intergovernmental Panel on Climate Change. (2007). Climate 2007: Synthesis report. Geneva: Author.
- Li, S. H., Niu, Z., & Li, B. C. (2005). Study on remote sensing process model of vegetation NPP. Research of Soil and Water Conservation, 12(3), 126–127.
- Mozner, Z. V. (2013). A consumption-based approach to carbon emission accounting – sectoral differences and environmental benefits. Journal of Cleaner Production, 42, 83–95. doi: 10.1016/j.jclepro.2012.10.014
- Nilsson, S., & Schopfhauser, W. (1995). The carbon-sequestration potential of a global afforestation programme. Climatic Change, 30, 267–293. doi: 10.1007/BF01091928
- North Carolina Division of Air Quality. (2009). Greenhouse gas emission guidelines: Stationary combustion source. Retrieved November 14, 2012, from http://daq.state.nc.us/monitor/eminv/forms/Stationary_Combustion_Sources.pdf
- Pataki, D. E., Emmi, P. C., Forster, C. B., Mills, J. I., Pardyjak, E. R., Peterson, T. R., … Dudley-Murphy, E. (2009). An integrated approach to improving fossil fuel emissions scenarios with urban ecosystem studies. Ecological Complexity, 6, 1–14. doi: 10.1016/j.ecocom.2008.09.003
- Peters, G. P. (2008). From production-based to consumption-based national emission inventories. Ecological Economics, 65(1), 13–23. doi: 10.1016/j.ecolecon.2007.10.014
- Pétron, G., Tans, P., Frost, G., Chao, D., & Trainer, M. (2008). High-resolution emissions of CO2 from power generation in the USA. Journal of Geophysical Research-Biogeosciences, 113(G4): G04008, 1–9. doi: 10.1029/2007JG000602
- Proops, J. L. R., Faber, M., & Wgenhals, G. (1993). Reducing CO2 emissions. Berlin: Springer-Verlag.
- RISI. (2014). A monthly monitor of the North American graphic paper market, 1–35. Retrieved November 15, 2013, from http://www.risiinfo.com/Marketing/EA/ExcerptsforWeb/Ptrd0111.pdf
- Rose, A., Neff, R., Yarnal, B., & Greenberg, H. (2005). A greenhouse gas emissions inventory for Pennsylvania. Journal of the Air and Waste Management Association, 55, 1122–1133. doi: 10.1080/10473289.2005.10464714
- Shi, A. (2003). The impact of population pressure on global carbon dioxide emissions, 1975–1996: Evidence from pooled cross-country data. Ecological Economics, 44, 29–42. doi: 10.1016/S0921-8009(02)00223-9
- Sovacool, B. K., & Brown, M. A. (2010). Twelve metropolitan carbon footprints: A preliminary comparative global assessment. Energy Policy, 38(9), 4856–4869. doi: 10.1016/j.enpol.2009.10.001
- Steenge, A. E. (1999). Input-output theory and institutional aspects of environmental policy. Structural Change and Economic Dynamics, 10(1), 161–176. doi: 10.1016/S0954-349X(98)00064-2
- The U.S. Census Bureau. (2012). The statistical abstract of 2012. Retrieved November 13, 2012, from https://www.census.gov/compendia/statab/2012/tables/12s0894.pdf
- U.S. Environmental Protection Agency. (2008). Stationary combustion guide. Retrieved October 20, 2012, from http://www.epa.gov/climateleadership/documents/resources/stationarycombustionguidance.pdf
- U.S. Environmental Protection Agency. (2009). Inventory of U.S. greenhouse gas emissions and sinks: 1990–2007. Retrieved October 20, 2012, from http://www.epa.gov/climatechange/emissions/usinventoryreport.html
- United Nations. (1998). Kyoto protocol to the United Nations framework convention on climate change. New York, NY: United Nations.
- United States Census Bureau. (2009). Geographic terms and concepts-census tract. Retrieved October 20, 2012, from http://www.census.gov/geo/reference/gtc/gtc_ct.html
- United States Census Bureau. (2010). 2010 census. Retrieved October 20, 2012, from http://factfinder2.census.gov/faces/tableservices/jsf/pages/productview.xhtml?src=bkmk
- United States Department of Agriculture, Forest Service. (1995). Wisconsin's national forests: Pocket guide.
- Weber, C. L., & Matthews, H. S. (2008). Quantifying the global and distributional aspects of American household carbon footprint. Ecological Economics, 66, 379–391. doi: 10.1016/j.ecolecon.2007.09.021
- Wentz, E. A., Gober, P., Balling, R. C., & Day, T. A. (2002). Spatial patterns and determinants of winter atmospheric carbon dioxide concentrations in an urban environment. Annals of the Association of American Geographers, 92(1), 15–28. doi: 10.1111/1467-8306.00277
- Wisconsin Office of Energy Independence. (2009). 2008 Wisconsin energy statistics highlights. Retrieved November 1, 2012, from http://energyindependence.wi.gov/docview.asp?docid=15822&locid=160
- Wisconsin State Legislature. (2011). Wisconsin Blue Book 2011–2012, 628–635. Retrieved November 10, 2012, from http://legis.wisconsin.gov/lrb/bb/11bb/Stats_Commerce.pd
- Zhao, T., Horner, M. W., & Sulik, J. (2011). A geographic approach to sectoral carbon inventory: Examining the balance between consumption-based emissions and land-use carbon sequestration in Florida. Annals of the Association of American Geographers, 101(4), 752–763. doi: 10.1080/00045608.2011.567936