
Abstract
The Laguna Blanca basin is a rhomb-shaped basin located at the SE margin of the Puna plateau in the southern Central Andes (Catamarca, Argentina). An interactive analysis using remote sensing and field mapping enabled us to produce a geo-structural map at a 1:350,000 scale. Satellite images from multispectral sensors (ASTER and Landsat 7 ETM+) and medium resolution Digital Elevation Models (SRTM and ASTER GDEM) were used in order to recognize the structures and main lithologies, which were validated in the field and through laboratory tests (e.g. spectral analysis). The final result is a geo-structural map of the Laguna Blanca basin with a new geological unit subdivision, highlighting its tectonic origin, which appears to be related to a releasing stepover along N-S sinistral strike-slip master faults.
1. Introduction
The Laguna Blanca basin (26°35′S–67°20′W) is located in the southern Central Andes, along the southeastern margin of the Puna plateau, in the Catamarca Province (Argentina). This area is characterized by a semi-arid climate, which is particularly good for satellite remote sensing and geological mapping purposes. The Laguna Blanca basin is a prominent 20 km-long by 15 km-wide rhomb-shaped basin with a flat floor at an altitude of 3400 m, bound by high morphological ridges on the western and eastern sides (with altitudes reaching about 6000 and 4200 m, respectively). The Laguna Blanca basin is bound by two prominent steep fault segments, which seem to have influenced the basin morphology. These deformation structures, along with the relevant topographical gradient, suggest a tectonic origin for the basin. The presence of similar basins in this sector of the Puna plateau, which is dominated by Eocene to Recent E-W crustal shortening (CitationAllmendinger, Jordan, Kay, & Isacks, 1997), has been associated with local transtension along orogen-parallel sinistral strike-slip faults (e.g. Salina del Fraille pull-apart basin, CitationDooley & McClay, 1997). Such kinematics along N-S striking faults is apparently not coherent with the ENE–WSW convergence between the Nazca and South America plates and several models have been proposed to explain this unexpected behaviour (CitationMarrett & Strecker, 2000; CitationRiller, Cruden, Boutelier, & Schrank, 2012; CitationRiller & Oncken, 2003). Therefore, it is of paramount importance to clarify the geometries, kinematics and genesis of intermontane transtensional basins in the Andean belt, in order to disentangle such a long debated issue. The structural investigation and mapping of the Laguna Blanca, which is bounded by N-S striking faults, is in line with this major aim.
Despite the Southern Central Andes having been extensively studied for mining purposes (e.g. Farallòn Negro, CitationCarrizo et al., 2003) and volcanological analyses (e.g. Cerro Galan Caldera, CitationFolkes et al., 2011), there are still few published geological maps of the study area. At present, the most detailed is from the early 1970s at a 1:200,000 scale (CitationTurner, 1973), while a recent geological sketch, including the Laguna Blanca area, appears in the work of CitationFolkes et al. (2011). None of these products report a detailed structural framework of the Laguna Blanca and to date there are no geological maps of the area in which the volcanic successions are subdivided into specific volcanic complexes, as is normally present in modern geological maps of volcanic areas (e.g. CitationSchiavo et al., 2007; CitationSherrod, Sinton, Watkins, & Brunt, 2007). Indeed, our geo-structural map of the Laguna Blanca provides a detailed identification of the fault structures as well as a revised lithological subdivision, in which volcanic products are related to specific volcanic complexes. This has allowed us to clarify several significant aspects of the genesis and evolution of the basin, including the relationships between major faults, basin morphology and localization of volcanic centres.
2. Methods
2.1. Field mapping and sampling
The field survey was focused on key sectors, which were identified after a first interpretation of the satellite images based on their apparent structural or lithological complexity. The main exposed lithologies in the study area were sampled, collecting both fresh and altered rock surfaces for spectroscopic and petrographic analyses. The analytical results were useful to drive further image processing and finalize the geological map.
2.2. Spectroscopic analysis
A Varian Cary 5000 spectrometer was used to retrieve the spectral signatures of both fresh and weathered sample surfaces. This spectrometer detects the hemispheric reflectance, with a wavelength range from 0.35 to 2.5 μm and 1 nm sampling interval. The acquired high-resolution spectral signatures were of fundamental importance during the ASTER processing phase. In fact, as reported in recent studies of semi-arid (eastern Anti-Atlas of Morocco, CitationMassironi et al., 2008) and mountain areas (Himalaya of Western Nepal, CitationBertoldi et al., 2010), the analysis of rock spectral signature is crucial to better understanding the spectral behaviour of different lithologies, evaluating the possible presence of desert varnish coatings and outlining lithological contacts in metamorphic and igneous terrain.
2.3. ASTER image-processing
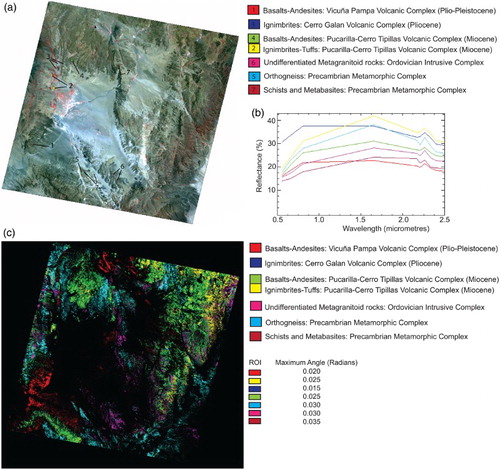
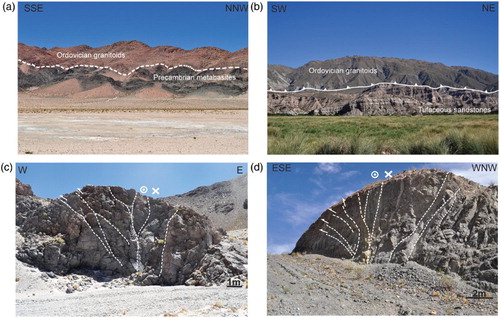
ASTER images were principally used for compositional and lithological analyses, since they have a better spectral resolution compared to the Landsat 7 ETM+ data. After a pre-processing phase (radiometric calibration, Short-Wave InfraRed – SWIR – bands resampling to 15 m/pixel and Fast Line of sight Atmospheric Analysis of Spectral Hypercubes – FLAASH – atmospheric correction), particular attention was given to mapping different lithologies, using false colour composites (Red Green Blue – RGB – 731 and 941), Band Ratios (BR) (BR 2/1, 7/8, 9/8), Relative absorption Band-Depths (RBD) (RBD 6 and 7) and Spectral Angle Mapper (SAM) classification (CitationKruse et al., 1993) ( and ). The high-resolution spectral signatures of samples collected in the field and resampled at the ASTER sensor resolution enabled us to identify the ASTER bands for BR and RBD products. For example, BRs 7/8 and 9/8 were applied to identify those lithologies containing chlorite, biotite, amphibole, as band 8 is characterized by a Fe/Mg–OH vibrational absorption band, typical of these minerals; whereas, RBD 6 [(5+7)/6] is centred on an Al–OH vibrational absorption peak and it is useful to enhance aluminium phyllosilicate minerals (e.g. muscovite) (other examples are commented in ). The laboratory spectra were also applied for SAM classification, but in this case spectral signatures retrieved from specific regions of interest (ROI) and directly derived from the ASTER image at field checked sites were much more effective in lithology discrimination ().
Figure 1. (a) ASTER RGB 731 false colour composite; (b) ASTER BR 2/1, underlining with high value (light grey) lithologies with surface oxides alteration; (c) ASTER RGB 941 false colour composite; (d) ASTER BDR 7 [(6+8)/7] showing with low value (dark grey) lithologies with Al–OH phyllosilicates. Cb = basaltic–andesitic lava flows (Vicuña Pampa volcanic complex), icg = ignimbrites (Cerro Galan volcanic complex), cvm-i = ignimbrites-tuffs (Pucarilla–Cerro Tipillas volcanic complex), cvm-c = basaltic–andesitic lava flows (Pucarilla–Cerro Tipillas volcanic complex), lgo = leucogranitoid rocks (Ordovician intrusive complex), go = undifferentiated metagranitoid rocks (Ordovician intrusive complex), gb = orthogneiss (Precambrian metamorphic complex), smb = Schist and metabasite (Precambrian metamorphic complex).
![Figure 1. (a) ASTER RGB 731 false colour composite; (b) ASTER BR 2/1, underlining with high value (light grey) lithologies with surface oxides alteration; (c) ASTER RGB 941 false colour composite; (d) ASTER BDR 7 [(6+8)/7] showing with low value (dark grey) lithologies with Al–OH phyllosilicates. Cb = basaltic–andesitic lava flows (Vicuña Pampa volcanic complex), icg = ignimbrites (Cerro Galan volcanic complex), cvm-i = ignimbrites-tuffs (Pucarilla–Cerro Tipillas volcanic complex), cvm-c = basaltic–andesitic lava flows (Pucarilla–Cerro Tipillas volcanic complex), lgo = leucogranitoid rocks (Ordovician intrusive complex), go = undifferentiated metagranitoid rocks (Ordovician intrusive complex), gb = orthogneiss (Precambrian metamorphic complex), smb = Schist and metabasite (Precambrian metamorphic complex).](/cms/asset/95f90e49-d2d8-4c95-8f8d-c253693678ae/tjom_a_1035557_f0001_c.jpg)
Figure 2. (a) ASTER RGB 321 false colour composite with locations of the ROIs used for the SAM classification. (b) ROIs spectra at the ASTER sensor resolution. (c) SAM classification based on ROIs spectra, with the specific threshold angles for each class (lower angles correspond to higher spectral matching).
2.4. Landsat image-processing
Landsat 7 ETM+ images were used for the structural analysis, because of their high spatial resolution (30 m/pixel for VNIR-SWIR bands and 15 m/pixel for the panchromatic band). Prominent tectonic lineaments were identified on sharpened Landsat images. Image sharpening is a process, which allows to enhance RGB false colour composites up to the resolution of the Landsat 7 ETM+ panchromatic band (15 m/pixel). In particular, our structural analysis was mainly based on sharpened 742 false colour composites, which represents the best false colour composite to enhance silicate rocks (Mg/Al–OH in silicate absorption peak at band 7), vegetation (high reflectance in band 4) and oxides (absorption in band 2).
2.5. Digital terrain models
Two medium resolution digital terrain models (DTM) were used: the Shuttle Radar Topography Mission (SRTM) DTM (90 m spatial resolution and ∼16 m vertical accuracy) and the ASTER GDEM, which were generated using ASTER stereo-pair images (30 m spatial resolution and 10–25 m vertical accuracy). In this work, the DTMs supplied the main topographic reference for the mapping and were used, as well as the sharpened Landsat images, for the identification of the major structural elements. In particular, several hillshade models were created in order to emphasize different features according to their strike with the use of different solar azimuths and elevation angles.
2.6. Meso-structural analysis
During the field survey, meso-structural data were collected for analysing the major fault zones that limit the Laguna Blanca basin. For each analysed site, identified by means of satellite image interpretation, we measured fault-slip data (strike and dip of fault planes and slickenlines) and Riedel-type kinematic indicators (CitationTchalenko, 1970; CitationPetit, 1987). The measured sites are indicated on the Main Map and the related fault-slip data plots are reported.
2.7. Stress inversion
The fault-slip data measured during the meso-structural analysis were used to retrieve local principal compressive paleostress axes through stress-inversion methods. The software used for the inversion was WinTensor 3.0.0 (CitationDelvaux et al., 1997; CitationDelvaux & Sperner, 2003), which allows the application of both classical inversion methods (e.g. Right Dihedra method) and iterative inversion procedure defined as the Rotational Optimization method (CitationDelvaux & Sperner, 2003). The latter was chosen to perform the inversion, the results of which are displayed to the right of the geo-structural map. A general NW–SE to NNW–SSE orientation of the nearly horizontal maximum principal compressive stress axis (σ1) has been derived for the N-S striking faults, which delimit the Laguna Blanca basin to the eastern (sites 4, 5, 6) and western sides (site 2). This principal compressive stress axis orientation is consistent with sinistral strike-slip kinematics inferred for these faults on the base of field observations. On the other hand, a sinistral transtensional regime has been retrieved in the basinal area within the N-S left-stepping master faults (sites 1, 3). Therefore, in the study area we observe a permutation between the maximum (σ1) and intermediate (σ2) principal compressive stress axes, proceeding from the N-S master faults (σ1 sub-horizontal, σ2 sub-vertical) towards the basin interior (σ2 sub-horizontal, σ1 sub-vertical), while the minimum principal compressive stress axis (σ3) generally lies along a NE-SW trend, as is similarly reported by CitationZhou, Schoenbohm, and Cosca (2013) for an adjacent area.
3. Lithological units
The lithological units reported on our geological map are generally inspired by the Laguna Blanca sheet at 1:200,000 (CitationTurner, 1973). However, Turner's work is not totally consistent with more recent publications on adjacent areas (CitationAllmendinger, 1986; CitationFolkes et al., 2011) and has shown major discrepancies with our fieldwork observations. In particular, the Turner map: (i) clearly overestimates the metasedimentary rocks with respect to the intrusive and metavolcanic ones, (ii) reports an outdated differentiation of Neogene–Quaternary volcanic units, which does not take into account volcanic complex subdivisions, and (iii) overestimates the andesitic products over the basaltic ones. For this reason, we devised a new legend, where the bibliographical information has been harmonized with fieldwork and remote sensing (). Particular attention has been paid in relating the volcanic products to their emission centres. For example, lava flows associated spatially and genetically to the Vicuña Pampa caldera emission centre were classified as the Vicuña Pampa Volcanic Complex.
Table 1. Stratigraphy of the Laguna Blanca area as reported in this work (right column) and in CitationTurner (1973) (left column). Central column reports the stratigraphy of the southeastern border of the Puna plateau, as described by CitationAllmendinger (1986). Dashed line represents age hiatus. See the text for detailed information on the relationship between different subdivisions. Punaschotter, Los Rastrojitos Formation and Famabalasto Formation do not outcrop in the mapped area.
In general, the study area is characterized by a low-grade metamorphic Precambrian basement, intruded by Ordovician metagranitoid rocks. These rocks are unconformably covered by a volcano–sedimentary sequence of Miocene age, followed by volcanic and volcanoclastic rocks of Upper Miocene to Plio-Pleistocene age.
3.1. Precambrian metamorphic complex
The Precambrian metamorphic complex is characterized by a greenschist facies metamorphic imprint and is subdivided into (i) Schist and metabasite, which are described by CitationTurner (1973) as the Loma Coral Formation () and (ii) Orthogneiss, including augen gneiss. CitationAllmendinger (1986) defines this metamorphic basement as lower Paleozoic or/and upper Precambrian schists and gneisses principally of sedimentary origin ().
3.2. Ordovician intrusive complex
The Precambrian metamorphic complex is intruded by prominent granitoid bodies ((a)) defined as the Ordovician intrusive complex. In this complex we distinguished (i) undifferentiated metagranitoid rocks (granites, grano-diorites and diorites), including undeformed rocks, as well as foliated rocks and localized mylonites and minor (ii) leucogranitoid rocks. These granitoid rocks have yielded Rb/Sr whole rock ages of about 475 Ma (CitationAllmendinger, 1986; CitationOmarini, Viramonte, Cordani, Salfity, and Kawashita, 1984). CitationTurner (1973) defines this intrusive complex as the Chango Real Formation and associates it to a Precambrian age ().
Figure 3. (a) Lithological contact between Precambrian metabasites and Ordovician granitoid rocks; (b) Ordovician granitoid rocks overthrusting Tuffaceous sandstones (El Cajon formation) in the SE sector of the study area; (c) Positive flower structure in basaltic lava flows of the Vicuña Pampa volcanic complex; (d) Positive flower structure in Precambrian orthogneiss.
3.3. Volcano–sedimentary complex (Miocene–Pliocene)
In the study area, the Volcano–sedimentary complex outcrops to the SE and it is overthrusted by the Precambrian metamorphic complex and the intrusive Ordovician complex ((b)). In CitationTurner (1973) and CitationAllmendinger (1986) the volcano–sedimentary complex is defined as the El Bolsòn group; it consists of continental sedimentary rocks with volcanic intercalations and is subdivided into three units, renamed in this study as:
Sandstone and conglomerate (Miocene), among which arcosic sandstone prevails, represent the basal unit of the El Bolsòn group (defined as Calchaquense by CitationGonzàlez Bonorino, 1950, the El Morterito formation by CitationTurner, 1973 and the Lower unit by CitationAllmendinger, 1986);
Tuffs and volcanic breccias (Miocene) represent the intermediate unit of the El Bolsòn group and were described by CitationTurner (1973) as the El Aspero formation and by CitationAllmendinger (1986) as the Volcanic unit;
Tuffaceous sandstone (Pliocene) are the upper unit of the El Bolsòn group, which were defined as Araucanense by CitationGonzàlez Bonorino (1950), the El Cajon formation by CitationTurner (1973) and the Upper unit by CitationAllmendinger (1986).
3.4. Neogene to Quaternary volcanic complexes
The Pucarilla–Cerro Tipilla volcanic complex (Miocene) (CitationFolkes et al., 2011) outcrops in the northern part of the mapped area and includes basaltic and andesitic lava flows intercalated with dacitic ignimbrites and tuffs, probably contemporaneous with the El Aspero formation.
The Cerro Galan volcanic complex (Pliocene) (CitationFolkes et al., 2011) consists of dacitic ignimbrites that were clearly distinguishable from the ignimbrites and tuffs of the Pucarilla–Cerro Tipilla volcanic complex in the remote sensing analysis, because of the typical crystal field absorption band due to iron in silicates.
All ignimbrites and tuffs exposed in the Laguna Blanca area are indicated as the Laguna Blanca Formation (dacitic tuffs) in CitationTurner (1973).
The Vicuña Pampa volcanic complex (Pliocene-Pleistocene?) consists of a series of basaltic and andesitic lava flows surrounding a wide caldera located in the SW sector (Vicuña Pampa Caldera). CitationTurner (1973) describes these flows as andesitic flows of the Negro Caranchi Formation (Early Quaternary) ().
4. Structural framework
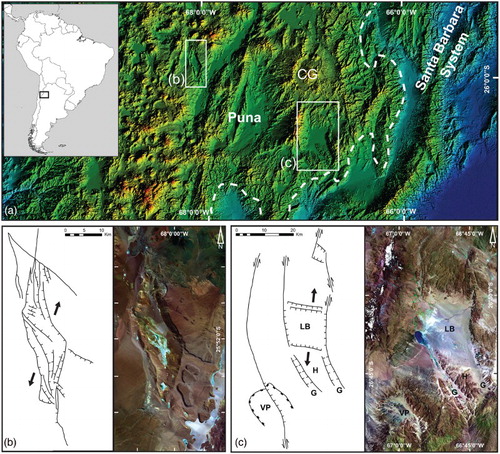
The South Central Andean plateau is characterized by three sets of major faults having N-S (orogen-parallel), NW–SE and NE–SW orientations (CitationAllmendinger, 1986; CitationMarrett & Strecker, 2000; CitationRiller & Oncken, 2003). The Neogene tectonic activity of these faults is still a debated topic. According to a first model (CitationMarrett & Strecker, 2000), the fault sets were generated at different times due to polyphase compressional tectonics, probably reflecting a change in plate convergence (from NW–SE to ENE–WSW), which occurred at about 4 Ma. Alternatively, a second model supports a heterogeneous deformation of the upper crust and a simultaneous activation of these differently oriented faults (CitationRiller & Oncken, 2003; CitationRiller et al., 2012). Among these fault sets, the more prominent ones in the Laguna Blanca area are N-S striking faults extending for tens of kilometres. These orogen-parallel structures, frequently set on pre-Neogene elements (i.e. northerly trending Paleozoic deformation belts and normal faults of the Cretaceous rifting phase), were activated during the Neogene principally as reverse faults (CitationRiller & Oncken, 2003). Nevertheless, the sinistral strike-slip component on orogen-parallel faults has also been inferred, as in the case of the N-S striking faults delimiting the Salina del Fraille pull-apart basin (CitationDooley & McClay, 1997), at about 140 km NW of the Laguna Blanca basin ((a) and (b)). The analysis of meso-structural data collected in the Laguna Blanca field records sinistral transpressional kinematics for N-S striking faults, which appears compatible with a general NW–SE to NNW–SSE-oriented sub-horizontal maximum compressive stress axis. The results obtained on faults cutting the Precambrian basement and the Paleozoic granitoid rocks (sites 4, 5, 6) are consistent with those of faults affecting the Plio-Pleistocene basalts (site 2; (c)). This suggests a common strike-slip-dominated deformation lasting up to recent times. Moreover, the sinistral strike-slip kinematics on the N-S trending faults is confirmed by macroscopic evidence, such as the offset of the margins of the Vicuña Pampa caldera, which appears shifted and lowered to the NE along a releasing bend of the westernmost strike-slip fault ((c)).
Figure 4. (a) Digital elevation model of the southern Puna Plateau, showing the relative location of the Laguna Blanca basin (c), the Salina del Fraille pull-apart basin (b), Cerro Galan (CG) and the Puna plateau eastern margin (white dashed line). (b) Structural scheme of Salina del Fraille modified from Dooley and McClay (Citation1997) (left), Landsat 8 OLI image: 742 sharpened RGB (right); (c) Structural scheme of the study area (left), Landsat 7 ETM+ image: 742 sharpened RGB (right). LB = Laguna Blanca basin, VP = Vicuña Pampa Caldera, H = Horst, G = Graben.
5. Quaternary landforms and deposits
The Laguna Blanca basin, at an elevation of about 3400 m, is limited to the west by the Sierra Laguna Blanca (5700 m of elevation on average) and to the east by an elongated ridge with an average elevation of 4200 m. The rhombic shape of the basin and the strong topographic gradient between the basin floor and the surrounding ridges suggest a tectonic origin.
The Quaternary deposits mainly consist of alluvial and colluvial unconsolidated deposits, mostly sands and silts. In particular, the Laguna Blanca basin is characterized by the presence of two large alluvial fans that expand from the SW and NE corners of the basin towards the centre. Both the alluvial fans appear to be related to captures of ephemeral streams, which originally flowed southwards and northwards, respectively (). This process may be due to the development of depocentres at the opposite SW and NE ends of the basin, as described by CitationMann, Hempton, Bradley, and Burke (1983) for rhomboid pull-apart basins along sinistral strike-slip master faults (). At the foot of the ridges, which bind the western and eastern side of the basin, talus slopes and debris fans have accumulated. Aeolian deposits, such as dune fields and loess accumulation are frequent in the Laguna Blanca plain and in localized depressions. The semi-arid climate of the area is responsible for the accumulations of salt (salar) corresponding with lagoons, which are affected by strong evaporation processes.
Figure 5. Comparison between the location of alluvial fans in the Laguna Blanca basin and the deeps developed at the distal ends of a rhomboic pull-apart basin, according to the continuum model of pull-apart basin development by CitationMann et al. (1983), (modified from CitationDooley & Schreurs, 2012). Black arrows indicate stream captures.
6. Conclusions
The geo-structural map of the Laguna Blanca basin reports in detail fault structures and lithological units and introduces a modern differentiation of the volcanic units, here attributed to specific volcanic complexes. The field-mapping was integrated with remote sensing analysis of multispectral satellite images and medium resolution DTMs (SRTM and ASTER GDEM). In addition, the spectroscopic analysis allowed us to retrieve the spectral signatures of the main lithologies, which were fundamental for driving the ASTER processing (BR, RBD and SAM classification). Moreover, particular attention was paid to the identification and mapping of major faults, enabling us to clarify the tectonic origin of the basin, which appears to be related to a releasing stepover along N-S sinistral strike-slip master faults.
Software
The geological map, hillshaded DTMs and image sharpening of Landsat 7 ETM+ images were produced with Esri ArcGis 9.3. The pre-processing of ASTER and Landsat 7 ETM+ images and the processing of ASTER images were performed with Envi 4.7. Stress inversion of fault kinematic data was produced using WinTensor 3.0.0 (CitationDelvaux et al., 1997; CitationDelvaux & Sperner, 2003).
GEO-STRUCTURAL MAP OF THE LAGUNA BLANCA BASIN (SOUTHERN CENTRAL ANDES, CATAMARCA, ARGENTINA)
Download PDF (88.8 MB)Acknowledgements
This research has been supported by the Cooperation Initiatives and Outgoing mobility under Bilateral Agreements between the University of Padova and the Universidad Nacional de Tucumán. We thank Adolfo Antonio Gutierrez for his invaluable contributions during field investigations, Dario Visonà for his help in petrological analysis, Leonardo Tauro for thin section preparation and Sandra Speed, who improved the English text. We acknowledge U. Riller and P. Mann, for their fruitful reviews that greatly improved the manuscript, and H. Apps and J. Cron for their helpful comments on the map.
Disclosure statement
No potential conflict of interest was reported by the authors.
References
- Allmendinger, R. W. (1986). Tectonic development, southeastern border of the Puna Plateau, northwestern Argentine Andes. Geological Society of American Bulletin, 97, 1070–1082. doi: 10.1130/0016-7606(1986)97<1070:TDSBOT>2.0.CO;2
- Allmendinger, R. W., Jordan, T. E., Kay, S. M., & Isacks, B. L. (1997). The evolution of the Altiplano-Puna Plateau of the Central Andes. Annual Review of Earth and Planetary Sciences, 25, 139–174. doi: 10.1146/annurev.earth.25.1.139
- Bertoldi, L., Massironi, M., Visonà, D., Carosi, R., Montomoli, C., Naletto, G., & Pelizzo, M. G. (2010). Mapping the Buraburi granite in the Himalaya of Western Nepal: Remote sensing analysis in a collisional belt with vegetation cover and extreme variation of topography. Remote Sensing of Environments, 115(5), 1129–1144. doi: 10.1016/j.rse.2010.12.016
- Carrizo, R., Chernicoff, C. J., Ferpozzi, L., Godeas, M., González, O., Gozalvez de Valoy, M., … Zappettini, E. O. (2003). Evaluación Geológico-Minera de las mineralizaciones en la concesión YMAD, Catamarca. Servicio Geologico Minero Argentino.
- Delvaux, D., Moeys, R., Stapel, G., Petit, C., Levi, K., Miroshnichenko, A., … Sankov, V. (1997). Paleostress reconstructions and geodynamics of the Baikal region, Central Asia. Part II: Cenozoic rifting. Tectonophysics, 282, 1–38. doi: 10.1016/S0040-1951(97)00210-2
- Delvaux, D., & Sperner, B. (2003). Stress tensor inversion from fault kinematic indicators and focal mechanism data: The TENSOR program. In D. Nieuwland (Ed.), New insights into structural interpretation and modelling (Vol. 212, pp. 75–100).London: Geological Society. Special Publications.
- Dooley, T., & McClay, K. R. (1997). Analog modeling of pull-apart basins. AAPG Bulletin, 81(11), 1804–1826.
- Dooley, T. P., & Schreurs, G. (2012). Analogue modelling of intraplate strike-slip tectonics: A review and new experimental results. Tectonophysics, 574–575, 1–71. doi: 10.1016/j.tecto.2012.05.030
- Folkes, C. B., Wright, H. M., Cas, R. A. F., De Silva, S. L., Lesti, C., & Viramonte, J. G. (2011). A re-appraisal of the stratigraphy and volcanology of the Cerro Galán volcanic system, NW Argentina. Bulletin of Volcanology, 73, 1427–1454. doi: 10.1007/s00445-011-0459-y
- González Bonorino, F. (1950). Geología y petrografía de las hojas 12d (Capillitas) y 13d (Andagala) (Vol. 70, p. 100). Buenos Aires: Dirección General de Industria Minería Boletín.
- Kruse, F. A., Lefkoff, A. B., Boardman, J. W., Heidebrecht, K. B., Shapiro, A. T., Barloon, P. J., & Goetz, A. F. H. (1993). The spectral image processing system (SIPS) – interactive visualization and analysis of imaging spectrometer data. Remote Sensing of the Environment, 44, 145–163. doi: 10.1016/0034-4257(93)90013-N
- Mann, P., Hempton, M. R., Bradley, D. C., & Burke, K. (1983). Development of pull-apart basins. Journal of Geology, 91, 529–554. doi: 10.1086/628803
- Marrett, R., & Strecker, M. R. (2000). Response of intracontinental deformation in the central Andes to the late Cenozoic reorganization of South American Plate motions. Tectonics, 19, 452–467. doi: 10.1029/1999TC001102
- Massironi, M., Bertoldi, L., Calafa, P., Visonà, D., Bistacchi, A., Giardino, C., & Schiavo, A. (2008). Interpretation and processing of ASTER data for geological mapping and granitoids detection in the Saghro massif (eastern Anti-Atlas, Morocco). Geosphere, 4, 736–759. doi: 10.1130/GES00161.1
- Omarini, R. H., Viramonte, J. G., Cordani, U., Salfity, J. A., & Kawashita, K. (1984). Estudio geocronológico Rb/Sr de la Faja Eruptiva de la Puna en el sector de San Antonio de los Cobres, provincia de Salta, in Actas, Congreso Geológico Argentino, 9th, Volumes 3/7: S. C. de Bariloche, Argentina, 146–158/488.
- Petit, J. P. (1987). Criteria for the sense of movement on fault surfaces in brittle rocks. Journal of Structural Geology, 9, 597–608. doi: 10.1016/0191-8141(87)90145-3
- Riller, U., Cruden, A. R., Boutelier, D., & Schrank, C. E. (2012). The causes of sinuous crustal-scale deformation patterns in hot orogens: Evidence from scaled analogue experiments and the southern Central Andes. Journal of Structural Geology, 37, 65–74. doi: 10.1016/j.jsg.2012.02.002
- Riller, U., & Oncken, O. (2003). Growth of the central Andean Plateau by tectonic segmentation is controlled by the gradient in crustal shortening. Journal of Geology, 111, 367–384. doi: 10.1086/373974
- Schiavo, A., Taj Eddine, K., Algouti, A. H., Benvenuti, M., Dal Piaz, G. V., Eddebbi, A., … Visonà, D. (2007). Carte Géologique du Maroc au 1/50000, feuille Imtir. Notes et Mém. Serv. Géol. Maroc, n° 518 bis.
- Sherrod, D. R., Sinton, J. M., Watkins, S. E., & Brunt, K. M. (2007). Geologic Map of the State of Hawaìi: US Geological Survey Open-File Report 2007-1089, 83 p., 8 plates, scales 1:100.000 and 1:250.000, with GIS database.
- Tchalenko, J. S. (1970). Similarities between shear zones of different magnitudes. Geological Society of America Bulletin, 81, 1625–1640. doi: 10.1130/0016-7606(1970)81[1625:SBSZOD]2.0.CO;2
- Turner, J. C. M. (1973). Descripcion geologica de la Hoja 11d, Laguna Blanca, escala 1: 200.000. Sevicio Nacional Minero Geologico, Boletin 142.
- Zhou, R., Schoenbohm, L. M., & Cosca, M. (2013). Recent, slow normal and strike-slip faulting in the Pasto Ventura region of the southern Puna Plateau. Tectonics, 32, 19–33. doi: 10.1029/2012TC003189