
Abstract
The former Newfoundland Ice Sheet was situated on the fringes of the northeast Atlantic Ocean during the Wisconsinan glaciation (∼80–10 ka BP). Its geographic position indicates that it was likely to have been influenced by a number of external and internal forcing mechanisms including configuration changes in the Laurentide Ice Sheet with which it converged during the last glacial maximum, ice streams, changes in oceanic circulation and fluctuating sea levels. This makes Newfoundland a key location for investigating the dynamic response of ice sheets to these types of internal and external drivers. An established methodology for investigating ice sheet dynamics is to use the landform record to reconstruct the dynamic behaviour and configuration of the ice sheet. This provides a relative chronology of former ice sheet events during glacial cycles. A fundamental requirement of this approach is a detailed glacial geomorphology map that records the spatial distribution of individual subglacial bedforms across the former ice sheet bed. This paper presents a new subglacial bedform map of the Island of Newfoundland. It was produced as part of a mapping programme which used 10 m resolution Satellite Pour l'Observation de la Terre satellite imagery, Shuttle Radar Topography Mission and Canadian Digital Elevation Data. The map records the spatial distribution of ∼126,000 individually mapped glacial lineations and ribbed moraines and extends the number and spatial extent of each landform across the island. It is a new data set which has the potential to provide important insights into former ice sheet behaviour in this region.
1. Introduction
Reconstructing the configuration and dynamic behaviour of palaeo-ice sheets is important because it provides new insights into how former ice sheets responded to both internal and external drivers in the past (CitationCarlson & Winsor, 2012; CitationGreenwood & Clark, 2009a, Citation2009b; CitationKleman & Borgström, 1996). This approach has shown that ice sheets can have relatively fast response times which raises concerns about the future stability of the Greenland and Antarctic ice sheets and how they will respond in a warming world (CitationKhan et al., 2014; CitationPritchard, Arthern, Vaughan, & Edwards, 2009; CitationShepherd & Wingham, 2007). Of particular concern is the potential contribution that melt water from both ice sheets will have on global sea levels and the impacts this will have on coastal communities if sea level continues to rise (e.g. CitationBrysse, Oreskes, O'Reilly, & Oppenheimer, 2013; CitationOppenheimer & Alley, 2004). However, predicting their future trajectory is difficult, given the long timescales involved in ice sheet evolution. In this regard, palaeo-glaciological reconstructions are important because they allow us to examine the dynamic behaviour of ice sheets through full glacial cycles. This information has added to our understanding of the internal and external forcing mechanisms that control former ice sheet stability (e.g. CitationBoulton, Dongelmans, Punkari, & Broadgate, 2001; CitationClark, Knight, & Gray, 2000; CitationGlasser & Jansson, 2005; CitationGreenwood & Clark, 2009a, Citation2009b; CitationKleman, Hättestrand, Borgstrom, & Stroeven, 1997). The location of the former Newfoundland Ice Sheet (NIS) (∼28–10 ka BP) may be of significance in this regard. It was situated on the fringes of the North Atlantic Ocean and the much larger Laurentide Ice Sheet (LIS) which was centred over North America during the Wisconsinan glaciations (∼80–10 ka BP; CitationCatto, Scruton, & Ollerhead, 2003). Palaeo-ice sheets in the Amphi-North Atlantic are now known to have been sensitive to changes in ocean circulation and sea level (CitationClark, McCabe, Bowen, & Clark, 2012; CitationMcCabe & Clark, 1998).Therefore, given its location and relatively small size (∼110,000 sq. km), it is likely that the NIS may also have responded to similar external forcing mechanisms.
During the last glacial cycle, the North American Ice Sheet Complex stretched across virtually all of Canada and into the northern parts of the USA. This ice complex comprised a number of ice sheets that included the LIS, the Cordilleran and Innuitian ice sheets, the Canadian Maritime Provinces Ice Cover and the NIS. These latter two, known collectively as the Appalachian Ice Complex, maintained independent ice centres through much of the last glacial cycle (CitationDyke, 2004; CitationDyke et al., 2002). The LIS formed the central parts of the North American Ice Sheet Complex and during its maximum extent (∼27 14C ka BP and ∼24 14C ka BP; CitationDyke et al., 2002) coalesced with the smaller regional ice sheets including the NIS with the convergence zone being along Newfoundland's northern and western margins (; CitationDyke, 2004; CitationGrant, 1989, Citation1994; CitationKleman et al., 2010; CitationStokes, Tarasov, & Dyke, 2012). A southward ice flow from Labrador crossed the Strait of Belle Isle onto northern parts of the Great Northern Peninsula, while further to the south, the LIS advanced as far as the Long Range Mountains before being deflected into the Gulf of St. Lawrence (CitationBrookes, 1982; CitationCatto, 1998; CitationGrant, 1977, Citation1989; CitationPutt, Bell, Batterson, & Smith, 2010; CitationShaw et al., 2006; CitationTucker, 1974). At this time, the NIS is understood to have maintained a complex of local ice caps with ice cover having advanced to the continental shelf (CitationDyke et al., 2002; CitationShaw, 2003, Citation2006; CitationShaw et al., 2006). At maximum ice extent, a number of large ice streams were well established in the marine sectors of the LIS and Atlantic Canada (CitationKleman & Glasser, 2007; CitationShaw et al., 2006; CitationStokes et al., 2012). Marine-based ice streams such as the Laurentian Channel Ice Stream, which was partially fed by terrestrial ice streams from the NIS is thought to have heavily influenced the configuration, dynamics and decay of the both the LIS and NIS in this region (CitationDyke & Prest, 1987; CitationKleman & Hättestrand, 1999; CitationShaw et al., 2006; CitationStokes & Clark, 2001; CitationStokes et al., 2012). CitationShaw et al. (2006) argue that major deep water calving events initiated in the Laurentian Channel Ice Stream just before 14 ka, and possibly correlated with Heinrich 1, resulted in early ice retreat and separation of the NIS from the LIS. By 12 ka, the NIS margins had become land based with the LIS having retreated into southern Labrador leaving the Strait of Belle Isle ice-free. These events caused significant configuration changes in the NIS with migration of primary ice centres and subsequent separation of the NIS into at least 15 isolated ice caps with final disintegration of the NIS occurring just after 10 ka (CitationGrant, 1974; CitationShaw et al., 2006). Previous research on the glacial history of the NIS confirms that it was influenced by both configuration changes in the LIS and climatic events in the wider Amphi-North Atlantic over relatively short timescales making Newfoundland an ideal location for investigating how ice sheets respond to a range of external and internal drivers.
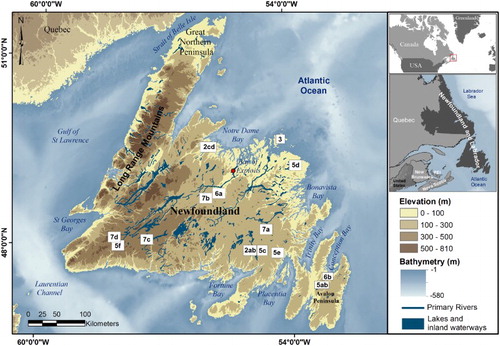
Figure 1. The mapped area encompasses the entire terrestrial landscape of Newfoundland (∼110,000 sq. km) which forms part of the Canadian Province of Newfoundland and Labrador. The landform examples mentioned in the text are labelled with numbered boxes showing the figure locations.
Mapping and interpreting the glacial geomorphological record is an established tool for reconstructing past glacial environments and provides the primary data set required for the glacial inversion approach to reconstruct the extent, configuration, dynamic behaviour and decay of former ice sheets (e.g. CitationBoulton & Clark, 1990; CitationClark, 1999; CitationGreenwood & Clark, 2009b; CitationKleman, 1994; CitationKleman & Borgström, 1996; CitationKleman et al., 1997). The essential prerequisite to this technique is the creation of a detailed glacial geomorphology map that provides information on the spatial distribution of individual glacial landforms across the former ice sheet bed. Maps that record individual landforms are essential because they allow users to identify and unravel the complex flow patterns and geometries, such as cross-cutting assemblages that are observed in palimpsest glacial landscapes (e.g. CitationClark et al., 2000; CitationGreenwood & Clark, 2009a; CitationJansson, Kleman, & Marchant, 2002; CitationKleman, 1992; CitationTrommelen, Ross, & Ismail, 2014). Currently, the only published glacial map that covers the entire island of Newfoundland is the 1:5,000,000 scale Glacial Map of Canada (CitationPrest, Grant, & Rampton, 1968) which is available to download from the Geological Survey of Canada. Although this map provides a good overview of landform distribution, its scale restricts its use for identifying the complex ice flow patterns and regional scale variability which is fundamental for accurate palaeo-glaciological reconstructions (CitationKleman & Borgström, 1996).
2. Glacial landform mapping in Newfoundland
A long history of glacial research in Newfoundland, dating back to the 1800s, has used the geological and geomorphological record as a means to decipher former ice sheet behaviour (e.g. CitationBell, 1884; CitationMilne, 1876; CitationMurray, 1882). Despite this, there is currently no detailed glacial geomorphological map recording the spatial distribution of individual subglacial landforms across Newfoundland. This contrasts with the considerable detail of landform mapping and subsequent ice sheet reconstructions carried out for other palaeo-ice sheets, for example, the LIS (CitationBoulton & Clark, 1990; CitationClark et al., 2000; CitationKleman et al., 2010).
Although detailed mapping of individual subglacial bedforms in Newfoundland has been carried out in a number of location, the study areas are spatially fragmented and therefore provide only snap shots of portions of the former ice sheet bed (e.g. CitationFisher & Shaw, 1992; CitationGrant, 1970, 1989, Citation1994; CitationMarich, Batterson, & Bell, 2005). Ongoing regional mapping programmes by the Geological Survey of Newfoundland and Labrador (GSNL), along the1:50,000 National Topographic System (NTS) map areas, are beginning to address this shortfall. This work combines surficial geology mapping using aerial photography and field verification, till geochemistry sampling and palaeo-ice flow mapping derived from striae evidence and supplemented by landform mapping (e.g. CitationBatterson & Taylor, 2009; CitationBatterson, Taylor, Bell, Brushett, & Shaw, 2006; CitationBrushett, 2012; CitationSmith, 2012; CitationTaylor, Bell, Brushett, & Shaw, 2009). Landform data collected as part of these regional mapping programmes are available from the Geoscience Atlas maintained by the Newfoundland and Labrador Department of Natural Resources. This online resource provides links to detailed surficial geology maps, access to geoscience data sets, maps and reports with mapped landforms available for download in shapefile format (CitationHonarvar, Nolan, Crispy-Whittle, & Morgan, 2013). Although this work by the GSNL has provided excellent detailed reports and surficial geology maps for many sectors, the current landform record still remains spatially incomplete. While this is an important resource, the partial subglacial bedform record limits its use when attempting to reconstruct the ice flow pathways and behaviour of the entire ice sheet bed.
Traditionally, research in Newfoundland has used surficial geology, striation mapping and clast provenance studies to establish the former ice flow patterns across the landscape (e.g. CitationBatterson & Catto, 2001; CitationCatto, 1998; CitationSt. Croix & Taylor, 1991, Citation1992). The preferred approach taken by the GSNL to delineate former ice flow direction in Newfoundland has been to use striae evidence. Striae mapping programmes by the GSNL are ongoing, with an online database of ∼11,800 striae measurements currently available from the Geoscience Atlas (CitationTaylor, 2001) with data being continuously updated as new work is completed. Although striae are important indicators of ice flow direction, in areas where striae measurements are limited, their use in identifying ice flow patterns at the system scale can be restricted as interpretation of ice flow patterns from spatially distributed striae sites may not be representative of regional ice flow patterns (CitationClark & Meehan, 2001; CitationClark et al., 2004, Citation2000; CitationKleman, 1990). This contrasts with the greater areal coverage provided by using the full landform record which can be mapped relatively quickly using a remote sensing approach (CitationBoulton & Clark, 1990; CitationGreenwood & Clark, 2009a; CitationKleman, 1994). The availability of this striae database is, however, a significant resource. In addition to providing supporting evidence of former ice flow direction, cross-cutting striae measurements recorded across the island can be integrated as part of an ice sheet reconstruction to aid interpretation of the relative chronologies of former ice flow events (e.g. CitationJansson et al., 2002; CitationKleman et al., 2010). Other research approaches have employed Shuttle Radar Topography Mission (SRTM) data to carry out landform mapping in the region. For example, CitationLiverman, Batterson, and Bell (2006) carried out a broad scale assessment of regional ice flow patterns, while CitationBlundon, Bell, and Batterson (2010) used SRTM to identify potential ice stream tracks. Others have used this approach at a reconnaissance level to identify ‘areas of interest’ prior to carrying out field research or aerial photography mapping (e.g. CitationBatterson & Taylor, 2009; CitationPutt et al., 2010).
This synthesis has highlighted that although there is a significant history of glacial landform mapping in Newfoundland with detailed local scale observations in many areas across the island, current landform information remains incomplete. The existing record has been based on a variety of mapping approaches from a number of researchers with mapping generally conducted for the purposes of drift prospecting and mineral exploration rather than for palaeo-glacial reconstructions. To date, no detailed systematic mapping approach has been taken across the entire island to identify individual glacial landforms that are essential to facilitate a comprehensive reconstruction of the spatial and temporal behaviour of this ice sheet throughout its evolution during the last glacial cycle.
To address this deficit, this paper presents a new glacial geomorphological map showing the distribution of individual subglacial bedforms across the island of Newfoundland (Main Map). A top-down approach using SPOT satellite imagery and Digital Elevation Models (DEMs) was employed to systematically map the glacial geomorphology of Newfoundland to provide a new primary database of glacial landforms for the region.
3. Methods
A number of data sets were used to inform the mapping programme which was performed entirely within a Geographic Information System (GIS). The following sections discuss the data used and the mapping approach taken to produce the final Main Map, which is located within meridians 60°W and 52°W and parallels 46°N and 52°N and encompasses the entire terrestrial landscape of the island of Newfoundland ().
3.1. Primary data
The primary data used in the mapping programme included SPOT Satellite imagery and two DEMs, all of which provided full coverage of the island of Newfoundland (). SPOT orthoimagery was downloaded and false colour composites were constructed using 20 m resolution bands 1, 2 and 3 (green, red and near infrared bands, respectively). These were pan-sharpened using the panchromatic band to provide 10 m resolution multispectral data. The DEMs used were 0.75 arc second Canadian Digital Elevation Data (CDED) and 90 m SRTM data. The CDED DEM tiles were downloaded in ASCII format, converted to raster and mosaiced to produce a seamless DEM of the island. SRTM tiles covering the island were downloaded as GeoTIFFs and mosaiced to produce a second seamless DEM. The SRTM data were generally used to identify larger scale landforms (typically > 1 km) and was used in areas where poor-quality CDED data resulted in a stair-step effect in some areas of low relief. The Universal Transverse Mercator (UTM) projection in reference to NAD83 was chosen as the base projection for all the data. Although Newfoundland crosses UTM zones 21 and 22, the majority of the Island lies within Zone 21; therefore, all data were projected in UTM Zone 21.
Table 1. Properties of primary data used for landform mapping.
3.2 Ancillary data
A number of additional data sets were used to aid landform interpretation. This included consulting previously published maps and using additional GIS database layers of bedrock geology, structural geology, and surficial geology (). These GIS layers were used to help differentiate between glacial lineations formed in bedrock and those formed in areas of glacial drift which are more likely to be drumlins as opposed to glacially streamlined bedrock landforms ().The digital striation database also provided independent evidence of ice flow orientation which helped to reduce any potential misinterpretation, for example, flow transverse landforms being classified as flow parallel ones (CitationSmith & Knight, 2011). Striae evidence was also used in areas of bedrock that had a streamlined appearance on the imagery to confirm that this region had experienced former ice flow in the orientation of the long axis of the streamlined bedrock (CitationRoberts & Long, 2005) ( and ).
Figure 2. Demonstration of how surficial geology GIS layers helped to differentiate between glacially moulded bedrock and depositional glacial lineations, such as drumlins: (a) cross-cutting glacial lineations on SRTM data; (b) the same geographic extent as (a) with the 1:250 k surficial geology map draped on top. The surficial geology layer indicates that this area consists primarily of till, therefore suggesting that landforms mapped here are more likely to be of depositional origin and as such have been classed as drumlins (yellow arrows indicate the presence of cross-cutting drumlins with two separate ice flow events being observed, a north to south flow and a NNE to SSW flow); (c) a streamlined landscape with drumlinoid features evident on the SRTM data. The matched image in (d) shows the 1:50 k surficial geology overlaid on the SRTM data and indicates this region to be predominantly bedrock (exposed bedrock or bedrock concealed by vegetation). Glacial lineations mapped in bedrock areas are considered more likely to be of erosional origin and therefore have been classified as glacially moulded bedrock lineations. (For area locations, see Boxes 2ab and 2cd in ).
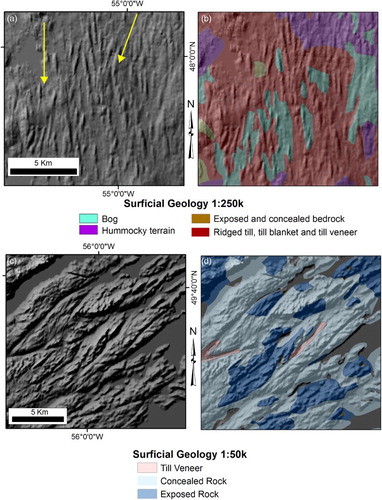
Figure 3. Both striation measurements and surficial geology data aided identification of areas of former ice flow and enabled categorisation of mapped landforms. The images display the same geographic extent of Fogo Island off the northeast coast of Newfoundland. The SRTM shaded relief image in (a) shows evidence of linear features across the island, which gives the landscape a streamlined appearance. Striae evidence in (b) indicates that this region experienced former ice flow (denoted by location of purple arrows with arrow indicating direction of flow). The 1:50 k surficial data in (c) allow for the identification of till-dominated or bedrock areas (Coastline has been inserted in black on the image to outline the coast as mapped on the SRTM imagery). (d) By using both striation evidence and surficial geology data, lineations mapped in exposed or concealed rock have been categorised as glacially moulded bedrock lineations, while those in areas of till are categorised as being of depositional origin, that is, drumlins, as illustrated in (d). (Box 3 in ). (Surficial geology and striation data from Newfoundland and Labrador Department of Natural Resources GeoScience Atlas OnLine: Available from: http://gis.geosurv.gov.nl.ca/).
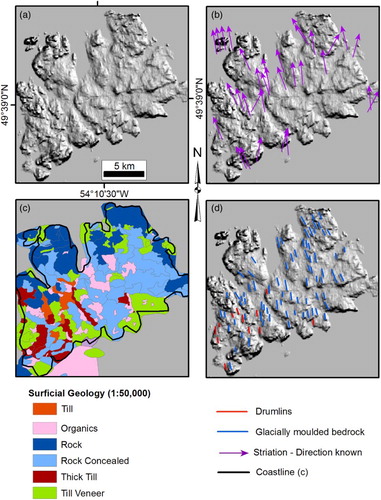
Figure 4. In order to aid detection of subglacial landforms using a remote sensing approach, a variety of image manipulation approaches can be used. These can effectively enhance the representation of landforms within the imagery, thereby improving landform detection rates. The figure presents some key aspects which are of significance and the approaches which were taken as part of the mapping programme to aid detection and delineation of subglacial landforms. Integral to the remote sensing approach to landform mapping is the need to minimise the potential of misinterpretation error. While it may not always be possible to carry out field verification, certain practices can be used to enable correct identification and add support to interpretation during mapping. The figure describes some methods which were used to limit error in landform interpretation as part of the mapping programme.
Table 2. Ancillary data.
3.3. Mapping approach
The Main Map was compiled using a systematic province-wide mapping programme based on the visual interpretation of the satellite imagery and the DEMs, with the mapping being completed by one observer to reduce observer variability (CitationSmith & Clark, 2005). Four types of subglacial landforms were identified and mapped. These were either streamlined in the direction of ice flow and included depositional glacial lineations (drumlins and crag and tails), glacially moulded bedrock lineations and drumlinoid hills with the fourth type being ribbed moraines which form transverse to ice flow. A table showing the criteria used in the interpretation and mapping of subglacial landforms is provided as .
Table 3. Characteristics and diagnostic criteria of subglacial landforms.
In order to improve landform detection and to avoid the known problem of azimuth biasing (CitationClark & Meehan, 2001; CitationHillier et al., 2014; CitationSmith, Clark, & Wise, 2001), various shaded renditions of the DEMs, including non-azimuth images, were consulted during the mapping process. A vertical exaggeration of 3x and 5x was used for all shaded reliefs with the exception of zero azimuth renditions with solar elevation being set at 30° as low angle solar elevation is considered the most effective for aiding landform detectability (CitationSmith et al., 2001). Visualisation of the data was carried out either on a stand-alone basis or by combination viewing, for example, using the SPOT data on its own, viewing DEMs on their own or by combination viewing in which the SPOT imagery was draped onto the DEMs. Draping SPOT data over shaded relief images provided topographic context and tone and texture variation to the 2D satellite imagery, which helped to identify subtle, or low-profile landforms (CitationJansson & Glasser, 2005). This approach can alleviate some of the limitations of mapping by shaded relief alone, for example, differentiation of bedrock and drift landforms (CitationGreenwood & Kleman, 2010). A variety of adjustments in contrast were tested and applied consistently to enhance both landform detectability and delineation. A repeat pass approach at a range of scales between 1:6,000 and 1:150,000 was employed systematically and province wide. This ensures that mapping is frequently re-evaluated, enables consistent cartographic homogeneity, reducing mapping bias and achieving a good representation of landform patterns, including more subdued and smaller scale landforms which may be significant in the detection of subtle fluctuations in ice sheet geometry (CitationClark & Meehan, 2001; CitationJansson & Glasser, 2005; CitationSmith & Wise, 2007; CitationSmith et al., 2001). Systematic island-wide quality control checks, using ancillary data sources ( and ), were employed throughout the mapping programme, for example, surficial geology data to differentiate depositional glacial lineations from glacially moulded bedrock lineations; and striae data to verify flow orientation. A synopsis of protocols used to aid identification and interpretation of subglacial landforms using a remote sensing approach is provided in . All landforms identified on the data were digitised on-screen directly into the GIS as single lines along ridge crests (b).
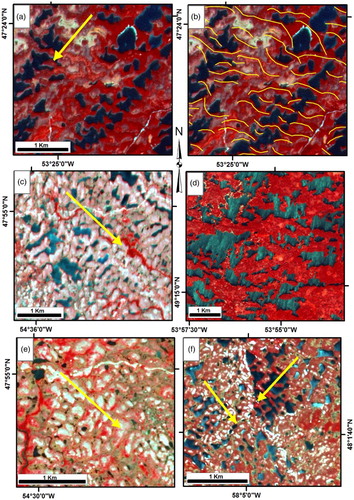
Figure 5. Matched pair (a) and (b) show classic downstream curving ribbed moraines with image (b) highlighting mapping style, with ribbed moraines mapped as vector lines across ridge crests (Box 5ab in ). Images (c), (d), (e) and (f) show other examples of mapped ribbed moraines and are named according to the CitationDunlop and Clark, (2006) classification. Broad arcuate ridges are shown in (c) (Box 5c in ), (d) jagged ribbed moraines (Box 5d in ), (e) hummocky ribbed moraine (Box 5e in ) and (f) cross-cutting ribbed moraines (Box 5f in ). All images are displayed using 10 m pan-sharpened SPOT satellite imagery. Yellow arrows indicate ice flow direction.
4. Map description
The Main Map records the spatial location and distribution of a total of 125,798 individual subglacial bedforms across the entire island of Newfoundland. Four subglacial landform categories are shown on the map. Three of these are streamlined glacial lineations that are aligned parallel to ice flow and include depositional glacial lineations, that is, drumlins and crag and tails, glacially moulded bedrock lineations and much larger drumlinoid hills. The fourth category is ribbed moraine which forms transverse to ice flow ().
This map, presented in A0 size at a scale of 1:750,000, extends the known distribution of subglacial bedforms across the island of Newfoundland (Main Map). The number of landforms mapped in the four primary landform categories and their associated sub-groups are as listed in . Ribbed moraines are shown in yellow, glacially moulded bedrock lineations in blue, drumlinoid hills in brown and the depositional glacial lineations of drumlins and crag and tails as green and purple, respectively. A brief discussion of the mapped landforms is considered below.
Table 4. Quantities of glacial landforms mapped in each landform category.
4.1. Ribbed moraines
Ribbed moraines are the most abundant subglacial bedform on the island of Newfoundland, comprising 81% of all landforms mapped, with a total of 101,363 ridges. These regularly spaced ridges, aligned transverse to ice flow, are widely accepted to have formed subglacially and are located across considerable areas of the former Laurentide, Fennoscandian, British-Irish and Newfoundland ice sheets (NISs) (CitationAylsworth & Shilts, 1989; CitationBouchard, 1989; CitationClark, 1999; CitationClark & Meehan, 2001; CitationDunlop & Clark, 2006; CitationHättestrand & Kleman, 1999; CitationKnight & McCabe, 1997; CitationLundqvist, 1969, Citation1989; CitationMarich et al., 2005; CitationPrest et al., 1968; CitationStokes, Lian, Tulaczyk, & Clark, 2008). Ridge lengths range from 100 m to 3873 m, with 63% of landforms having a typical length range of 300–1200 m (mean 447 m), which is consistent with typical lengths reported in a large representative database by CitationDunlop and Clark (2006). The distribution of mapped ribbed moraines extends the previously documented population of ribbed moraine in the Glacial Map of Canada (CitationPrest et al., 1968) with ∼28% of mapped ridges recorded in areas not previously categorised as ribbed terrain. The mapped ribbed moraines commonly display similar morphological characteristics to those reported in the CitationDunlop and Clark (2006) classification and include, for example, classic downstream curving, broad arcuate, jagged and hummocky ridges (). Similar to other ribbed moraine terrain, there are spatial associations with the glacial lineations mapped on the island (CitationDunlop and Clark, 2006). While drumlinisation of the main ridges has commonly been reported in other regions (CitationDunlop & Clark, 2006; CitationTrommelen et al., 2014), it is observed less frequently in Newfoundland and, where it does occur, it tends to be poorly developed. Up-stream, downstream and lateral transitions occur across various parts of the landscape () and interestingly, cross-cutting ribbed moraines can be observed in the southwest of the island. This is a rarely reported phenomenon, but is important, as it provides clear evidence of former ice divide migrations in the region (CitationClark & Meehan, 2001) (f and ).
Figure 6. This figure shows examples of the spatial connection between ribbed moraines and glacial lineations observed in Newfoundland. In (a), clear lateral transition is evident with ribbed moraine to the right of the image while drumlins are observed towards the centre. Image is displayed using SPOT imagery overlaid on top of a zero azimuth shaded relief. (Box 6a in ). Image (b), on the Avalon Peninsula, shows a field of ribbed moraines in the centre of the image, with transition to streamlined bedforms towards the coast. (Box 6b in ). Arrows indicate ice flow direction. All images are displayed as SRTM shaded relief which have been overlaid with pan-sharpened SPOT imagery.
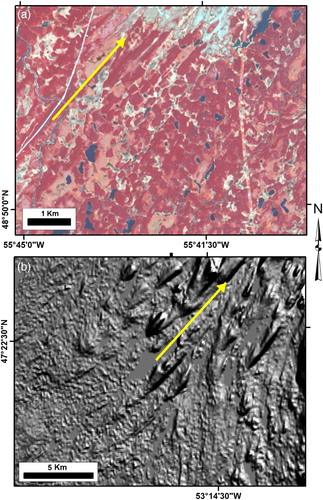
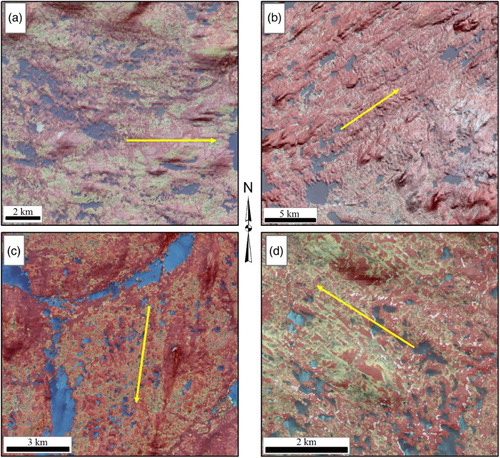
Figure 7. Transitional and palimspsest subglacial landform relationships have been observed in many areas across Newfoundland; (a) illustrates a simple transition from ribbed moraine terrain (left) to streamlined terrain (right) (Box 7a in ). (b) Complex bedform patterns have been recorded, with this example showing a palimpsest landscape with overprinting of glacial lineations by ribbed moraine (top of image), while to the bottom right, a group of crag and tails are observed (Box 7b in ). (c) Two crag and tails are observed on the right of the image and adjacent to these is a field of hummocky ribbed moraine (Box 7c in ). (d) Illustrates transition of ribbed moraine to drumlinised ribbed moraine to streamlined terrain dominated by glacial lineations (Box 7d in ). (Yellow arrows indicate flow direction). All images are displayed as SRTM shaded relief which have been overlaid with pan-sharpened SPOT imagery.
4.2. Glacial lineations
The term glacial lineation tends to be used to refer to depositional subglacial bedforms (drumlins, flutings, mega-scale glacial lineations (MSGLs)). However, glacial landscapes reflect processes of both deposition and erosion and leave a record in the form of both depositional and erosional glacial lineations. Existing palaeo-glaciological reconstructions using the inversion technique to reconstruct ice flow patterns have commonly used evidence obtained from glacial depositional landforms, such as drumlins (CitationBoulton et al., 2001; CitationClark, 1999; CitationClark & Meehan, 2001; CitationKleman et al., 1997) as opposed to using landforms modified by glacial erosion, such as glacially moulded bedrock lineations. However, with appropriate quality control strategies, such as verification of flow orientation using striae evidence (), these landforms can add important information to aid full landscape interpretations (CitationGlasser & Bennett, 2004; CitationGordon, 1981; CitationLindstrom, 1988; CitationRoberts & Long, 2005). In order to provide completeness of information and facilitate a comprehensive interpretation of ice flow patterns and dynamics of the ice sheet, both depositional and erosional bedrock glacial lineations were mapped ().
The Main Map displays a total of 24,435 glacial lineations with 17,291 classed as depositional glacial lineations, 7056 classed as glacially moulded bedrock lineations and 88 drumlinoid hills. Two sub-categories have been mapped in the depositional glacial lineation category; these are 16,283 drumlins and 504 crag and tails. Drumlin ridge lengths range from 60 to 4602 m (mean 781 m). Although mean ridge length exceed that reported by CitationClark, Hughes, Greenwood, Spagnolo, and Ng (2009) in the British and Irish Ice Sheet (629 m), 68% of the mapped drumlins in Newfoundland have similarly reported ridge lengths in the range of 250–1000 m. Greater abundance of depositional glacial lineations is observed at lower elevations east of the Long Range Mountains, where elevations generally do not exceed 300 m. The majority of drumlins show ice flow commonly towards the coast with convergence and attenuation noted in a number of areas, for example, into the Bay of Exploits and Fortune Bay. Highly attenuated lineation patterns are used to identify fast ice flow events (CitationDowdeswell, Cofaigh, & Pudsey, 2004; CitationStokes & Clark, 2001, Citation2002) and as such these patterns may point to former ice stream locations (e.g. CitationBlundon et al., 2010). Crag and tails are found generally within and adjacent to drumlins fields, although some isolated groups are evident on the map south of Red Indian Lake in central Newfoundland. The highest abundance of streamlined glacially moulded bedrock lineations is found in coastal regions. Good examples occur on the Avalon Peninsula showing convergence of ice flow from the surrounding sub-peninsulas into Conception Bay and an eastward ice flow offshore on the east coast of the Avalon Peninsula. The third class of linear landforms mapped are drumlinoid hills. Although drumlinoid in form, these are generally significantly larger in height and width than those of other neighbouring glacial lineations and have ridge lengths ranging from 1470 to 7880 m (3517 m). Although these are observed scattered and isolated across lower elevations of the island, a relatively greater number are located in central southeast mainland Newfoundland. On the Main Map, these display a broadly radial pattern, associated with eastward-oriented ice flow towards Bonavista Bay, a south-eastward flow towards Placentia Bay, a southeast flow towards Placentia Bay and a southward flow towards Fortune Bay.
4.3. Landform relationships
The Main Map shows that many of the subglacial landforms across the NIS bed have strong spatial relationships. Some of these are relatively simple and show transitions from one landform to another; for example, ribbed moraine terrain evolving into more streamlined terrain containing glacial lineations, as can be observed on the landscape north of Fortune Bay (a). However, there are other more complex relationships whereby different sets of landforms are either superimposed or cross-cut one another, creating a palimpsest landscape (f, 6a and 7). Such landform relationships provide an important record of temporal changes in former ice flow and can be used to create a relative chronology of shifting ice flow phases during the evolution of the ice sheet (CitationClark, 1997). For example, superimposition and cross-cutting landforms record significant shifts in ice flow dynamics during different bedforming events. These can be accounted for by either ice divide migrations which causes deflection of primary ice flow (CitationClark and Meehan, 2001), ice stream activation which can result in a new suite of landform development overprinting older ice flow patterns (CitationStokes et al., 2008) or may occur during deglaciation where increased topographic control causes shifts in ice flow orientation which can cut across older flow patterns (CitationGreenwood & Clark, 2009a). Because the map records the spatial position of individual landforms, it can be used to investigate these relationships more thoroughly which will greatly improve our understanding of the dynamic behaviour of the NIS throughout the last glacial cycle.
5. Conclusions
The Main Map builds upon previous landform mapping in the region (e.g. CitationPrest et al., 1968) by being the first map that documents the spatial distribution of individually mapped subglacial bedforms across the entire island of Newfoundland (). It offers a new record of almost 127,000 individual subglacial bedforms and is a comprehensive new landform database that builds upon previous landform research in the region. The mapping extends the known spatial extent and quantity of both ribbed moraines and glacial lineations across the island of Newfoundland and reveals a more complex subglacial bedform record than has been discussed in the existing literature. This is an important new data set from which the ice flow pathways and dynamic behaviour of the former NIS can be reconstructed and which has the potential to provide important new insights into the behaviour of the former NIS during the last glacial cycle.
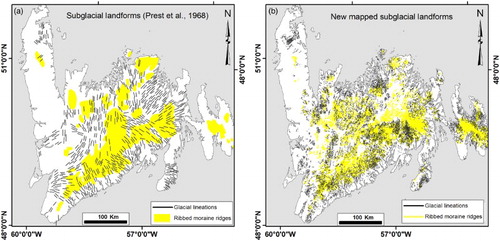
Figure 8. (a) The flow indicators of subglacial lineations (black lines) and ribbed moraine (yellow polygons) contained within the Glacial Map of Canada for the Island of Newfoundland are redrawn (Prest, V.K., Grant, D.R. and Rampton, V.N. 1968: Glacial map of Canada. Geological Survey of Canada. Map 1253A). This map by CitationPrest et al. (1968) records the ice flow indicator glacial lineations at relatively low density while ribbed moraine terrain is presented as generalised polygons. (b) Comparative image of the same geographic extent as (a) to illustrate detail of the new mapping completed in Newfoundland. Individual glacial lineations are represented as black lines while ribbed moraine ridges are illustrated as yellow lines.
Software
Software used included Erdas Imagine 2011 and Esri ArcGIS 10.1. All processing of satellite imagery and DEMs (e.g. creation of shaded reliefs; false colour composites; pan-sharpening, geocorrection, mosaicing) was carried out in Erdas Imagine 2011. ArcGIS 10.1 was used for visualisation, interpretation and digitising the landforms. All cartography was performed using ArcGIS 10.1
The subglacial imprint of the Last Newfoundland Ice Sheet, Canada
Download PDF (22.4 MB)Acknowledgements
This mapping forms part of Maureen McHenry's Ph.D. research project which is entitled ‘Reconstructing the Newfoundland Ice Sheet through the last glacial cycle’, and is based in the Quaternary Environmental Change Research Group, School of Environmental Sciences, Ulster University. Her Ph.D. is funded by a Department for Employment and Learning (DEL) Ph.D. scholarship. The authors are very grateful for the thorough reviews provided by Martin Batterson and Krister Jansson which have improved the final manuscript, and to the cartographer Chris Orton for his valuable advice in finalising the map.
Disclosure statement
No potential conflict of interest was reported by the authors.
References
- Aylsworth, J. M., & Shilts, W. W. (1989). Bedforms of the Keewatin ice sheet, Canada. Sedimentary Geology, 62(2–4), 407–428. doi:10.1016/0037-0738(89)90129-2
- Batterson, M. J., & Catto, N. R. (2001). Topographically-controlled deglacial history of the Humber River Basin, Western Newfoundland. Géographie Physique et Quaternaire, 55(3), 213–228. doi: 10.7202/006851ar
- Batterson, M. J., & Taylor, D. M. (2009). Till geochemistry of the Burin Peninsula, Newfoundland (NTS map areas 1L/13, 1L/14, 1M/2, 1M/3, 1M/4, 1M/6, 1M/7, 1M/10 and 1M/11). Government of Newfoundland and Labrador, Department of Natural Resources, Geological Survey, Open File NFLD/3043, 155 pages. Retrieved May 25, 2013, from http://www.nr.gov.nl.ca/mines&en/geosurvey/publications/openfiles/OFNFLD3043.pdf
- Batterson, M., Taylor, D., Bell, T., Brushett, D., & Shaw, J. (2006). Regional ice-flow mapping, surficial geology and till geochemistry of the northern Burin Peninsula and adjacent Placentia Bay. Current research, Newfoundland and Labrador Department of Natural Resources Geological Survey, Report 06-1. 161-176. Retrieved April 9, 2013, from https://www.mun.ca/geog/people/faculty/tbell/CR_Batterson_et_al_2006.pdf
- Bell, R. A. (1884). Observations on the geology, mineralogy, zoology and botany of the Labrador coast, Hudson's Strait and Bay. Geological Survey of Canada, Report of Progress, 1(D), 5–62. doi:10.5962/bhl.title.61363
- Benn, D. I., & Evans, D. J. A. (2010). Glaciers and glaciation (2nd ed.). Hodder Education. doi:10.4324/9780203785010
- Blundon, P., Bell, T., & Batterson, M. (2010). Ice streaming in the Newfoundland Ice Cap: Implications for the reconstruction of ice-flow and drift prospecting. Current Research (2010) Newfoundland and Labrador Department of Natural Resources Geological Survey, Report 10-1, 143–157. Retrieved November 23, 2013, from https://www.mun.ca/geog/people/faculty/tbell/2010_Blundon-Bell-Batterson.pdf
- Bouchard, M. A. (1989). Subglacial landforms and deposits in central and northern Québec, Canada, with emphasis on Rogen moraines. Sedimentary Geology, 62(2–4), 293–308. doi:10.1016/0037-0738(89)90120-6
- Boulton, G. S. (1976). The origin of glacially fluted surfaces - observations and theory. Journal of Glaciology, 17(76), 287–309.
- Boulton, G. S. (1987). A theory of drumlin formation by subglacial sediment deformation. In J. Menzies & J. Rose (Eds.), Drumlin Symposium (pp. 25–80). Balkema: Rotterdam.
- Boulton, G. S., & Clark, C. D. (1990). A highly mobile Laurentide ice sheet revealed by satellite images of glacial lineations. Nature, 346(6287), 813–817. doi:10.1038/346813a0
- Boulton, G. S., Dongelmans, P., Punkari, M., & Broadgate, M. (2001). Palaeoglaciology of an ice sheet through a glacial cycle: The European ice sheet through the Weichselian. Quaternary Science Reviews, 20(4), 591–625. doi:10.1016/S0277-3791(00)00160-8
- Brookes, I. A. (1982). Ice marks in Newfoundland: A history of ideas. Géographie Physique et Quaternaire, 36(1-2), 139. doi:10.7202/032474ar
- Brushett, D. (2012). Quaternary geology and till geochemistry of the Carmanville (NTS 2E / 08), Wesleyville (NTS 2F/04) and Musgrave Harbour (NTS 2F/05) Map Areas. Current Research. Newfoundland and Labrador Department of Natural Resources Geological Survey, Report, 179–190. Retrieved February 23, 2014, from http://www.nr.gov.nl.ca/nr/mines/geoscience/publications/currentresearch/2012/Brushett_2012.pdf
- Brysse, K., Oreskes, N., O'Reilly, J., & Oppenheimer, M. (2013). Climate change prediction: Erring on the side of least drama? Global Environmental Change, 23(1), 327–337. doi:10.1016/j.gloenvcha.2012.10.008
- Carlson, A. E., & Winsor, K. (2012). Northern hemisphere ice-sheet responses to past climate warming. Nature Geoscience, 5(9), 607–613. doi:10.1038/ngeo1528
- Catto, N. R. (1998). The pattern of glaciation on the Avalon Peninsula of Newfoundland. Géographie Physique et Quaternaire, 52(1), 23–45. doi:10.7202/004778ar
- Catto, N. R., Scruton, D. A., & Ollerhead, L. M. N. (2003). The coastline of eastern Newfoundland: Canadian technical report of fisheries and aquatic sciences No. 2495, 252 pages. Retrieved November 23, 2011, from http://www.dfo-mpo.gc.ca/Library/276332.pdf
- Clark, C. D. (1997). Reconstructing the evolutionary dynamics of former ice sheets using multitemporal evidence, remote sensing and GIS. Quaternary Science Reviews, 16, 1067–1092. doi:10.1016/S0277-3791(97)00037-1
- Clark, C. D. (1999). Glaciodynamic context of subglacial bedform generation and preservation. Annals of Glaciology, 28(1), 23–32. doi:10.3189/172756499781821832
- Clark, C. D., Evans, D. J. A., Khatwa, A., Bradwell, T., Jordan, C. J., Marsh, S. H., … Bateman, M. D. (2004). Map and GIS database of glacial landforms and features related to the last British ice sheet. Boreas, 33(4), 359–375. doi:10.1080/03009480410001983
- Clark, C. D., Hughes, A. L. C., Greenwood, S. L., Spagnolo, M., & Ng, F. S. L. (2009). Size and shape characteristics of drumlins, derived from a large sample, and associated scaling laws. Quaternary Science Reviews, 28(7–8), 677–692. doi:10.1016/j.quascirev.2008.08.035
- Clark, C. D., Knight, J. K., & Gray, J. T. (2000). Geomorphological reconstruction of the Labrador sector of the Laurentide ice sheet. Quaternary Science Reviews, 19, 1343–1366. doi:10.1016/S0277-3791(99)00098-0
- Clark, C. D., & Meehan, R. T. (2001). Subglacial bedform geomorphology of the Irish ice sheet reveals major configuration changes during growth and decay. Journal of Quaternary Science, 16(5), 483–496. doi:10.1002/jqs.627
- Clark, J., McCabe, A. M., Bowen, D. Q., & Clark, P. U. (2012). Response of the Irish ice sheet to abrupt climate change during the last deglaciation. Quaternary Science Reviews, 35, 100–115. doi:10.1016/j.quascirev.2012.01.001
- Dowdeswell, J. A., Cofaigh, C. Ó., & Pudsey, C. J. (2004). Thickness and extent of the subglacial till layer beneath an Antarctic paleo–ice stream. Geology, 32(1), 13. doi:10.1130/G19864.1
- Dunlop, P., & Clark, C. D. (2006). The morphological characteristics of ribbed moraine. Quaternary Science Reviews, 25(13–14), 1668–1691. doi:10.1016/j.quascirev.2006.01.002
- Dyke, A. S. (2004). Quaternary glaciations-extent and chronology – Part II: North America. Developments in quaternary sciences (Vol. 2, pp. 373–424). Elsevier. doi:10.1016/S1571-0866(04)80209-4
- Dyke, A. S., Andrews, J. T., Clark, P. U., England, J. H., Miller, G. H., Shaw, J., & Veillette, J. J. (2002). The Laurentide and Innuitian ice sheets during the last glacial maximum. Quaternary Science Reviews, 21(1–3), 9–31. doi:10.1016/S0277-3791(01)00095-6
- Dyke, A. S., & Prest, V. K. (1987). Late Wisconsinan and Holocene history of the Laurentide ice sheet. Géographie Physique et Quaternaire, 41(2), 237–263. doi:10.7202/032681ar
- Fisher, T. G., & Shaw, J. (1992). A depositional model of Rogen moraine, with examples from the Avalon Peninsula. Canadian Journal Earth Sciences, 29(4), 669–686. doi:10.1139/e92-058
- Geobase Orthoimage 2005-2010 Canadian Council on Geomatics. (2010). Retrieved October 10, 2011, from http://www.geobase.ca/
- Glasser, N. F., & Bennett, M. R. (2004). Glacial erosional landforms: Origins and significance for palaeoglaciology. Progress in Physical Geography, 28(1), 43–75. doi:10.1191/0309133304pp401ra
- Glasser, N. F., & Jansson, K. N. (2005). Fast-flowing outlet glaciers of the last glacial maximum Patagonian icefield : Fast-flowing outlet glaciers of the last glacial maximum Patagonian. Quaternary Research, 63(2), 206–211. doi:10.1016/j.yqres.2004.11.002
- Gordon, J. E. (1981). Ice-scoured topography and its relationship to bedrock structure and ice movement in parts of northern Scotland and west Greenland. Geografiska Annaler, 63(1/2), 55–65. doi:10.2307/520564
- Grant, D. R. (1970). Quaternary geology, Great Northern Peninsula, Island of Newfoundland. In Report of Activities, Part A, Geological Survey of Canada, Paper 70–1 A (pp. 172–174). Retrieved February 5, 2012, from http://wmsmir.cits.rncan.gc.ca/index.html/pub/geott/ess_pubs/119/119858/pa_70_1a.pdf
- Grant, D. R. (1974). Prospecting in Newfoundland and the theory of multiple shrinking ice caps. Geological Survey of Canada, Paper 74-1, 215–216. doi:10.4095/119837
- Grant, D. R. (1977). Glacial style and ice limits, the quaternary stratigraphic record, and changes of land and ocean level in the Atlantic Provinces, Canada. Géographie Physique et Quaternaire, 31(3–4), 247. doi:10.7202/1000276ar
- Grant, D. R. (1989). Quaternary geology of the Atlantic Appalachian region of Canada. In R. J. Fulton (Ed.), Quaternary geology of Canada and Greenland (pp. 391–440). Geological Survey of Canada. doi:10.4095/127905
- Grant, D. R. (1994). Quaternary geology of Port Saunders Map Area, Newfoundland. Geological Survey of Canada, Paper no. 91-20, 64 pages (1 sheet). doi:10.4095/194038
- Greenwood, S. L., & Clark, C. D. (2009a). Reconstructing the last Irish Ice Sheet 1: Changing flow geometries and ice flow dynamics deciphered from the glacial landform record. Quaternary Science Reviews, 28(27–28), 3085–3100. doi:10.1016/j.quascirev.2009.09.008
- Greenwood, S. L., & Clark, C. D. (2009b). Reconstructing the last Irish Ice Sheet 2: A geomorphologically-driven model of ice sheet growth, retreat and dynamics. Quaternary Science Reviews, 28(27–28), 3101–3123. doi:10.1016/j.quascirev.2009.09.014
- Greenwood, S. L., & Kleman, J. (2010). Glacial landforms of extreme size in the Keewatin sector of the Laurentide ice sheet. Quaternary Science Reviews, 29(15–16), 1894–1910. doi:10.1016/j.quascirev.2010.04.010
- Hättestrand, C., & Kleman, J. (1999). Ribbed moraine formation. Quaternary Science Reviews, 18, 43–61. doi:10.1016/S0277-3791(97)00094-2
- Hillier, J. K., Smith, M. J., Armugam, R., Barr, I., Boston, C. M., Clark, C. D., … Wooldridge, K. (2014). Manual mapping of drumlins in synthetic landscapes to assess operator effectiveness. Journal of Maps (4), 1–11. doi:10.1080/17445647.2014.957251
- Honarvar, P., Nolan, L. W., Crispy-Whittle, K. M., & Morgan, K. (2013). The Geoscience atlas. Current research. Newfoundland and Labrador Department of Natural Resources Geological Survey. Report 13–1, 1–3. Retrieved February 23, 2014, from http://www.nr.gov.nl.ca/nr/mines/geoscience/publications/currentresearch/2013/Honarvar_2013.pdf
- Jansson, K. N., & Glasser, N. F. (2005). Using Landsat 7 ETM+ imagery and digital terrain models for mapping glacial lineaments on former ice sheet beds. International Journal of Remote Sensing, 26(18), 3931–3941. doi:10.1080/01431160500106900
- Jansson, K. N., Kleman, J., & Marchant, D. R. (2002). The succession of ice-flow patterns in north-central Québec-Labrador, Canada. Quaternary Science Reviews, 21(4–6), 503–523. doi:10.1016/S0277-3791(01)00013-0
- Khan, S. A., Kjær, K. H., Bevis, M., Bamber, J. L., Wahr, J., Kjeldsen, K. K., … Muresan, I. S. (2014). Sustained mass loss of the northeast Greenland ice sheet triggered by regional warming. Nature Climate Change. doi:10.1038/nclimate2161
- Kleman, J. (1990). On the use of glacial Striae for reconstruction of Paleo-Ice sheet flow patterns. Geografiska Annaler, 72(3–4), 217–236. doi:10.2307/521150
- Kleman, J. (1992). The palimpsest glacial landscape in northwestern Sweden: Late Weichselian deglaciation landforms and traces of older west-centered ice sheets. Geografiska Annale, Series A, Physical Geography, 74(4), 305–325. doi:10.2307/521429
- Kleman, J. (1994). Preservation of landforms under ice sheets and ice caps. Geomorphology, 9(1), 19–32. doi:10.1016/0169-555X(94)90028-0
- Kleman, J., & Borgström, I. (1996). Reconstruction of palaeo–ice sheets: The use of geomorphological data. Earth Surface Processes and Landforms, 21(10), 893–909. doi:10.1002/(SICI)1096-9837(199610)21:10<893::AID-ESP620>3.0.CO;2-U
- Kleman, J., & Glasser, N. (2007). The subglacial thermal organisation (STO) of ice sheets. Quaternary Science Reviews, 26(5–6), 585–597. doi:10.1016/j.quascirev.2006.12.010
- Kleman, J., & Hättestrand, C. (1999). Frozen-bed Fennoscandian and Laurentide ice sheets during the Last Glacial Maximum. Nature, 402(6757), 63–66. doi:10.1038/47005
- Kleman, J., Hättestrand, C., Borgstrom, I., & Stroeven, A. (1997). Fennoscandian palaeoglaciology reconstructed using a glacial geological inversion model. Journal of Glaciology, 43(144), 283–299.
- Kleman, J., Jansson, K., De Angelis, H., Stroeven, A. P., Hättestrand, C., Alm, G., & Glasser, N. (2010). North American ice sheet build-up during the last glacial cycle, 115–21kyr. Quaternary Science Reviews, 29(17–18), 2036–2051. doi:10.1016/j.quascirev.2010.04.021
- Knight, J., & McCabe, A. M. (1997). Identification and significance of ice-flow-transverse subglacial ridges (Rogen moraines) in northern central Ireland. Journal of Quaternary Science, 12(6), 519–524. doi:10.1002/(SICI)1099-1417(199711/12)12:6<519::AID-JQS313>3.0.CO;2-Q
- Lindstrom, E. (1988). Are Roche Moutonnees mainly preglacial forms. Geografiska Annaler. Series A, Physical Geography, 70(4), 323–331. doi:10.2307/521265
- Liverman, D., Batterson, M., & Bell, T. (2006). Digital elevation models from shuttle radar topography mission data–new insights into the quaternary history of Newfoundland. Current Research Newfoundland and Labrador Department of Natural Resources Geological Survey. Report 06–1, 177–189. Retrieved March 19, 2012, from http://www.mun.ca/geog/people/faculty/tbell/CR_Liverman_et_al_2006.pdf
- Lundqvist, J. (1969). Problems of the so-called Rogen moraine. Swedish Geological Survey, Series C(648), 32 pp.
- Lundqvist, J. (1989). Rogen (ribbed) moraine: Identification and possible origin. Sedimentary Geology, 62(2–4), 281–292. doi:10.1016/0037-0738(89)90119-X
- Marich, A., Batterson, M., & Bell, T. (2005). The morphology and sedimentological analyses of Rogen moraine morianes, Central Avalon Peninsula, Newfoundland. Current Research Newfoundland and Labrador Department of Natural Resources, Report 05-1, 1–14. Retrieved May 25, 2013, from http://www.nr.gov.nl.ca/mines&en/geosurvey/publications/cr2005/marich.pdf
- McCabe, A., & Clark, P. (1998). Ice-sheet variability around the North Atlantic Ocean during the last deglaciation. Nature, 392, 373–377. doi:10.1038/32866
- Milne, J. (1876). Ice and ice-work in Newfoundland. Geological Magazine, 3(2), 303–308. doi:10.1017/s0016756800154871
- Murray, A. (1882). Glaciation in Newfoundland. Proceedings and Transactions of the Royal Society of Canada, 1, 55–76. doi:10.1144/transed.4.2.227
- Oppenheimer, M., & Alley, R. B. (2004). The West Antarctic ice sheet and long term climate policy. Climate Change, 64(1–2), 1–10. doi:10.1023/B:CLIM.0000024792.06802.31
- Prest, V. K., Grant, D. R., & Rampton, V. N. (1968). Glacial map of Canada. Geological Survey of Canada Map, 1253A, Scale 1:5 000 000. doi:10.4095/108979
- Pritchard, H. D., Arthern, R. J., Vaughan, D. G., & Edwards, L. A. (2009). Extensive dynamic thinning on the margins of the Greenland and Antarctic ice sheets. Nature, 461(7266), 971–5. doi:10.1038/nature08471
- Putt, M. M., Bell, T., Batterson, M. J., & Smith, J. S. (2010). Late Wisconsinan ice-flow history on the tip of the Northern Peninsula, Northwestern Newfoundland. Current Research. Newfoundland and Labrador Department of Natural Resources Geological Survey, Report 10-1, 171–182. Retrieved August 11, 2012, from https://www.mun.ca/geog/people/faculty/tbell/2010_Putt-Bell-Batterson-Smith.pdf
- Roberts, D. H., & Long, A. J. (2005). Streamlined bedrock terrain and fast ice flow, Jakobshavns Isbrae, West Greenland: Implications for ice stream and ice sheet dynamics. Boreas, 34(1), 25–42. doi:10.1080/03009480510012818
- Rose, J. (1987). Drumlins as part of a glacier bedform continuum. In J. Menzies & J. Rose (Eds.), Drumlin symposium (pp. 103–116). Rotterdam: Balkema. doi:10.1002/jqs.3390030211
- Shaw, J. (2003). Submarine moraines in Newfoundland coastal waters: Implications for the deglaciation of Newfoundland and adjacent areas. Quaternary International, 99–100, 115–134. doi:10.1016/S1040-6182(02)00125-8
- Shaw, J. (2006). Palaeogeography of Atlantic Canadian continental shelves from the last glacial maximum to the present, with an emphasis on Flemish cap. Journal of Northwest Atlantic Fishery Science, 37, 119–126. doi:10.2960/J.v37.m565
- Shaw, J., Piper, D. J. W., Fader, G. B. J., King, E. L., Todd, B. J., Bell, T., … Liverman, D. G. E. (2006). A conceptual model of the deglaciation of Atlantic Canada. Quaternary Science Reviews, 25(17–18), 2059–2081. doi:10.1016/j.quascirev.2006.03.002
- Shepherd, A., & Wingham, D. (2007). Recent sea-level contributions of the Antarctic and Greenland ice sheets. Science, 315(5818), 1529–1532. doi:10.1126/science.1136776
- Smith, J. S. (2012). The paleogeography of Glacial Lake Shanadithit, Red Indian Lake Basin, Newfoundland: Implications for drift prospecting. Current Research Newfoundland and Labrador Department of Natural Resources Geological Survey, Report 12–1, 207–227. Retrieved September 21, 2013, from http://www.nr.gov.nl.ca/nr/mines/geoscience/publications/currentresearch/2012/Smith_2012.pdf
- Smith, M. J., & Clark, C. D. (2005). Methods for the visualization of digital elevation models for landform mapping. Earth Surface Processes and Landforms, 30(7), 885–900. doi:10.1002/esp.1210
- Smith, M. J., Clark, C. D., & Wise, S. M. (2001). Mapping glacial lineaments from satellite imagery: An assessment of the problems and development of best procedure. Slovak Geological Magazine, 7(3), 263–274.
- Smith, M. J., & Knight, J. (2011). Palaeoglaciology of the last Irish ice sheet reconstructed from striae evidence. Quaternary Science Reviews, 30(1–2), 147–160. doi:10.1016/j.quascirev.2010.09.019
- Smith, M. J., & Wise, S. M. (2007). Problems of bias in mapping linear landforms from satellite imagery. International Journal of Applied Earth Observation and Geoinformation, 9(1), 65–78. doi:10.1016/j.jag.2006.07.002
- Spagnolo, M., Clark, C. D., Hughes, A. L. C., & Dunlop, P. (2011). The topography of drumlins; assessing their long profile shape. Earth Surface Processes and Landforms, 36, 790–804. doi:10.1002/esp.2107
- St. Croix, L. S., & Taylor, D. M. (1991). Regional striation survey and deglacial history of the Notre Dame Bay area, Newfoundland. Current Research. Newfoundland and Labrador Department of Mines and Energy, Geological Survey Branch., Report 91–1, 61–68. Retrieved October 10, 2013, from http://www.nr.gov.nl.ca/mines&en/geosurvey/publications/cr1991/StCroix.pdf
- St. Croix, L. S., & Taylor, D. (1992). Ice flow in west-central Newfoundland. Current Research. Newfoundland Department of Mines and Energy, Geological Survey Branch, Report 92-1, Report 92, 51–54. Retrieved November 23, 2013, from http://www.nr.gov.nl.ca/nr/mines/geoscience/publications/currentresearch/1992/stcroix.pdf
- Stokes, C., & Clark, C. (2001). Palaeo-ice streams. Quaternary Science Reviews, 20, 1437–1457. doi:10.1016/S0277-3791(01)00003-8
- Stokes, C., & Clark, C. (2002). Are long subglacial bedforms indicative of fast ice flow? Boreas, 31, 239–249. doi:10.1080/030094802760260355
- Stokes, C. R., Lian, O. B., Tulaczyk, S., & Clark, C. D. (2008). Superimposition of ribbed moraines on a palaeo ice stream bed: Implications for ice stream dynamics and shutdown. Earth Surface Processes and Landforms, 33(4), 593–609. doi:10.1002/esp.1671
- Stokes, C. R., Tarasov, L., & Dyke, A. S. (2012). Dynamics of the North American ice sheet complex during its inception and build-up to the Last Glacial Maximum. Quaternary Science Reviews, 50, 86–104. doi:10.1016/j.quascirev.2012.07.009
- Taylor, D. M. (2001). Newfoundland striation database. Newfoundland Department of Mines and Energy, Geological Survey Branch, Open File NFLD/2195, Version 4.
- Taylor, D. M., Bell, T., Brushett, D., & Shaw, J. (2009). Regional till-geochemistry sampling and ice flow mapping along the southern shore of the Avalon Peninsula. Current research Newfoundland and Labrador Department of Natural Resources Geological Survey, Report 09-1, 357–365. Retrieved August 11, 2012, from http://www.nr.gov.nl.ca/mines&en/geosurvey/publications/cr2009/Taylor.pdf
- Trommelen, M. S., Ross, M., & Ismail, A. (2014). Ribbed moraines in northern Manitoba, Canada: Characteristics and preservation as part of a subglacial bed mosaic near the core regions of ice sheets. Quaternary Science Reviews, 87, 135–155. doi:10.1016/j.quascirev.2014.01.010
- Tucker, C. M. (1974). A series of raised Pleistocene deltas; Halls Bay, Newfoundland. Maritime Sediments, 10(1), 1–7. doi:10.4138/1444