
ABSTRACT
This paper aims to point out the current size structure of the smallest self-government units in the European Union (EU) countries. Municipal reform is currently an ongoing process which has already taken place in several EU member states and resulted in a differentiated structure of these units. Local self-government units have legitimately elected representatives whose action influences the day-to-day life of local residents. From the perspective of comparative analysis, it is important to understand the size structure of local self-government units which has an enormous impact on the functioning of the self-government and it is a key factor in terms of the amount of funding available in these units. The dynamics of integration and disintegration changes are relatively strong as confirmed by the results of our analysis where in almost every EU member state the number of these units has changed more or less significantly in the last decade (2001–2011). For the sake of better mutual comparison, the final map interpretation (the number of local self-government units in the EU) was drawn up to 2011 when all EU member states conducted a census.
1. Introduction
Local self-government has a significant position in public administration. A system of public administration, especially its ongoing reforms, is closely related to the territorial structure of the state. Local self-government is not only responsible for providing and managing a substantial share of public services but also for the economic and social development of the area.
To avoid confusion in the understanding and interpretation of the smallest units of the territorial self-government in the European Union (EU), we use the term local self-government (covering communes in France, Germany and Italy; municipalities in Greece, Denmark and Bulgaria; gminy in Poland, or even more extensive units in the Great Britain and Ireland).
The size of the local self-government (according to area and population) belongs to the basic indicators which determine the further direction for the state in terms of the introduction of administrative reforms. The structure of the territorial self-government in the EU countries has become a subject of interest to many scholars. In their work, attention is paid not only to the one state but in many cases to the comparison of several countries. A very beneficial work dealing with the territorial administrative structure and its reform in the European countries is the work of CitationKaczmarek (2005). Kaczmarek points to the spatial aspect of the public administration in the European countries and the changes in the territorial administrative structure at the regional and the local level. CitationSwianiewicz (2002) is another Polish author who has contributed significantly to the evaluation and comparison of the public administration systems in the Central European countries. A great interest in this issue can be seen also in the work of Bulgarian editor CitationKandeva (2001). Like the previous Polish author, she has summarised the information regarding the structure of the local self-government of southeastern Europe.
The Council of Europe has also provided studies of the earlier analysis of the local and regional authorities in Europe. The structure of the local self-government in the Central Europe and Baltic countries was summarised in an extensive study by CitationHorvath (2000). Another significant and up-to-date study dealing with territorial consolidation and reforms in Europe is CitationSwianiewicz's (2010) work. The most recent papers analysing the local self-government in the European platform are attributed to CitationMoreno (2012) and CitationPanara and Varney (2013). In addition to the previous studies mostly summarising the complex issue of territorial structure of the local self-government in the European countries, there is a great variety of authors addressing the issue of the territorial structure of the state more in depth. Although several authors have attempted to cover a large area of research of social aspects related to the local self-government (CitationPueyo, Zuniga, Jover, & Calvo, 2013; CitationZuniga, Pueyo, & Calvo, 2012), the whole of Europe was not included in their cartographic interpretation. In this respect, as another important contribution we can mention CitationBatista de Silva et al. (2013) whose study provides information about the population distribution in Europe in 2006 with the use of a population grid. In our paper, we attempt to cover both the size structure and the territorial structure of all EU member states. Our final map projection includes the units of local self-government within the period 2001–2011 and thus represents an appropriate addition to the discussion of self-government units and their structure across the EU.
2. Research objectives
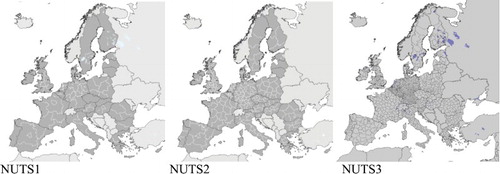
In the previous section, we mentioned that while many authors deal with the territorial structure of the EU with an emphasis on certain member states, a complex comparison (in terms of map visualisation) is absent in the literature. The EU represents a specific territorial unit with its own institutions which determine many essential issues such as the future direction, financial allocations into the regions, as well as other important questions concerning the economic, political and social sphere. The size of the self-government units is often a very limiting factor for its mutual comparison. Therefore, it is necessary to find out what the size of these units is, what the population of these units is and what the number of units every EU member state uses. Cartographic interpretations of the EU tend to be realised at the NUTS1–NUTS 3 level (). However, such a picture reveals nothing about the internal structure of these units. Although the size of the self-government units is essential in terms of the influence of the individual self-governments in these regions, it cannot be recognised here. Even the smallest units have their individually elected representatives who make decisions about the management of the area and thus fundamentally affect the daily life of its inhabitants. Through cartographic interpretation, we are able to look inside the regions (in terms of the size criterion) which are crucial for a number of social and economic analyses on these units.
Figure 1. Spatial distribution of NUTS across the EU member states.
With this paper, we aim to provide a cartographic representation of the smallest self-government units in the EU (Main Map). Such an outcome (the map) enables us to recognise the current status of the municipal reforms within the EU member states in terms of ongoing municipalisation processes at the same level.
3. Methods
One of the prerequisites for a complex cartographic interpretation was the unification of a spatial and statistical database about the population in the local self-governments in the EU. The source of this database was the statistical offices of the EU member states. In 2011, a census was carried out in 26 EU member states (CitationUnited Nations Economic and Social Council, 2011), and the statistical offices of the other two countries (Finland and France) provided data for 2011 as well. Therefore, this year seems to be the most appropriate milestone for a comparative analysis of this type.
In terms of accessing the available population statistics, a few anomalies have occurred. First of all, in Cyprus available data apply only to the Greek part of the island (data for the units on the other side of the island remain unknown). Great Britain has a two-tier system of the local self-government. This applies to the so-called counties in England and territorial units – districts and London's boroughs. Germany has about 80 units that do not belong to any commune called Gemeindefreie Gebiete.
On the map, we can see only smaller units since larger units (counties) would overlap districts and London's boroughs. In our case, counties have also been included into the number of all local self-government units statistically because these units should also be perceived as a local level of the territorial government.
In addition to the statistical data, there is a need for spatial data for the local level of every single country. Moreover, these data must be identical to the data from 2011, the most appropriate year for our analysis. At first glance, it might seem that the number of local self-governments in Europe is characterised by a long-term stability and yet in the last decade (2001–2011) several changes have taken place as a result of administration reforms or municipalisation processes. Detailed analysis of the statistical data in 2001 and 2011 indicates that in 12 EU member states, the number of these units decreased in the last decade, in eight countries the number of units has not changed and in other eight countries there has even been an increase in the number of the local self-government units. In absolute numbers it means that in the last 10 years (2001–2011), more than 4000 local self-governments in the EU have altered their boundaries. This was particularly due to the creation of new units by the amalgamation of several ‘old’ units or dividing the former large ones into several smaller units. A map of the administrative structure in Europe is more or less dynamic which is the reason why the old map layers of the local government boundaries do not necessarily correspond with the new one, moreover, their usage is now limited. Therefore, we aimed to highlight the size structure of those local self-governments in the EU which are identical not only statistically but also spatially till 2011.
With regard to the dynamics of the integration and disintegration processes ongoing in the EU member states, several changes have to be done using standardisation procedures. These procedures were applied in joining individual layers (the territories of the states) into one unit. This was particularly the case of the borderland where we need to deal with typological errors resulting from the different sources of primary data. After obtaining statistical data and spatial data processing, we attempted to make our database compatible. It is obvious that linking the exact nomenclature of the spatial and statistical data together is basically impossible. The reason is that the databases from the statistical offices usually do not contain uniform identification code and even if they do, this is often far from being the same as in the case of spatial data. Different equivalents of geographical names of the local self-governments (e.g. Belgian city Mechelen, resp. Malines, or French Kalmis or La Calamine, etc.) significantly complicate data unification.
Another problem is duplication of the units. For example, in 2011 there were 964 cases of duplication in the name in Germany. This was one of the biggest obstacles that does not allow us to link spatial and statistical data about local self-government units. To deal with this problem, we tried to generate a universal identical code for both, spatial and statistical data. This code has been assigned in the same mutual order (ascending, descending) of spatial and statistical units.
In certain EU member states, we can find many such duplicates not only within the country but within the individual regions itself. Therefore, individual units were associated with a lower level attribute, for example, in Germany Kreise, in France Department, etc.). When analysing spatial data, we use different selection methods from the higher level such as regions and districts. Then, the units can be not only in alphabetical order but the secondary attributes can be applied as well (e.g. regions and districts). However, these attributes must be present also in the statistical database of the population of the local units. This is how we assign a unique numeric code to every EU member state and its local units. Altogether, in 2011 there were 89,223 spatial units of local self-government that were unified.
4. Conclusions
Based on the two basic indicators of the size of the local self-government unit (area and population) in specific EU countries, we came to several conclusions. Among the certain EU member states we can distinguish several types – for example, states with a relatively small size of local self-government; on the other hand, there are states with a much bigger area. In the EU there are 10 countries (Cyprus, Czech Republic, France, Luxembourg, Hungary, Malta, Germany, Austria, Slovakia and Italy) with a smaller average size of local self-government than the average of the EU (50 km2 in 2011).
It is interesting that the sum of all local self-governments in these 10 countries covers 80% of all local self-governments in the EU. Those states, where the size of the local self-government is bigger than the EU average, could be divided into several groups. For instance, there is a group of states where the average size of the local self-government is yet bigger than in the group of 10 above-mentioned countries; however, local self-governments in this group do not cover a significant area. In this group, we can find, for example, communes in Belgium, Croatia, Netherlands; gminy in Poland or local self-government units in Spain, Slovenia or Romania. A higher hierarchy of the units is accompanied by countries with municipalities such as Estonia, Latvia, Portugal, Greece, Denmark and Bulgaria. In these countries, the size of the local self-government is 200–500 km2 on average. The last group consists of countries with the highest average self-government areas, namely Lithuania, Great Britain and Ireland as well as Scandinavian countries such as Finland and Sweden. In the case of the Scandinavian countries, it is obvious that the physical environment and geographical location are the main factors influencing the average size of the local self-government which is 1000 km2 here.
The average size of local self-government in the EU according to population exceeded 5600 in 2011 (). This table also indicates on the relationship between the size of the administrative units and the number of administrative levels. As a rule, in countries with a flattened structure (two levels) local units are large, in countries with three or four levels, local units are generally smaller. Significant influence plays a course in the size of the country. Under this line, there were only seven EU member states (Cyprus, Czech Republic, France, Luxembourg, Hungary, Austria and Slovakia). When considering population in 2011, the smallest self-government units could be found in Czech Republic where the average size did not a reach population of 1680. However, from the perspective of the number of local self-governments, this can be a little bit misleading because in this case we did not use median but arithmetic average instead. This means that the set of units comprises all local self-governments including centres of regions and districts which resulted in an increase of the average. If we had used the median instead, the settlement system in Czech Republic would have looked slightly different and the original number would have fallen to 419. It is obvious that the size of the local self-government calculated according to the median would better match the situation in many European countries, on the other hand, by using the average, we can recognise other patterns in the context of the self-government structure. Moreover, this methodology is often used in other studies of this kind as well. For instance, in Spain, Germany, France, Czech Republic or even in Hungary, the average size of local self-government would be significantly different if the median would be taken into account. The average size of local self-government (using the arithmetic average) in these countries is more than 70% lower, in the case of Spain it goes up to 90%. This is because in many of the mentioned countries' metropolitan areas, agglomerations or even conurbations can be found (on the map highlighted in red) which often result in an increase in the average size of the local self-government. On the other hand, the smallest average decline can be observed in Great Britain and Ireland where relatively homogenous local self-governments (in terms of population) exist.
Table 1. Size of the administrative units and the number of administrative levels in EU member states (2011).
Recognition of this structure according to a share of local self-government and share of population in individual categories cannot only help to identify the spatial layout of the population in the settlement system but also reveal even more complicated patterns in settlement organisation and demographic processes within each state. While many states distinguish several size categories of local self-governments (France, Germany, Spain and Italy), others have only certain categories to choose from on a lower (Malta and Cyprus), medium (Bulgaria and Denmark) or higher level (Great Britain and Ireland).
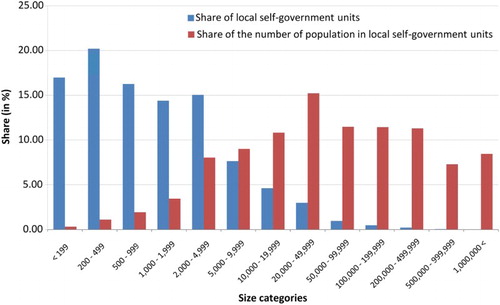
represents the share of settlements and population in individual size categories within the EU member states. The graph resulted from the sum of all local units in all EU countries in 2011. It is clear that the biggest size category (according to the share of local self-governments) is the one with a population of 200–499, which comprises more than 20% of all units. However, in this size category there is only 1% of the overall EU population. Most of the population live in the local self-governments in the category of 20,000–49,999 population (more than 15%). This is especially the case of Germany, Italy, Spain and France where this category is represented the most. This comparison shows that the EU has a strongly urbanised structure. In other words, most of the EU population is concentrated in the urban space – cities and large metropolitan areas, although it does not necessarily mean that its absolute number is high. Our map of size structure of the local self-government in all EU member states provides further opportunities for a new spatial analysis and outlines socio-demographic processes that might be in the spotlight of further research within the European context.
Figure 2. Size categories of local self-government units in EU member states (2011).
Software
When creating our maps we used the ArcGIS 10.1 for all necessary changes as well as for converting coordinate systems. The final version of the map was then modified in the CorelDraw X5.
Local self-government structure in the EU member states in 2011
Download PDF (20.9 MB)Acknowledgements
We would like to express our very great appreciation to Mrs Catherine Dimmock-Benko, external teacher at the Department of Languages, for her willingness to provide the linguistic correction of this paper.
Disclosure statement
No potential conflict of interest was reported by the authors.
Additional information
Funding
Related Research Data
References
- Batista E Silva, F., Gallego, J., & Lavalle, C. (2013). A high-resolution population grid map for Europe. Journal of Maps, 9(1), 16–28. doi: 10.1080/17445647.2013.764830
- Horvath, T. (Ed.). (2000). Decentralisation: Experiments and reforms. Budapest: LGI-OSI.
- Kaczmarek, T. (2005). Struktury terytorialno-administracyjne i ich reformy w krajach europejskich. Poznaň: Wydawnictwo Naukowe UAM.
- Kandeva, E. (Ed.). (2001). Stabilisation of local governments. Budapest: LGI-OSI.
- Moreno, Á. M. (Ed.). (2012). Local government in the member states of the European Union: A comparative legal perspective. Madrid: INAP.
- Panara, C., & Varney, M. R. (Eds.). (2013). Local Government in Europe: The ‘Fourth Level' in the EU multi-layered system of governance. New York, NY: Routledge.
- Pueyo, A., Zuniga, M., Jover, J. A., & Calvo, J. L. (2013). Supranational study of population potential: Spain and France. Journal of Maps, 9(1), 29–35. doi: 10.1080/17445647.2013.764831
- Swianiewicz, P. (Ed.). (2002). Consolidation or fragmentation? The size of local Governments in Central and Eastern Europe. Budapest: LGI-OSI.
- Swianiewicz, P. (Ed.). (2010). Territorial consolidation reforms in Europe. Budapest: LGI-OSI.
- United Nations Economic and Social Council-Statistical Commission. (2011). Population and housing censuses, report of the Secretary-General. Forty-second session, 22–25 February 2011, E/CN.3/2011/21.
- Zuniga, M., Pueyo, A., & Calvo, J. L. (2012). The Spanish population during the twentieth century and beyond. Journal of Maps, 8(4), 386–391. doi: 10.1080/17445647.2012.744364