
ABSTRACT
Volcanic hazard maps are used to inform planners, policy-makers, and the public of the areas potentially impacted by volcanic hazards. We describe the design and production of a three-dimensional (3D) volcanic hazard map showing lahar travel times at Mount Hood, Oregon. The creation of this map involved the application of innovative techniques, including (a) an analytical model for computing lahar travel time isochrones; (b) a terrain tiling system for 3D modeling software; (c) the modeling of roads, rivers, and other linear features as 3D tubes to improve visibility; and (d) progressive terrain bending to create a top-down perspective in the foreground and an oblique perspective in the background. A user study (documented in a separate article) confirmed that the 3D map effectively shows the extent and travel time of potential lahars, allowing readers to choose better escape routes than with a conventional two-dimensional map.
1. Introduction: volcanic hazard maps
Volcanic hazard maps are one of the main tools used by volcanologists to communicate volcanic hazards to planners, policy-makers, and the general public. A volcanic hazard map shows what areas are likely to be affected by volcanic hazards, and – depending on the situation and purpose of the map – it may also incorporate additional elements such as likelihood of hazard occurrence, evacuation routes, critical infrastructure, and critical buildings such as hospitals and schools (CitationMarzocchi, Newhall, & Woo, 2012; CitationNewhall, 2000).
Volcanic hazard maps often show elevation with contour lines, and sometimes with shaded relief, because terrain elevation and terrain structure are important factors for volcanic hazards. However, it has been shown that correctly reading and interpreting contour lines are challenging tasks for map-readers, and that elevation estimation from shaded relief is difficult (CitationPhillips, Lucia, & Skelton, 1975; CitationRapp, Culpepper, Kirkby, & Morin, 2007). CitationNewhall (2000) proposed that contemporary advances in geographic information system (GIS) technology enable the replacement of contour maps with three-dimensional (3D) perspective maps. CitationHaynes, Barclay, and Pidgeon (2007) performed a user survey testing the relative efficacy of 2D, 3D, and aerial photo formats as volcanic hazard maps for the Soufrière Hills volcano on the island of Montserrat. The study revealed improvements in users’ ability to interpret terrain and other basic map information on 3D maps compared to 2D maps. Aerial photos were found to outperform 2D maps for topographic interpretation, the localization of landmarks, and the recognition of volcanic hazards. CitationHaynes et al. (2007) concluded that 3D maps and aerial photos showed promise as an alternative format for hazard maps, and recommended further research on hazard map design.
This work describes a production process, as well as design considerations, for 3D volcanic hazard maps showing lahar travel times, building on the work of CitationHaynes et al. (2007). The map described in this article (‘Main map’) is a modified version of one of the maps tested in a user study comparing the effectiveness of textured 3D maps and traditional 2D maps for communicating volcanic hazards to a general audience. CitationPreppernau and Jenny (2015) provide details and results of this study.
2. Methods
2.1. Visualization of lahar travel times
Lahars, or volcanic mudflows, are wet debris flows that form during or after eruptions when glacial meltwater or rain mixes with ash. They travel up to 50 km per hour for distances of up to a few hundred kilometers (CitationBlong, 1984). Lahars are one of the major direct causes of fatalities in volcanic eruptions (CitationAuker, Sparks, Siebert, Crossweller, & Ewert, 2013) and are the chief hazard to communities around Mount Hood, a stratovolcano in the Cascade Volcanic Arc of northern Oregon, USA.
Lahar travel time is visualized with isochrones on our 3D hazard map of Mount Hood. A raster grid of lahar travel time in minutes was created in order to computationally extract isochrones with a five-minute interval. We used a model introduced by CitationPierson (1998) for determining lahar travel times for volcanoes similar to those found in the Cascades. The model is based on the close fit (R2 ≥ 0.9) of two-degree polynomial curves to plots of distance traveled vs. travel time for observed lahars. The shape of the curves varies according to the initial discharge of the lahar. Thus, if the size of an expected lahar can be estimated, then the model can be used to predict the time it will take the lahar to travel a given distance. The lahar travel times for Mount Hood in the official hazard map (CitationScott et al., 1997) were created with this model at discrete points, using the largest credible initial discharge for an eruption at Mount Hood, and manual distance measurements to specific points (personal communication by Thomas Pierson, Cascades Volcano Observatory, 20 August, 2014).
Pierson's model was used in GIS software to compute a raster of lahar travel times from a raster of distance to the lahar source. We found that stream networks generated from a digital elevation model produce the best results for measuring distance along lahar channels, though a modification to the elevation model is necessary to account for the behavior of pyroclastic flows and lahars. These hazards have enough kinetic energy to climb and overtop ridges (CitationNakada, 2000), so drainages not hydrologically connected to the origin of the lahar can still serve as lahar channels. To model this phenomenon, we draw inspiration from a simple method for determining pyroclastic flow extent in rugged terrain (CitationMalin & Sheridan, 1982). This approach models the gravitational potential energy of the flow as an ‘energy cone’. The apex of the energy cone is the origin of the flow, the slope of the cone is negatively correlated to the volume of the flow, and the cone's intersection with the terrain is the expected extent of the flow (CitationMalin & Sheridan, 1982). For the purpose of creating a lahar travel time raster, the cone is not used to quantitatively model kinetic energy, but to make streams ignore topographic barriers near the source. We approximate the cone parameters by matching the cone's extent to the hazard zones provided by CitationSchilling et al. (2008).
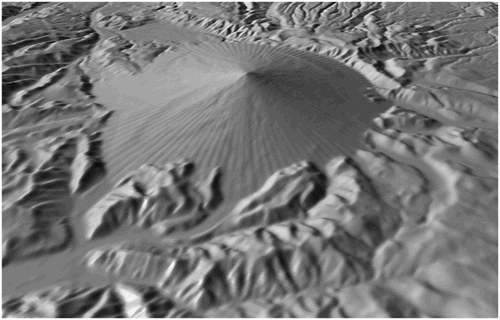
The lahar travel times in the current official hazard maps for Mount Hood (CitationScott et al., 1997) were based on a summit source for the north-moving lahars, and a source near Crater Rock for the south and west-moving lahars. Because these two locations are only 500 m apart from each other, and the location of future vents is uncertain, the decision was made to use the summit as the source of all flows. The cone was created as an artificial raster elevation model and combined with the real-world elevation model of Mount Hood. To encourage formation of variable streams on the cone, two additional surfaces were added to the artificial cone: radial furrows created with a sine function of the cone's aspect, and traces of the original topography (). Stream networks generated from this combined terrain model radiate out from the cone apex, traveling in relatively straight lines and ignoring ridgelines below the surface of the cone, similar to the behavior of a pyroclastic flow. Where the cone intersects the terrain, streams begin following the river valleys. This approximates the combined behavior of pyroclastic flows and the lahars generated from them.
Figure 1. An artificial cone added to the terrain model of Mount Hood to simulate the behavior of lahar flows.
Streams that did not match any of the lahar channels in the data set for the official hazard map (CitationSchilling et al., 2008; CitationScott et al., 1997) were deleted from the network, and the minimum distance from the cone apex was calculated for each vertex in the remaining network. Spline interpolation was used to build a distance raster from these points, with barriers to the interpolation at channel confluences to prevent the creation of gradual transitions in travel time where channels join together.
The distance raster was used to compute lahar travel times with Pierson's model. To calibrate the model for the new distance measurement method, values for the distance raster were plotted with travel times from the official hazard map (CitationSchilling et al., 2008; CitationScott et al., 1997), and a quadratic curve was fit to these points. The curve was constrained to pass through the origin to avoid negative travel times near the source. The equation of the resulting curve, which provides lahar travel time in minutes, was (0.0003285728d2 + 0.013534772d) × 60, where d is the value of the distance raster in kilometers. The greatest deviation between the lahar travel time raster and the points on the official map was seven minutes. Considerable uncertainties exist concerning the location of the lahar origin, the delay between eruption onset and lahar formation, and the actual behavior of the lahar. Therefore, these deviations are likely insignificant (personal communication by Tom Pierson, Cascades Volcano Observatory, 26 August 2013). Isochrones were constructed from this raster by clipping the raster to the lahar boundaries of the official hazard map (CitationSchilling et al., 2008) and applying a contouring algorithm with a five-minute interval.
2.2. Terrain tiling in cinema 4D
The 3D maps were created using a 3D modeling and animation package called Cinema 4D, which contains a number of advanced rendering and shading options. Cinema 4D allows for the creation of polygonal relief objects from height raster data. Orthoimagery data can be used as textures for these relief objects to give them a realistic appearance, and more clearly show physical landmarks, which CitationHaynes et al. (2007) suggested were significant factors in users’ performance with aerial photos.
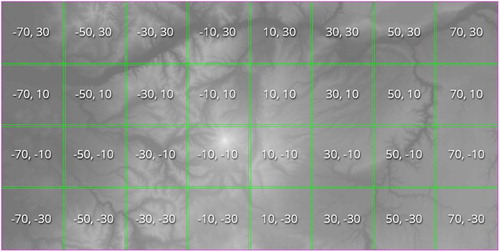
The elevation and orthoimagery data for the region affected by lahars from Mount Hood are large data sets, and much of these data are outside the viewing area of the chosen 3D perspective. Loading the entire data set into the 3D modeling software to create a 3D map is thus inefficient and places prohibitive demands on memory usage and processor time. The solution is to load only those pieces of elevation and orthoimagery data that are being displayed, at the minimum resolution necessary to achieve satisfactory results. To achieve this in Cinema 4D, the Mount Hood hazard region was split into 20 × 20 km tiles, and each tile was given an index number (). The index number was composed of the x and y offset of the center of each tile from the center of the region.
Figure 2. Digital elevation model for the Mount Hood hazard region, divided into 20 × 20 km tiles.
A Python script was used to generate the image and terrain tiles, along with custom metadata documents bearing the names of the tiles. While the index contains the horizontal position of the tile, the metadata contains the information that Cinema 4D needs to correctly scale and offset the elevation values. This is done with two scripting languages that are native to Cinema 4D. COFFEE is a programming language similar to Java, while XPresso is a visual scripting language that uses a set of function nodes whose inputs and outputs can be visually connected to other nodes.
In Cinema 4D, each instance of a tile object contains the script functions necessary to position and load the tile data, allowing the user to load, position, and scale a desired tile by specifying the x index, the y index, and the resolution of the terrain and imagery. An XPresso script handles most functions necessary for processing the tiles, while a COFFEE script is called to read the metadata.
2.3. 3D Mapping of linear features
When linear features such as roads and rivers are portrayed on 3D maps using draped imagery from rasterized vectors, the rendered image often has a poor appearance unless the raster resolution is high, which creates additional resource demands. In addition, draped linear features have no vertical thickness and thus follow every convolution of the terrain. This means that every dip or tilt of the terrain away from or toward the camera will alter the local appearance of the line feature to a much greater extent than is desirable for cartographic display. Drawing vector lines on the rendered map is more desirable for purposes of consistent display, but this can be very time-consuming and ignores the effect of orientation and distance on the apparent size of the feature, which is an important depth cue.
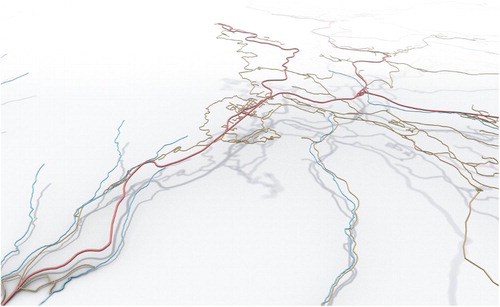
A solution that solves both problems is to convert line features into 3D tubes that are rendered with the terrain. This was done with the Mount Hood map using a ‘sweep’ operator in Cinema 4D. The operator sweeps a profile vector (a flattened circle in this case), along line features, creating 3D geometry. The road and river vectors were projected onto the terrain and a network of tubes was created using the sweep operator ().
Figure 3. Roads and rivers rendered as 3D tubes over a flat white plane. Each class of line feature has a different color and radius. Terrain is absent but the shadows on the ‘floor’ give an indication of relative feature height.
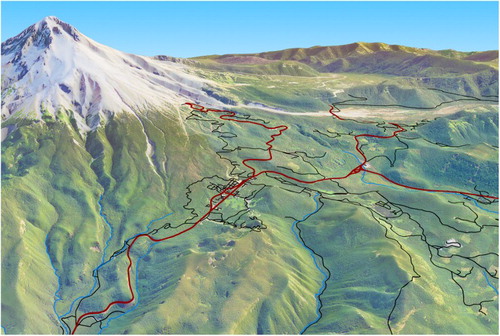
These tubes follow the terrain and stay half-in, half-out of the ground surface, so they are not affected by the slope and aspect of the terrain in the way that draped raster images are. Their slight height above the terrain surface makes them less likely to be occluded by slopes tilted away from the camera. They also have a smaller apparent size at a distance, and because of the slight flattening of their profile shape, they appear narrower when oriented perpendicular rather than parallel to line of sight ().
Figure 4. Final result for 3D roads and rivers. The flattened tube profile results in roads that are occluded by hills, but have a consistent and smooth appearance even in rugged terrain, with a slight perspective effect.
2.4. Progressive Terrain bending
CitationSchobesberger and Patterson (2008) explain that a potential problem of 3D maps is the occlusion of significant features in lowlands and valleys. This is especially problematic for 3D visualizations of lahar and debris flow models, as they typically take place in the bottom of steep-sided river valleys. This problem can be resolved with the use of progressive terrain bending, a technique for showing the foreground of a 3D map at a steep angle while the background is viewed at a nearly parallel angle, resulting in a horizon and a view of the sky (CitationJenny, Jenny, & Hurni, 2010).
Some 3D modeling software contains tools for interactively deforming the geometry of objects. One of the more common deformation tools is a 3D lattice that initially has a cuboid shape. The deformer tracks the displacement of each vertex in the lattice from its starting position, and a smoothed interpolation of this displacement is applied to the object being deformed. For deforming the Mount Hood terrain model in Cinema 4D, the terrain tiles and 3D tubes were grouped together and modified with a deformation lattice that rendered Mount Hood Village in the foreground at a nearly vertical angle, while Mount Hood itself is shown at a very flat angle, becoming part of the horizon. The cone of Mount Hood was slightly enlarged to keep the perspective from diminishing the size of these important map features.
3. Conclusions
In a real-world use of this kind of map, multiple maps with different perspectives would have to be created to portray the hazard for all areas threatened by the volcano. In the case of Mount Hood, most of the damage is likely to occur in Government Camp and Mount Hood Village, which are shown on the map discussed in this article. Areas in and around Parkdale, Hood River, Sandy, and Troutdale could potentially be affected to varying degrees (CitationScott et al., 1997), but these latter communities are not shown on our map, and additional maps would need to be tailored to these areas to provide a comprehensive portrayal of the hazards.
Another reason to map individual communities is that it would allow larger scales to be used. CitationHandmer (1980) recommended that flood hazard maps be made at scales large enough for individual structures to be recognizable as landmarks, and CitationHaynes et al. (2007) suggested that the better performance of aerial photos to the 2D or 3D maps may have been due to subjects’ ability to recognize familiar landmarks on imagery. CitationDall'Osso and Dominey-Howes (2010) used large-scale orthoimagery that clearly showed individual structures in their tsunami hazard maps, and this feature was lauded by their survey participants for its usefulness in finding their position on the map. Thus, tailoring the maps to specific communities would maximize the benefit provided by the orthoimagery, and come closer to combining the advantages of 3D maps and aerial photos.
The process used to create 3D maps requires fluency in several different software packages, and is time-consuming, which is one of the foremost current drawbacks to 3D hazard maps, particularly when multiple maps are needed to cover the surroundings of a volcano.
While the 3D maps have been shown to produce a measurable improvement in users’ interpretation of the hazards represented (CitationPreppernau & Jenny, 2015), the production of such maps is expensive and an obstacle for their widespread adoption. However, there are open-source alternatives to the proprietary software used, and it is possible to automate most of the procedures outlined here. The use of free, open-source software, and specialized tools that offer a more streamlined map creation process and are less demanding of technical and cartographic skill would open the creation and use of these maps to a far wider pool of scientists, emergency management officials, and the general public.
Software
ESRI's ArcGIS was used to prepare the raster and vector layers for export to the rest of the pipeline, including classification of roads, creation of the lahar travel time raster, and creation of terrain tiles. Cinema 4D, a 3D modeling and animation package (see 2.2 Terrain Tiling in Cinema 4D), was used to composite the terrain tiles, display line vectors as tubes, apply progressive bending to the terrain, and render the resulting landscape. Final cartographic finishing, label placement, and color adjustments were performed in Adobe Photoshop.
Estimated Travel Time of Mudflows at Mount Hood, Oregon.pdf
Download PDF (33.7 MB)Acknowledgments
The authors would like to thank Dr. Thomas Pierson of the Cascades Volcano Observatory for his advice on creation of the lahar travel time raster, Abby Metzger of the Oregon State University for editing this text, and the members of the Oregon State University Cartography and Geovisualization Group for their feedback on the map design.
Disclosure statement
No potential conflict of interest was reported by the authors.
Related Research Data
References
- Auker, M. R., Sparks, R. S. J., Siebert, L., Crossweller, H. S. & Ewert, J. (2013). A statistical analysis of the global historical volcanic fatalities record. Journal of Applied Volcanology, 2(2), 1–24.
- Blong, R. J. (1984). Volcanic hazards. A sourcebook on the effects of eruptions. North Ryde: Academic Press.
- Dall'Osso, F., & Dominey-Howes, D. (2010). Public assessment of the usefulness of “draft” tsunami evacuation maps from Sydney, Australia – implications for the establishment of formal evacuation plans. Natural Hazards and Earth System Science, 10(8), 1739–1750. doi: 10.5194/nhess-10-1739-2010
- Handmer, J. W. (1980). Flood hazard maps as public information: An assessment within the context of the Canadian flood damage reduction program. Canadian Water Resources Journal, 5(4), 82–110. doi: 10.4296/cwrj0504082
- Haynes, K., Barclay, J., & Pidgeon, N. (2007). Volcanic hazard communication using maps: An evaluation of their effectiveness. Bulletin of Volcanology, 70(2), 123–138. doi: 10.1007/s00445-007-0124-7
- Jenny, H., Jenny, B., & Hurni, L. (2010). Interactive design of 3D maps with progressive projection. The Cartographic Journal, 47(3), 211–221. doi: 10.1179/000870410X12786821061495
- Malin, M. C., & Sheridan, M. F. (1982). Computer-assisted mapping of pyroclastic surges. Science, 217(4560), 637–640. doi: 10.1126/science.217.4560.637
- Marzocchi, W., Newhall, C. G., & Woo, G. (2012). The scientific management of volcanic crises. Journal of Volcanology and Geothermal Research, 247–248, 181–189. doi: 10.1016/j.jvolgeores.2012.08.016
- Nakada, S. (2000). Hazards from pyroclastic flows and surges. In H. Sigurdsson, B. Houghton, S. McNutt, H. Rymer, & J. Stix (Eds.), Encyclopedia of volcanoes (pp. 945–995). Orlando, FL: Academic Press.
- Newhall, C. G. (2000). Volcano warnings. In H. Sigurdsson, B. Houghton, S. McNutt, H. Rymer, & J. Stix (Eds.), Encyclopaedia of volcanoes (pp. 1185–1197). Orlando, FL: Academic Press.
- Phillips, R. J., Lucia, A., & Skelton, N. (1975). Some objective tests of the legibility of relief maps. The Cartographic Journal, 12(1), 39–46. doi: 10.1179/caj.1975.12.1.39
- Pierson, T. C. (1998). An empirical method for estimating travel times for wet volcanic mass flows. Bulletin of Volcanology, 60(2), 98–109. doi: 10.1007/s004450050219
- Preppernau, C.A. & Jenny, B. (2015). Three-dimensional versus conventional volcanic hazard maps. Natural Hazards. doi: 10.1007/s11069-015-1773-z
- Rapp, D. N., Culpepper, S. A., Kirkby, K., & Morin, P. (2007). Fostering students’ comprehension of topographic maps. Journal of Geoscience Education, 55(1), 5–16.
- Schilling, S. P., Doelger, S., Scott, W. E., Pierson, T. C., Costa, J. E., Gardner, C. A., … Major, J. J. (2008). Digital data for volcano hazards of the Mount Hood region, Oregon. Data to accompany U.S. Geological Survey Open-File Report 97-89. Retrieved from http://pubs.usgs.gov/of/2007/1222/
- Schobesberger, D. & Patterson, T. (2008). Evaluating the effectiveness of 2D vs. 3D trailhead maps: A map user study conducted at Zion National Park, United States. In Hurni, L & Kriz, K. (Eds.), Proceedings of the 6th ICA mountain cartography workshop ‘mountain mapping and visualisation’ (pp. 201–205). Lenk. Retrieved from http://www.mountaincartography.org/publications/papers/papers_lenk_08/schobesberger.pdf
- Scott, W. E., Pierson, T. C., Schilling, S. P., Costa, J. E., Gardner, C. A., Vallance, J. W. & Major, J. J. (1997). Volcano hazards in the Mount Hood region. Oregon: US Geological Survey Open-File Report 97–89, 14 p., 1 map. Retrieved from http://pubs.usgs.gov/of/1997/0089/