
ABSTRACT
The Loch Lomond Stadial (LLS) was an abrupt period of renewed cooling between 12.9 and 11.7 ka and has long been associated with the regrowth of glaciers in much of upland Britain. Mapping the glacial landforms associated with this period has been undertaken for over a century, but in a non-systematic nature and at specific locations. In this paper, glacial geomorphology associated with the LLS in Britain has been compiled from the published literature into a glacial map and accompanying geographical information system database that is available electronically as supplementary information. A variety of scales have been used to best represent the evidence in the database. Map A is at 1:310 000; B, C, D, E, F, J, L, M and O are at 1:175 000; K, N, P are at 1:100 000 and G, H and I are at 1:50,000. The database contains over 95,000 individual features, which are organised into thematic layers and each attributed to its original citation. The evidence includes moraines, drift and boulder limits, drift benches, periglacial trimlines, meltwater channels, eskers, striations and roches moutonneés, protalus ramparts and ice-dammed lakes. Creation of this database overcomes the drawbacks posed by the non-systematic nature of previous mapping output from studies of LLS glaciation. It is intended to be a catalyst for future research in this area, with especial significance for regional palaeoglaciological and palaeoclimatic reconstructions of the Younger Dryas and numerical modelling.
1. Introduction
The glacial history of Britain has attracted the attention of researchers for over a century, inspiring a large and evolving body of research and published output. However, much of this research comprises localised case studies which inhibit a more holistic understanding of the extent and dynamics of regional glaciation styles. A significant step in overcoming this problem was the BRITICE Project, which created a ‘Glacial Map of Britain’ and geographic information system (GIS) database of over 20,000 individual features dated to the last (Late Devensian) British Ice Sheet (CitationClark et al., 2004; CitationEvans, Clark, & Mitchell, 2005). This has facilitated evidence-based reconstructions of the extent and dynamics of the ice sheet (CitationClark, Hughes, Greenwood, Jordan, & Sejrup, 2012). Geomorphological evidence dating to the Loch Lomond Stadial (LLS), however, was excluded from BRITICE.
The LLS period was characterised by an abrupt return to severe cold conditions following ice sheet retreat when glaciers regrew, forming most significantly a large ice field running the length of the Western Highlands (CitationBennett & Boulton, 1993; CitationThorp, 1986). This ice field was the largest of numerous satellite ice fields, ice caps, valley glaciers and cirque/niche glaciers on several of the western isles and at other upland sites around Britain and Ireland (CitationGolledge, 2010). The BRITICE database included the limit of the LLS icefield in the Western Highlands only. This was done primarily to indicate that the area was subjected to renewed mountain icefield glaciation after ice sheet recession and to explain the consequent absence of data from this area, and was compiled from relatively few sources (CitationClark et al., 2004).
The Main Map presented in this paper is the product of a comprehensive compilation of LLS features in a GIS database, aimed at improving our understanding of the local and regional signatures of glaciation style, extent and dynamics during this critical part of the Late Quaternary. This compilation aims to overcome the fragmented and spatially inconsistent nature of much of the published LLS research by synthesising it into a single body of evidence, while retaining the valuable high-resolution mapping achieved in localised case studies. The database facilitates comparison of landform assemblages, and therefore palaeo-ice dynamics, at scales spanning individual mountain ranges to regional uplands and local valleys. Although several publications have shown the reconstructed extent of LLS ice over large areas or between drainage basins (CitationCharlesworth, 1955; CitationGolledge, 2010; CitationMcDougall, 2013) the map and database presented here are the first to collate evidence to inform reconstructions of the extent of LLS glaciation from the whole region of upland Britain.
2. Methods
2.1. Selection of evidence
The BRITICE map and database (CitationClark et al., 2004) was used as a template for informing decisions regarding what evidence should be included/excluded and how this should be organised. Evidence within the database originates from academic journal articles, field guides and theses. Cross-referencing between sources was used to identify relevant papers and Ph.D. theses, rather than searching through all journals or institutions. No work from below Ph.D. level has been included, in order to ensure that sources are accessible to other researchers. Although the number of publications covered is extensive (more than 200), it is expected that some sources will have been overlooked. The census date for data inclusion in this project is June 2014 but the intention is that the database can be updated as future research becomes available.
The geomorphological evidence has been organised into a series of layers, each containing a different landform type, similar to the BRITICE project (CitationClark et al., 2004). These include moraines (individual moraine mounds and ridges, fluted moraines and areas of hummocky moraine), drift and boulder limits, drift benches, meltwater channels, eskers, periglacial trimlines, striations and roches moutonneés, protalus ramparts. Major ice-dammed lakes associated with LLS glaciers are also mapped. In some cases (e.g. in glens Doe, Gloy, Spean and Roy), the authors report the extent of the lakes at multiple stages during the LLS, but in most publications the lakes have only been reported as dammed by LLS glaciers at their maximum extent (e.g. CitationBenn & Ballantyne, 2005; CitationMacLeod et al., 2011).
Some evidence could not be easily presented in map form, for example sedimentological characteristics, whilst some landform types either had not been mapped systematically throughout the literature (glacial outwash) or just replicated the information derived from more commonly mapped features. It was concluded that including the distribution of glacigenic deposits would largely replicate the Quaternary Map of the United Kingdom (CitationIGS, 1977) and thus this has not been attempted. Although most LLS glaciers terminated onshore, some extended beyond the current coastline into particular sea lochs along the western coast of Scotland. Where moraines have been mapped from bathymetric surveys of these sites and have been attributed to the LLS, these have been included in the database (CitationBoulton, Chroston, & Jarvis, 1981; CitationDix & Duck, 2000; CitationMcIntyre, Howe, & Bradwell, 2011).
Some differences in approach between this study and the BRITICE database have been necessary. Striations were not included in the BRITICE mapping because it was argued that these are not reliable indicators of ice flow and the volume of data made the task unrealistic (CitationClark et al., 2004). However, differential striation directions have been instrumental in reconstructing the extent of LLS glaciers in several locations, sometimes being amongst the most important landform evidence available, for example, at Loch Coruisk, Isle of Skye (CitationBallantyne, 1989). It was, therefore, deemed necessary to include striations from the source maps to show how such reconstructions have been derived. Similarly, hummocky moraine was excluded from the BRITICE mapping due to inconsistencies within the literature regarding the definition and genesis of this landform (CitationClark et al., 2004). Given that this landform type was once interpreted as diagnostic of a LLS age and has been central to several reconstructions of LLS glaciers (CitationSissons, 1972, Citation1974; CitationSissons & Grant, 1972), it was deemed important to include it here. Protalus or pronival ramparts are also included as some of these features have previously been linked to a glacial origin and, indeed, debate continues about the glacial versus periglacial origin of such landforms in many areas (CitationCarr, Coleman, Evans, Porter, & Rea, 2007; CitationShakesby, 2007).
2.2. Map formatting and georeferencing
The reliability of the database is largely dependent on the quality of the original maps from which it is built. Consequently, selection and inputting of appropriate maps have been crucial. Where multiple maps covered the same area, preference has usually been given to the most comprehensive and/or highest resolution map, unless its findings have been refuted in subsequent literature. Some areas, therefore, show specific sites of fine detailed mapping, within a region of more generalised coverage.
The procedure to add data to the map is outlined in . Geomorphological maps from papers (e.g. ) were scanned and stored as raster graphics files (.tiffs). These were added as layers into ArcMap over a hillshade model derived from a 5 m resolution NEXTMap digital surface model (DSM). The maps were then georeferenced to the OS British National Grid system. Where maps had pre-existing gridlines or tick marks that could be used to create an overlying grid using Adobe Photoshop, this was a straightforward task as the coordinates of ground control points (GCPs) on the grid are known and can be inputted directly, and accurately, into ArcMap (CitationClark, 1997). These points were distributed evenly across the map, particularly around the edges, to reduce distortion. Usually, a minimum of eight points were used, although this was not always possible for maps of limited coverage.
Figure 1. Flow chart showing the stages in GIS and map production.
Figure 2. Examples of geomorphological maps used in the database (a) the area around Ceartaval, Northern Harris (reprinted from Quaternary Science Reviews, 26(25–28) CitationBallantyne (2007) LLS glaciers in North Harris, Outer Hebrides, North-West Scotland: glacier reconstruction and palaeoclimatic implications., 3134–3149, Copyright (2007) with permission from Elsevier. (b) The Bizzle Cirque, Cheviot Hills (Reprinted from Geografiska Annaler, Series A, 88(3) CitationHarrison, Anderson, and Patel (2006). The eastern margin of glaciation in the British Isles during the Younger Dryas: The Bizzle Cirque, southern Scotland., 199–207, Copyright (2006) with permission from Elsevier.
When maps did not provide such information, a different approach was required. OS maps (courtesy of Edina Digimap) were georeferenced and used to provide GCPs by matching prominent features on the OS map with the corresponding features on the geomorphological map. Features for GCPs were selected carefully, ideally with roads and buildings being used in preference to rivers, coastlines or water bodies, which might have changed position since the original mapping. However, the remote nature of many of the study locations often precluded use of anthropogenic features, leaving little choice for GCP selection. Our aim was to achieve RMS errors of 20 m or less but this was not always possible, particularly for older maps. Although great efforts were made to include all maps, wherever possible, some had to be excluded because they either did not contain sufficient information for their location to be derived, or they were at too coarse a scale to be useful. In total, some 216 individual geomorphological maps from 71 separate sources were found to be suitable.
2.3. Digitisation of layers
Once maps had been georeferenced in ArcMap, landforms were digitised as either lines or polygons into a series of layers organised by landform type, and saved as shapefiles (). For the vast majority of evidence, this involved manual on-screen digitising of landforms. As the database is scale-independent, features were digitised at the maximum resolution of the source maps.
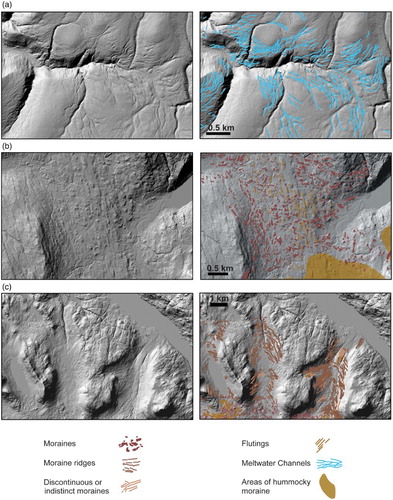
Figure 3. Examples of mapping from the GIS database showing (a) meltwater channels, Allt Gharbh Ghaig, Gaick, (after CitationSissons, 1974); (b) moraines, flutings and areas of hummocky moraine, Glen Sligachan, Isle of Skye (after CitationBenn et al., 1992); (c) moraine ridges and discontinuous moraines, Strath Lungard and Glen Grudie, Wester Ross (CitationBennett, 1991; CitationBennett & Boulton, 1993; CitationMcCormack, 2011). Legend has been modified slightly to aid identification of landforms. Underlying hill-shaded images were derived from NEXTMap DSM from Intermap Technologies Inc. provided by the NERC Earth Observation Data Centre.
Where other researchers had produced shapefiles of geomorphology as part of their original mapping, these data were often provided by the authors for input into the database, and copied directly into the thematic layers. Other data were provided as unreferenced digital data (e.g. .tiff), which was then georeferenced and converted into shapefiles. Whilst the individual features are slightly pixelated and occasionally coalesced, this proved a very efficient way to rapidly ingest thousands of features from previous work into the GIS (CitationLukas & Lukas, 2006a, Citation2006b).
As the accuracy of the database relies largely on the quality of the original maps, it is important that features can be traced back to their source. As such, the citation for each feature is included in its attribute table. This allows other researchers to examine the assumptions and justifications made by the original authors, and directly facilitates a closer examination of the existing literature. A full list of the references included in the map is available as supplementary material.
Hill-shaded renditions of the NEXTMap DSM were used to check the mapping and to provide topographic context for the geomorphology. This was useful for checking the quality of georeferencing and for identifying the correct position of landforms where original maps differed. However, the relatively small scale of LLS landforms is often below the 5 m resolution of the NEXTMap and so only larger features, such as end moraines or meltwater channels, were checked in this way. As the focus of this project was to compile the existing evidence rather than re-map it, alterations (either redrawing or repositioning of landforms) have only been made in a limited number of cases where features were clearly incorrectly placed (e.g. where features which are clearly identifiable on the hill-shaded DSM are offset from their positions on the original maps). These alterations have been noted in the feature's attribute data.
In several cases, landforms originally attributed to ice limits that pre-date the LLS are also included in the original maps (CitationBallantyne, 2007; CitationBenn, 1990; CitationFinlayson, Golledge, Bradwell, & Fabel, 2011). In such cases, only features within or intersecting the authors’ proposed glacier limits were included in the database. This approach relies heavily on the accuracy of the original glacial reconstructions to determine the age of the landforms which in some areas are speculative, often as a result of the paucity of absolute dates (CitationLukas, 2006). However, such restrictions were important to ensure that the LLS remained the focus of the project. Furthermore, as the Late Devensian Ice Sheet had previously overridden the areas later occupied by the LLS glaciers, it is possible that some locations within these limits may comprise palimpsest assemblages of younger landforms overlying older ones. Thus, inclusion in this GIS does not necessarily mean that features were formed during the LLS but that they lay within the glacial limits and may have either survived beneath, or were modified by, the LLS ice.
A practical problem encountered during digitisation was reconciling the differing scales and styles of mapping from the literature into one map. Maps range from coarse resolution sketches to highly detailed maps of individual sites of particular interest. Features which are classified as belonging to the same landform type are often represented differently between papers. The most widely reported LLS features were moraines, but numerous approaches to mapping these features have been adopted (). Some researchers represent the shape and distribution of individual moraine mounds as polygons, whilst others record only ridge crests as line features or just general areas of ‘hummocky moraine’. These different styles of mapping cannot be reconciled within a single layer in ArcMap, and so are split into separate layers accordingly (‘Moraines (detail)’, ‘Moraine_Ridges’ and ‘Moraine_Hummocky_Area’). Generally, in areas where mapping of individual features overlapped areas of general ‘hummocky moraine’, only the detailed features were digitised to prevent the database becoming too cluttered. However, in instances where subsequent mapping shows an absence of features in locations where earlier publications reported evidence to be present, the older data have been retained around the newer evidence unless the presence of features is explicitly refuted in the latter paper or by the underlying NEXTMap data. Similar considerations were necessary where authors use different terminologies. Some areas originally mapped as ‘hummocky drift’ have been included in the ‘Moraine_Hummocky_Area’ layer when either more detailed mapping or the authors’ descriptions indicated that moraines were found at the same location.
Striations and roches moutonneés have been combined into a single layer because some papers (CitationBallantyne, 2006, Citation2007) represented these features with the same symbol, making it impossible to separate them into different layers. Similarly, the ‘Drift_Limits’ layer contains some features that were classified as ‘Drift and/or boulder limits’ in the original mapping, cf. CitationBendle and Glasser (2012). Although layers were informed by the most common way of representing features, inconsistencies arose very occasionally and, in order to prevent an impractical number of layers being created, features were redrawn to fit (e.g. polygon eskers were redrawn as lines).
2.4. Limitations
When synthesising over a century of research, gathered in an unsystematic way by a large number of researchers, a major consideration is the consistency and quality of the data collected. The original geomorphological maps were created using a variety of techniques (remote sensing, fieldwork or a combination of both) and, given the often subjective nature of landform identification, are based on the interpretations of individual workers. Furthermore, advances in glaciological theory since publication of the original research may mean that some evidence is based on outdated ideas.
Secondly, it is conceivable, if not likely, that these LLS maximum extents were not reached synchronously (CitationBallantyne, 2012; CitationGolledge, Hubbard, & Sugden, 2008). It is also possible that some features that were not formed by LLS glaciers may have been erroneously included. There is a relative scarcity of absolute dates on glacial landforms from the LLS in Britain and, consequently, some features that pre-date the LLS may have been included in this database if they were interpreted as LLS in age in the original study. Similarly, even when moraines have been inferred to pre-date the LLS, usually based on their more subdued appearance and greater size, the lack of absolute dates on these landforms means a LLS age cannot be ruled out. The glacial origin of some features has also been questioned, especially where moraines may appear similar in morphology to protalus ramparts or landslide blocks (CitationShakesby & Matthews, 1996). In cases of both uncertain age and genesis, this project assumes a LLS origin, especially if location appears consistent with the maximum extent of LLS glaciation, unless subsequent literature strongly refuted such an interpretation. Where these decisions have been made, this is indicated in the attribute data.
3. Discussion and implications
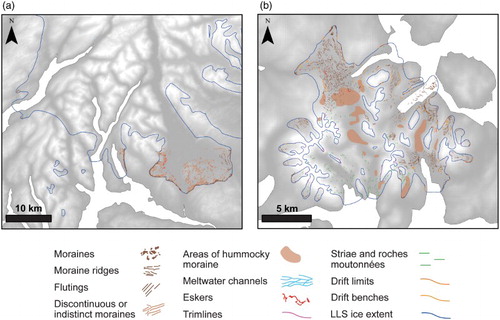
An initial inspection of the map () clearly shows the variable quality and unequal distribution of the source mapping. Some locations, for example, the Isle of Skye, have been extensively studied (CitationBallantyne, 1989; CitationBenn, 1992; CitationSmall et al., 2012) whilst others, including the Southwest Scottish Highlands, have not been mapped to the same level of rigour and detail. Hence, this project identifies areas where further detailed study is required, guiding site selection for future research. It is hoped that this map and database will be the catalysts for the development of a complete coverage of mapping for all the former LLS glaciers in the British Isles, thereby facilitating a more holistic reconstruction of palaeoglaciology and palaeoclimate for the Younger Dryas in the region.
Figure 4. Examples of the variable quality and unequal distribution of geomorphological mapping (a) the contrast between the detailed mapping of the Loch Lomond area in comparison to the surrounding Southwest Scottish Highlands (after CitationSutherland, 1981; CitationRose, 1980, Citation1981; CitationRose & Smith, 2008). LLS ice extent adapted from CitationThompson (1972), CitationSutherland (1981) and CitationClark et al. (2004). (b) extensive and highly detailed mapping of the Isle of Skye (after CitationBallantyne, 1989; CitationBenn, 1990, Citation1992, Citation1993; CitationBenn et al., 1992; CitationDix & Duck, 2000). LLS ice extent adapted from CitationBenn et al. (1992). GB Digital Elevation Model from ShareGeo, available at www.sharegeo.ac.uk/handle/10672/5. Original data set from NASA. UK outline reproduced from Ordnance Survey map data © Crown Copyright and Database Right 2014. Ordnance Survey (Digimap Licence).
In some areas, there has been a general shift in our understanding of LLS glacier extent in that a more extensive ice cover has been recently proposed (CitationBrown, Evans, & Evans, 2011; CitationBrown, Evans, Vieli, & Evans, 2013; CitationLukas & Bradwell, 2010; CitationMcDougall, 2013). The proposed limits of the Western Highland ice field in Scotland have been refined, but are not too dissimilar to early reconstructions (CitationSissons, 1967) and are supported by the results of numerical modelling (CitationGolledge et al., 2008). However, at some locations, including both Sutherland in northwest Scotland and the English Lake District, more detailed remapping of geomorphology and an improved understanding of glaciological theory have been employed to show that plateau ice fields nourished extensive valley and cirque glacier systems (CitationBrown et al., 2011, Citation2013; CitationLukas & Bradwell, 2010; CitationLukas & Lukas, 2006a; CitationMcDougall, 2001, Citation2013; CitationRea, Whalley, Evans, Gordon, & McDougall, 1998), thereby replacing earlier notions of more restricted, alpine styles of glaciation (CitationSissons, 1977, Citation1980).
Different landform assemblages appear to dominate different locations on the map, although some of this variation does result from diverse mapping styles in the literature. Much of the areas covered by the main mountain icefields are occupied by widespread ‘hummocky moraine’. The moraines are sometimes organised into linear ridges, representing recessional moraines or form a chaotic sea of mounds. These recessional moraines mark the retreat of the glaciers back to their source, for example, in the Uig on the Isle of Lewis (CitationBallantyne, 2006). Elsewhere, such as Srath Mor and the upper Loch Ainort basin on the Isle of Skye, they appear to show that an earlier period of oscillatory retreat was followed by in situ stagnation of the ice (CitationBenn, Lowe, & Walker, 1992). In the Central Scottish Highlands, a rather different landform assemblage is apparent. The extensive plateau areas of the Gaick and Monadhliath show impressive sequences of meltwater channels, suggesting the significant role of meltwater drainage in the behaviour of these ice masses (CitationBoston, 2012; CitationSissons, 1974).
Across Britain, but particularly at sites where environmental conditions were only marginally suitable for glacier development, the importance of glacier aspect is crucial. There is a clear predominance of glaciers with northerly to easterly aspects (CitationBendle & Glasser, 2012; CitationShakesby, 2007), which offer protection from insolation and are sites with a higher potential to receive nourishment of windblown snow from the west. This is particularly the case when plateau or upland areas are found immediately southwest of the glacier, in the direction of the predominant winds. At such locations, confidently identifying whether glaciers or snowbeds occupied certain locations has often challenged researchers (CitationCarr & Coleman, 2007; CitationShakesby & Matthews, 1993). The similarity in morphology between end moraines and protalus ramparts has required the use of other methods, such as glaciological modelling or sedimentological investigations, to differentiate between the two landform types (CitationCarr, 2001; CitationShakesby & Matthews, 1993).
There are a number of ways in which the outputs from this project can be used. An obvious step is the compilation of a systematic evidence-based reconstruction of the LLS ice masses. Although reconstructions of LLS ice extent in specific locations are common in the literature, this project aids comparison of the ice extent at larger scales, helping to identify trends in the distribution of ice. Furthermore, there is the potential to fine tune pre-existing reconstructions in areas that might have subsequently been re-mapped. The addition of absolute dates from the literature to this database will enable a more detailed understanding of the retreat dynamics of LLS ice. Although numerical modelling has previously been undertaken to determine the extent of LLS ice (CitationGolledge et al., 2008), the outputs of this project provide a landform record which has the potential to aid in developing models to more accurately reconstruct glacier dynamics.
4. Conclusions
This paper has compiled the glacial geomorphological evidence of LLS glaciation in Britain from the published literature into a GIS database that contains over 89,000 individual features.
Where possible, original maps were collected and georeferenced into ArcMap and the evidence from these was digitised into a series of layers relating to landform type. Although great efforts were made to include all evidence, some maps did not provide sufficient geographic information to allow georeferencing and had to be excluded. Similarly, it is possible that some sources have been overlooked during investigation of the literature.
As the accuracy of the database relies heavily on that of the original publications, the source of each feature is included in its attribute data in the GIS.
By overcoming the non-systematic nature of compilation of the evidence for LLS glaciation, it is hoped that this map and GIS database will form the catalyst for a range of potential investigations concerning the extent, retreat patterns and dynamics of LLS ice masses in Britain.
Software
Geomorphological maps were georeferenced and landforms were digitised in ESRI ArcGIS. Grids were added to some maps in Adobe Photoshop and the final map was produced in Adobe Illustrator.
Data
The geomorphology shapefiles created for this project are designed to be used in ArcMap. The files will be released as supplementary material alongside this paper at the time of publication.
The glacial geomorphology of the Loch Lomond Stadial in Britain: a map and GIS resource of published evidence.pdf
Download PDF (221.8 MB)The glacial geomorphology of the Loch Lomond Stadial in Britain: a map and GIS resource of published evidence.zip
Download Zip (32.7 MB)The glacial geomorphology of the Loch Lomond Stadial in Britain: a map and GIS resource of published evidence.docx
Download MS Word (29.3 KB)Acknowledgments
Jacob Bendle, Clare Boston, Andrew Finlayson, Sven Lukas and Derek McDougall are gratefully acknowledged for providing the authors with digital data from their original mapping. Thanks also go to John Abraham, Jeremy Ely and Andrew Finlayson for their helpful and constructive reviews of this paper and to the editors Chris Clark and Mike Smith.
Disclosure statement
No potential conflict of interest was reported by the authors.
Additional information
Funding
Related Research Data
References
- Ballantyne, C. K. (1989). The Loch Lomond readvance on the Isle of Skye, Scotland: Glacier reconstruction and palaeoclimatic implications. Journal of Quaternary Science, 4(2), 95–108. doi: 10.1002/jqs.3390040201
- Ballantyne, C. K. (2006). Loch Lomond Stadial glaciers in the Uig hills, western Lewis, Scotland. Scottish Geographical Journal, 122(4), 256–273. doi: 10.1080/14702540701235001
- Ballantyne, C. K. (2007). Loch Lomond Stadial glaciers in North Harris, Outer Hebrides, north-west Scotland: Greconstruction and palaeoclimatic implications. Quaternary Science Reviews, 26(25–28), 3134–3149. doi: 10.1016/j.quascirev.2007.09.001
- Ballantyne, C. K. (2012). Chronology of glaciation and deglaciation during the Loch Lomond (Younger Dryas) Stade in the Scottish highlands: Implications of recalibrated 10Be exposure ages. Boreas, 41(4), 513–526. doi: 10.1111/j.1502-3885.2012.00253.x
- Bendle, J. M., & Glasser, N. F. (2012). Palaeoclimatic reconstruction from late glacial (Younger Dryas Chronozone) cirque glaciers in Snowdonia, North Wales. Proceedings of the Geologists’ Association, 123(1), 130–145. doi: 10.1016/j.pgeola.2011.09.006
- Benn, D. I. (1990). Scottish late glacial moraines: Debris supply, genesis and significance (Unpublished PhD Thesis). University of St Andrews.
- Benn, D. I. (1992). The genesis and significance of ‘hummocky moraine’: Evidence from the Isle of Skye, Scotland. Quaternary Science Reviews, 11(7), 781–799. doi: 10.1016/0277-3791(92)90083-K
- Benn, D. I. (1993). Scottish landform examples – 9: Moraines in Coire na Creiche, Isle of Skye. Scottish Geographical Magazine, 109(3), 187–191. doi: 10.1080/00369229318736899
- Benn, D. I., & Ballantyne, C. K. (2005). Palaeoclimatic reconstruction from Loch Lomond readvance glaciers in the West Drumochter Hills, Scotland. Journal of Quaternary Science, 20(6), 577–592. doi: 10.1002/jqs.925
- Benn, D. I., Lowe, J. J., & Walker, M. J. C. (1992). Glacier response to climatic change during the Loch Lomond Stadial and early Flandrian: Geomorphological and palynological evidence from the Isle of Skye, Scotland. Journal of Quaternary Science, 7(2), 125–144. doi: 10.1002/jqs.3390070205
- Bennett, M. R. (1991). Scottish “hummocky moraine”: Its implications for the deglaciation of the North West highlands during the Younger Dryas or Loch Lomond Stadial (Unpublished PhD Thesis). University of Edinburgh.
- Bennett, M. R., & Boulton, G. S. (1993). Deglaciation of the Younger Dryas or Loch-Lomond Stadial ice-field in the northern Highlands, Scotland. Journal of Quaternary Science, 8(2), 133–145. doi: 10.1002/jqs.3390080206
- Boston, C. M. (2012). A glacial geomorphological map of the Monadhliath Mountains, Central Scottish Highlands. Journal of Maps, 8(4), 437–444. doi: 10.1080/17445647.2012.743865
- Boulton, G. S., Chroston, P. N., & Jarvis, J. (1981). A marine seismic study of late Quaternary sedimentaion and inferred glacier fluctuations along western Inverness-shire, Scotland. Boreas, 10(1), 39–51. doi: 10.1111/j.1502-3885.1981.tb00467.x
- Brown, V. H., Evans, D. J. A., & Evans, I. S. (2011). The glacial geomorphology and surficial geology of the south-west English lake district. Journal of Maps, 7(1), 221–243. doi: 10.4113/jom.2011.1187
- Brown, V. H., Evans, D. J. A., Vieli, A., & Evans, I. S. (2013). The Younger Dryas in the English lake district: Reconciling geomorphological evidence with numerical model outputs. Boreas, 42(4), 1022–1042.
- Carr, S. J. (2001). A glaciological approach for the discrimination of Loch Lomond Stadial glacial landforms in the Brecon Beacons, South Wales. Proceedings of the Geologists’ Association, 112(3), 253–262. doi: 10.1016/S0016-7878(01)80005-5
- Carr, S. J., & Coleman, C. G. (2007). An improved technique for the reconstruction of former glacier mass-balance and dynamics. Geomorphology, 92(1–2), 76–90. doi: 10.1016/j.geomorph.2007.02.008
- Carr, S. J., Coleman, C. G., Evans, D. J. A., Porter, E. M., & Rea, B. R. (2007). Glacier reconstruction and energy balance modelling of scarp-foot landforms at the Mynydd Du (Black Mountain). In S. J. Carr, C. G. Coleman, A. J. Humpage, & R. A. Shakesby (Eds.), The quaternary of the Brecon beacons: Field guide (pp. 57–65). London: Quaternary Research Association.
- Charlesworth, J. K. (1955). The late-glacial history of the highlands and Islands of Scotland. Transactions of the Royal Society of Edinburgh, 62(3), 769–928. doi: 10.1017/S0080456800009443
- Clark, C. D. (1997). Reconstructing the evolutionary dynamics of former ice sheets using multi-temporal evidence, remote sensing and GIS. Quaternary Science Reviews, 16(9), 1067–1092. doi: 10.1016/S0277-3791(97)00037-1
- Clark, C. D., Evans, D. J. A., Khatwa, A., Bradwell, T., Jordan, C. J., Marsh, S. H., … Bateman, M. D. (2004). Map and GIS database of glacial landforms and features related to the last British Ice Sheet. Boreas, 33(4), 359–375. doi: 10.1080/03009480410001983
- Clark, C. D., Hughes, A. L. C., Greenwood, S. L., Jordan, C. J., & Sejrup, H. P. (2012). Pattern and timing of retreat of the last British-Irish Ice Sheet. Quaternary Science Reviews, 44, 112–146. doi: 10.1016/j.quascirev.2010.07.019
- Dix, J. K., & Duck, R. W. (2000). A high-resolution seismic stratigraphy from a Scottish sea loch and its implications for Loch Lomond Stadial deglaciation. Journal of Quaternary Science, 15(6), 645–656. doi: 10.1002/1099-1417(200009)15:6<645::AID-JQS559>3.0.CO;2-Q
- Evans, D. J. A., Clark, C. D., & Mitchell, W. A. (2005). The last British ice sheet: A review of the evidence utilised in the compilation of the Glacial Map of Britain. Earth-Science Reviews, 70(3–4), 253–312. doi: 10.1016/j.earscirev.2005.01.001
- Finlayson, A. G., Golledge, N. R., Bradwell, T., & Fabel, D. (2011). Evolution of a late glacial mountain icecap in northern Scotland. Boreas, 40(3), 536–554. doi: 10.1111/j.1502-3885.2010.00202.x
- Golledge, N. R. (2010). Glaciation of Scotland during the Younger Dryas stadial: A review. Journal of Quaternary Science, 25(4), 550–566. doi: 10.1002/jqs.1319
- Golledge, N. R., Hubbard, A., & Sugden, D. E. (2008). High-resolution numerical simulation of Younger Dryas glaciation in Scotland. Quaternary Science Reviews, 27(9–10), 888–904. doi: 10.1016/j.quascirev.2008.01.019
- Harrison, S., Anderson, E., & Patel, D. (2006). The eastern margin of glaciation in the British Isles during the Younger Dryas: The Bizzle Cirque, southern Scotland. Geografiska Annaler, Series A: Physical Geography, 88(3), 199–207. doi: 10.1111/j.1468-0459.2006.00295.x
- IGS. (1977). Quaternary map of the United Kingdom. Institute of Geological Sciences, Map at 1:625,000 scale. London: HMSO.
- Lukas, S. (2006). Morphostratigraphic principles in glacier reconstruction – a perspective from the British Younger Dryas. Progress in Physical Geography, 30(6), 719–736. doi: 10.1177/0309133306071955
- Lukas, S., & Bradwell, T. (2010). Reconstruction of a late glacial (Younger Dryas) mountain ice field in Sutherland, northwestern Scotland, and its palaeoclimatic implications. Journal of Quaternary Science, 25(4), 567–580. doi: 10.1002/jqs.1376
- Lukas, S., & Lukas, T. (2006a). A glacial geological and geomorphological map of the far NW Highlands, Scotland. Part 1. Journal of Maps, 2(1), 43–55. doi: 10.4113/jom.2006.50
- Lukas, S., & Lukas, T. (2006b). A glacial geological and geomorphological map of the far NW Highlands, Scotland. Part 2. Journal of Maps, 2(1), 56–58. doi: 10.4113/jom.2006.55
- MacLeod, A., Palmer, A. P., Lowe, J. J., Rose, J., Bryant, C., & Merritt, J. W. (2011). Timing of glacier response to Younger Dryas climatic cooling in Scotland. Global and Planetary Change, 79(3–4), 264–274. doi: 10.1016/j.gloplacha.2010.07.006
- McCormack, D. C. (2011). The style and timing of the last deglaciation of Wester Ross, Northwest Scotland (Unpublished PhD Thesis). University of Manchester.
- McDougall, D. A. (2001). The geomorphological impact of Loch Lomond (Younger Dryas) Stadial plateau icefields in the central Lake District, northwest England. Journal of Quaternary Science, 16(6), 531–543. doi: 10.1002/jqs.624
- McDougall, D. A. (2013). Glaciation style and the geomorphological record: evidence for Younger Dryas glaciers in the eastern Lake District, northwest England. Quaternary Science Reviews, 73, 48–58. doi: 10.1016/j.quascirev.2013.05.002
- McIntyre, K. A., Howe, J. A., & Bradwell, T. (2011). Late glacial ice extent and deglaciation of Loch Hourn, western Scotland. Scottish Journal of Geology, 47(2), 169–178. doi: 10.1144/0036-9276/01-433
- Rea, B. R., Whalley, W. B., Evans, D. J. A., Gordon, J. E., & McDougall, D. A. (1998). Plateau Icefields: Geomorphology and Dynamics. Quaternary Proceedings, 6, 35–54.
- Rose, J. (1980). In W. G. Jardine (Ed.), Glasgow region field guide (pp. 22–23). Glasgow: Quaternary Research Association.
- Rose, J. (1981). Field guide to the Quaternary geology of the south-eastern part of the Loch Lomond basin. Proceedings of the Geological Society of Glasgow, 1980–1981, 12–28.
- Rose, J., & Smith, M. J. (2008). Glacial geomorphological maps of the Glasgow region, western central Scotland. Journal of Maps, 4(1), 399–416. doi: 10.4113/jom.2008.1040
- Shakesby, R. A. (2007). Mynydd Du (Black Mountain): Origins of the scarp-foot depositional landforms. In S. J. Carr, C. G. Coleman, A. J. Humpage, & R. A. Shakesby (Eds.), The quaternary of the Brecon beacons: Field guide (pp. 48–56). London: Quaternary Research Association.
- Shakesby, R. A., & Matthews, J. A. (1993). Loch Lomond Stadial glacier at Fan Hir, Mynydd Du (Brecon Beacons), South Wales: Critical evidence and palaeoclimatic implications. Geological Journal, 28(1), 69–79. doi: 10.1002/gj.3350280106
- Shakesby, R. A., & Matthews, J. A. (1996). Glacial activity and paraglacial landsliding in the Devensian late glacial: Evidence from Craig Cerrig-gleisiad and Fan Dringarth, Fforest Fawr (Brecon Beacons), South Wales. Geological Journal, 31(2), 143–157. doi: 10.1002/(SICI)1099-1034(199606)31:2<143::AID-GJ704>3.0.CO;2-K
- Sissons, J. B. (1967). The evolution of Scotland's scenery. Edinburgh: Oliver and Boyd.
- Sissons, J. B. (1972). The last glaciers in part of the south east Grampians. Scottish Geographical Magazine, 88(3), 168–181. doi: 10.1080/00369227208736225
- Sissons, J. B. (1974). A late-glacial ice cap in the central Grampians, Scotland. Transactions of the Institute of British Geographers, 62, 95–114. doi: 10.2307/621517
- Sissons, J. B. (1977). The Loch Lomond readvance in the northern mainland of Scotland. In J. M. Gray, & J. J. Lowe (Eds.), Studies in the Scottish late glacial environment (pp. 45–59). Oxford: Pergamon Press.
- Sissons, J. B. (1980). The Loch Lomond advance in the Lake District, northern England. Earth and Environmental Science Transactions of the Royal Society of Edinburgh, 71(1), 13–27. doi: 10.1017/S0263593300013468
- Sissons, J. B., & Grant, A. J. H. (1972). The last glaciers in the Lochnagar area, Aberdeenshire. Scottish Journal of Geology, 8(2), 85–93. doi: 10.1144/sjg08020085
- Small, D. P., Rinterknecht, V., Austin, W. E. N., Fabel, D., Miguens-Rodriguez, M., & Xu, S. (2012). In situ cosmogenic exposure ages from the Isle of Skye, northwest Scotland: implications for the timing of deglaciation and readvance from 15 to 11 ka. Journal of Quaternary Science, 27(2), 150–158. doi: 10.1002/jqs.1522
- Sutherland, D. G. (1981). The raised shorelines and deglaciation of the Loch Long/Loch Fyne area, western Scotland (Unpublished PhD Thesis). University of Edinburgh.
- Thompson, K. S. R. (1972). The last glaciers in Western Perthshire (Unpublished PhD Thesis). University of Edinburgh.
- Thorp, P. W. (1986). A mountain Icefield of Loch Lomond Stadial age, western Grampians, Scotland. Boreas, 15(1), 83–97. doi: 10.1111/j.1502-3885.1986.tb00746.x