
ABSTRACT
Urban areas and regions with significant natural features, scenery or cultural heritage have become the most popular sites for tourist destinations. Therefore, it is necessary to make efforts to preserve the natural environment before uncontrolled tourist infrastructure spreads. But the real situation is not clear. As the scale of tourism grows, resources become more unsustainable. A destination with a damaged environment loses its attraction and this causes an increase in the building of new tourist destinations. But the solution is not in closing areas for visitors but in finding the right level of tourist load, because money coming from tourism may help to keep the landscape sustainable. This paper shows one way of how to assess and visualize conflicts between landscape protection and sustainable tourism development for decision-makers in municipalities. On the example of the Nízký Jeseník Highlands, composite indicators dealing with specific environmental value, tourism potential and tourism infrastructure load have been proposed. Using a linear regression between most correlated data sets specific areas of different conflicts with tourism were identified and proposed for further development.
1. Introduction
Tourism has long been considered as a nature friendly part of economic activity (CitationBundesamt Für Naturschutz, 1997). However, in relation to tourism development, there is increasing evidence of adverse effects of tourism. The main cause of the negative impact of tourism on the landscape is poorly located and poorly designed tourism infrastructure (e.g. construction of ski resorts in the area with rich biodiversity) with related noise and light pollution, vibration, emissions on access roads, undisciplined movement of tourists, pollution, waste, extension of winter season by artificial snowing and many other aspects (CitationPásková, 2003). The fundamental problem is the current predominance of negative impacts of tourism, while its potential positive effect is not realized. Current tourism is rather mass oriented to short-term profit without long-term strategies for sustainable use of the landscape (CitationPásková, 2003). The goal should not be to eliminate tourist activities, proponents of tourism or conservation groups, but rather to find compromise solutions.
Sustainable tourism development meets the needs of visitors and host communities while protecting and reinforcing these opportunities for future generations. This can be achieved by acceding to management of all resources in such a way that economic, social and aesthetic needs can be fulfilled while cultural integrity, essential ecological processes, biological diversity and life support systems are maintained. From this perspective, it is important to develop alternative ways of tourism (CitationRuda, 2010). Ecotourism appears the most important in terms of biodiversity conservation.
Another problem arises connected with tourism impact assessment. Many evaluation studies, especially of tourism impact on the landscape from botanical and zoological perspectives, are limited (CitationBanaš, Hošek, & Treml, 2003; CitationCoccossis, 1996; CitationCole & Knight, 1991; CitationFahey, Wardle, & Weir, 1999; CitationGoldsmith, 1974; CitationGössling, 2002; CitationHošek, 2003). Besides their biological recommendations they do not contribute to city management to plan better municipal activities. This is the key problem for further municipality planning, because in many cases the municipality covers non-built-up areas, and the landscape must be governed from the perspective of administrative units also. The problem for tourism is not to consider only its negative impact, but also how it can help to develop the community and that is why it is important to find how tourism development can help to increase the living standards of local people.
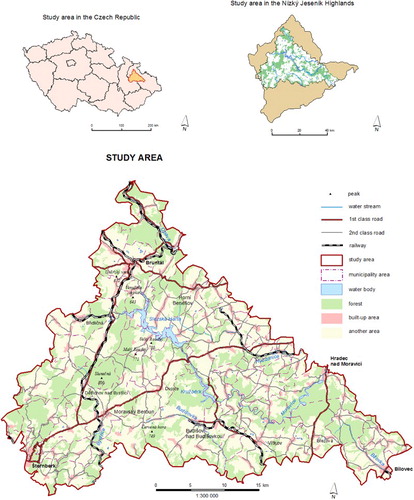
2. Study area
The Nízký Jeseník Highlands is situated in the north-eastern part of the Czech Republic and represents, within the Bohemian Massif, a flat upland bordered mainly by tectonically conditioned slopes. The study area is located between the towns Bruntál – Šternberk – Bílovec (). The area contains 64 municipalities and covers all necessary attributes important for tourism impact assessment from different perspectives. Administratively, the study area is located predominantly in the Moravian-Silesian Region, only the southern part extends into the Olomouc Region. The territory contains both, most important landscape values of the Nízký Jeseník Highlands, which makes it attractive for visitors, as well as areas of tourism with low concentrations of visitors. Major transport routes connecting Bruntál, Opava and Ostrava and Olomouc, provide access to the Protected Landscape Area Jeseníky and also to the capital of the Moravian-Silesian Region (Ostrava). Important railway tracks go around the study area and their branches (Odra – Budisov over Budišovkou, Olomouc – Krnov) extend to less accessible areas. The mosaic of landscapes is of uniformly forested and non-forested areas, contrasting with sparsely or densely populated areas.
Figure 1. Study area.
3. Materials and methods
3.1. Data sources
Tourism is an industry with a sparse database. The proposed models of partial data sets were based on the existing database Data200, which was created at the Czech Office for Surveying, Mapping and Cadastre, and on data collected from different map sources containing tourism information (mainly www.jeseniky.tourism.cz, www.nizkyjesenik.cz, www.mapy.cz, www.rybsvaz.cz, www.turistik.cz, www.turistika.cz, www.idos.cz and official websites of partial municipalities). Derived data were created based on existing ones.
3.2. Output processing
Considering factors and constraints it is suitable to use appropriate multi-criteria evaluation (MCE) approaches. CitationEffat and Hegazy (2009) state that multi-criteria decision-making (MCDM) includes both multiple attribute decision-making and multiple objective decision-making. In the case of MCDM applications, the term multi-criteria analysis (MCA) or MCE is often applied. The benefit of MCDM methods is the opportunity to work with many alternatives, which can be judged by the pros and cons of each option's properties. We can use several MCA methods. For this research points scoring based on Natural Breaks classification was applied for reclassification. During the data processing, three key data sets (specific environmental value, tourism potential and tourism infrastructure load) were proposed and assessed.
The purpose of the research was to identify municipalities highly loaded with tourism, in balance dealing with tourism and not loaded with tourism but having a potential for sustainable tourism development. The whole process was divided into four phases.
The first phase was focused on design of the data structure. It was important because of its originality and an innovation in this type of research which is based on the proposal of three composite indicators (data sets). The aim of this part was to develop three data sets: specific environmental area value (SEAV), tourism potential and tourism infrastructure load. SEAV defines the level of valuable landscape features such as protected areas, ecology stabilization and highly protected biotopes and if it is necessary to decrease the impact of human activities in these areas (CitationRuda, 2014). Tourism potential shows the ability of areas to offer different levels of tourism attraction. Tourism infrastructure load indicates a variable tourism load indicated by the presence of tourism tracks, traffic network and build-up areas.
The second phase included collecting available information and data sorting which was necessary for the database design and data management. Partial results were presented in analytical maps – choropleth maps which showed assigned values (from 1 to 5 derived by reclassification of calculated values) of each polygon (area).
The third phase was the generation of results: maps of SEAV, tourism potential and tourism infrastructure load were expressed as a sum of values within proposed data sets. The work flow procedure can be described as follows:
Data calculation
Step 1: Calculation of proportion of a feature in municipality area.
Each criterion was calculated as a proportion of a feature to municipality area. It enabled to describe the power of area.
Features weight setting
Step 2: Expert estimation of feature weights.
Data aggregation
Step 3: Multiplying of features values and estimated weight.
Step 4: Value summarizing for each municipality.
Data classification
Step 5: Classification using natural breaks method into five intervals.
Value scoring
Step 6: Assignment of scores (1–5) for attribute values of the criterion to each municipality according to position in intervals mentioned above.
Categories, themes or task group calculation
Step 7: Pairwise preferences setting and weighted geometric mean calculation for partial categories, themes or task group according to Saaty's method.
Step 8: Summarizing of calculated weights and assigned points multiplying.
Step 9: Natural breaks of SEAV classification into five classes.
The fourth phase was spatial analysis of dependence among pairs of data sets using correlation and regression. Dependence between tourism potential and tourism infrastructure load indicated how to classify areas on the basis of their distance from a regression line. This enabled the identification of municipalities with high, balanced or low influence on the landscape of the study areas. Correlation (0.67) between tourism infrastructure load and tourism potential overall was weak but within data sets very important (CitationRuda, 2010).
Linear regression enabled to see municipality distribution according to the regression line. For bigger validity, a 95% confidence interval was defined. Synthetic maps were finally derived from analytical maps which represent visualization of partial data sets values.
4. Result maps
4.1. Analytical maps
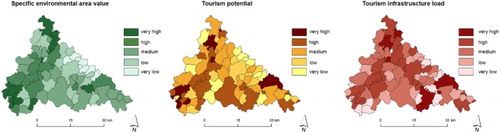
A series of analytical maps (choropleth maps) were created (). They were important for visualization and data classification. Within partial choropleth maps, specific features (density of tourist paths) calculation on area or another base (population, etc.) was used. Geo-visualization continued with the selection of suitable continuous color range. Three key choropleth maps (), which represent data set results, are based on the calculation of derived analytical maps and calculated preferences. They represent the results from the three most important data sets (see above) defining the position of each municipality within each data set.
Figure 2. Density of tourist paths in 2012.
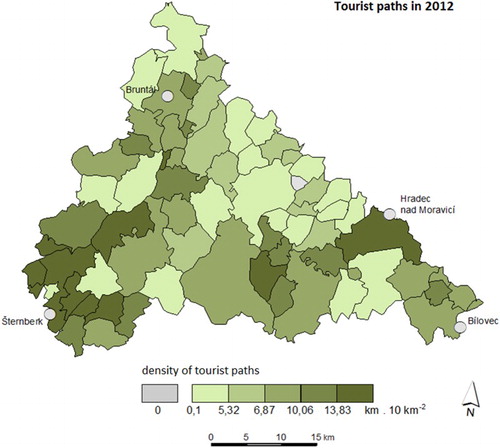
Figure 3. Choropleth maps of data sets.
4.2. Main map
Correlation analysis confirmed the linear correlation between tourism potential and tourism infrastructure load. Defining the probability of municipalities being within a 95% confidence band, 22 municipalities identified inside the band are those with a balance between tourism potential and tourism infrastructure load. Municipalities located above this zone were identified as municipalities with a high tourism infrastructure load, while those below the band indicate potential reserves for tourism. These groups were further investigated. Municipalities with high tourism infrastructure load compared to their potential were examined according to the type of load and the potential impact on environmentally valuable territories. Municipalities with low loads were split into groups with expected progressive growth of tourism or there were found no reserves for tourism.
For the creation of the final synthetic map (see Map) opposing colors were used for visualization of municipalities with a high tourism infrastructure load (red color) and municipalities with potential reserves (green color). A raster overlay was also added to distinguish if the tourism infrastructure load is on environmentally important territories or not. The same approach was used to distinguish areas with possible reserves for sustainable tourism development.
Visualization of all these analyses was created in an overview map showing conflicts between nature protection (mainly a green raster pattern showing bio-corridors) and high tourist load on environmentally valuable territories. Two embed maps also show actual landscape fragmentation displayed on AA class of bio-tops.
5. Discussion and conclusion
Anthropogenic impacts on the landscape are currently one of the most discussed topics of environmental issues. The aim of professionally presented measures of landscape professionals is to minimize or preferably eliminate the influence of human activities on environmentally valuable territories. However, the progressive development of society will have some influence on the landscape, considering the transition to different economic alternations or expanding the range of services offered by tourism. An essential starting point is to find a reasonable compromise that would allow respond to the changing demands of society, but avoid creating excessive load and land use.
The data sets were designed in detail to respect various data files. Given that the municipalities were the base polygons and it was not possible to assess accurately the landscape value within the landscape types. To mitigate this, the specific environmental value of each area was considered. Considered sub-indicators were selected based on the availability and value of meaningful data, but certainly do not cover all landscape features. The proposed data set in particular cases can be added to with additional layers, such as soil quality types and slope analysis.
Design of the potential of tourism reflects current approaches to its evaluation. Bína's methodology (Citation2002) was used, although its design for the application of the studied area seemed to be relatively inaccurate. Therefore, the resulting tourism potential was evaluated as the sum of the localization and realization assumptions. When comparing the correlation dependence of the individual data sets, these two data sets revealed assumptions of existing dependence, which was used for the determination of the equivalence between them.
The last data set represents the tourism infrastructure load. It would have been desirable to have data from the actual counting of visitors and also of tourism infrastructure. To obtain data from a physical census seemed difficult and the infrastructure itself may provide a distorted picture of the total load. Based on the outputs of the marketing study for the Moravian-Silesian Region, which showed that the area of the Nízký Jeseník Highlands belongs to newly popular tourist destinations, a compromise solution was used. The derived outputs were calculated based on the existing infrastructure but considering the size of population in municipalities in order to establish partial sub-indicator of load of built-up areas and hiking trails, the frequency of daily connections to the railways and the daily number of passing cars in the case of road transport.
Another important part of the work was statistical analysis and data evaluation. Since the basic data sets described disparate components, it was necessary to determine the level of importance or weight. For this purpose an MCE of alternatives was used, Saaty's method of pairwise comparisons. It assigned specific weights to each thematic group. The disadvantage of this method is a considerable level of subjectivity, but on the other hand, it should be emphasized that in the case of the determination by one person one source of error is minimized.
To avoid mere verbal evaluation of the impact of tourism, it was necessary to quantify this phenomenon. Correlation analysis of the data sets and inspection of distances of municipalities from the linear trend give a final definition of the impact of tourism. Correlation analysis of data sets appeared to be an effective procedure.
In the case of tourism potential and tourism infrastructure load, overall it showed a weak relation, but within investigated data set relatively strong dependency. This finding was further used for formulating the load depending on tourism potential. The calculated regression line and 95% confidence band defined municipalities with some balance. Above the regression line toward increasing values, municipalities with high load can be found and below the line toward increasing levels of tourism potential, by contrast, there are municipalities with certain reserves.
As it was described, this survey might serve the municipality management for decision-making or partnership seeking.
Software
Analyses were processed as well as geo-visualization (creation of analytical and synthetic maps) and setting classes for choropleth maps in ArcGIS for Desktop 10.1.
Spatial decision support using data geovisualization: the example of the conflict between landscape protection and tourism development.pdf
Download PDF (3.4 MB)Disclosure statement
No potential conflict of interest was reported by the author.
Related Research Data
References
- Banaš, M., Hošek, J., & Treml, V. (2003). Plán péče národní přírodní rezervace Praděd, kapitola cestovní ruch. Manuskript, správa CHKO ČR.
- Bína, J. (2002). Hodnocení potenciálu cestovního ruchu v obcích České republiky. Urbanismus a územní rozvoj, 5, 2–11.
- Bundesamt für Naturschutz. (Ed.). (1997). Biodiversität und Tourismus. Konflikte und Lösungsansätze an den Küsten der Weltmeere. Berlin: Springer.
- Coccossis, H. (1996). Tourism and sustainability: Perspectives and implications. In G. K. Priestley, J. A. Edwards, & H. Coccossis (Eds.), Sustainable tourism? European experiences (pp. 1–21). Wallingford, CT: CAB International.
- Cole, D., & Knight, R. (1991). Wildlife preservation and recreational use: Conflicting goals of wildland management in recreational impacts on wildlife in wildlands. Fort Collins, CO: Rocky Mountain Research Station.
- Effat, H., & Hegazy, M. N. (2009). Cartographic modeling and multicriteria evaluation for exploring the potentials for tourism development in the Suez governorate, Egypt. Environmental Issues, Sustainable Development, Millennium Development Goals, 1, 11–18.
- Fahey, B., Wardle, K., & Weir, P. (1999). Environmental effects associated with snow grooming and skiing at Treble Cone Ski Field. Science for Conservation, 120, 49–62.
- Goldsmith, F. B. (1974). Ecological effects of visitors in the countryside. London: John Wiley & Sons.
- Gössling, S. (2002). Global environmental consequences of tourism. Global Environmental Change, 12, 283–302. doi: 10.1016/S0959-3780(02)00044-4
- Hošek, J. (2003). Vliv rekreačního využití na stav a vývoj biotopů ve vybraných VCHÚ (CHKO Beskydy, Krkonošský národní park, CHKO Jeseníky, Národní park a CHKO Šumava). Zpráva o řešení projektu za rok 2003, Hořovice.
- Pásková, M. (2003). Změny geografického prostředí vyvolané rozvojem cestovního ruchu ve světle kritickorealistické metodologie [Disertation thesis]. Univerzita Karlova v Praze, Přírodovědecká fakulta, Katedra sociální geografie a regionálního rozvoje, 205 p.
- Ruda, A. (2010). Contribution to assessment of the tourism impact on landscape. Acta Universitatis Carolinae Geographica. Praha, Karolinum, XLV(1), 61–74.
- Ruda, A. (2014). Environmental potential identification on the example of the Nízký Jeseník Highlands. Acta Universitatis Agriculturae et Silviculturae Mendelianae Brunensis, 62, 1095–1102. doi: 10.11118/actaun201462051095